Abstract
Uridine 5′-diphosphate-glucuronosyltransferases (UGTs) are phase II drug-metabolizing enzymes that catalyze glucuronidation of various endogenous and exogenous substrates. Among 19 functional human UGTs, UGT1A family enzymes largely contribute to the metabolism of clinically used drugs. While the UGT1A locus is conserved in mammals such as humans, mice, and rats, species differences in drug glucuronidation have been reported. Recently, humanized UGT1 mice in which the original Ugt1 locus was disrupted and replaced with the human UGT1 locus (hUGT1 mice) have been developed. To evaluate the usefulness of hUGT1 mice to predict human glucuronidation of drugs, UGT activities, and inhibitory effects on UGTs were examined in liver microsomes of hUGT1 mice as well as in those of wild-type mice and humans. Furosemide acyl-glucuronidation was sigmoidal and best fitted to the Hill equation in hUGT1 mice and human liver microsomes, while it was fitted to the substrate inhibition equation in mouse liver microsomes. Kinetic parameters of furosemide glucuronidation were very similar between hUGT1 mice and human liver microsomes. The kinetics of S-naproxen acyl-glucuronidation and inhibitory effects of compounds on furosemide glucuronidation in hUGT1 liver microsomes were also slightly, but similar to those in human liver microsomes, rather than in wild-type mice. While wild-type mice lack imipramine and trifluoperazine N-glucuronidation potential, hUGT1 mice showed comparable N-glucuronidation activity to that of humans. Our data indicate that hUGT1 mice are promising tools to predict not only in vivo human drug glucuronidation but also potential drug-drug interactions.
Keywords: drug metabolism, Humanized animal model, species difference, UDP-glucuronosyltransferase, UGT
Introduction
Uridine 5′-diphosphate (UDP)-glucuronosyltransferases (UGTs) are phase II drug-metabolizing enzymes that catalyze glucuronidation of compounds by transferring glucuronic acid from a co-substrate, UDP-glucuronic acid, to substrates (Dutton 1980). The family of UGTs has been classified into two subfamilies, UGT1 and UGT2, on the basis of evolutionary divergence (Mackenzie et al. 2005). The UGT1 locus is located on chromosome 2q37 and encodes multiple unique exons 1 and common exons 2–5, producing nine functional UGT1A isoforms, UGT1A1, UGT1A3, UGT1A4, UGT1A5, UGT1A6, UGT1A7, UGT1A8, UGT1A9, and UGT1A10 (Ritter et al. 1992). In the liver, which is known as the most important tissue for detoxification, UGT1A1, UGT1A3, UGT1A4, UGT1A6, and UGT1A9 are expressed (Tukey and Strassburg 2000). The UGT2A and UGT2B genes are located on chromosome 4q13, encoding three and seven functional proteins, respectively (Mackenzie et al. 2005). The UGT2A1 and UGT2A2 genes are formed by exon sharing of variable first exons and common exons 2–6, similar to the mechanisms associated with the UGT1 locus (Mackenzie et al. 2005). Meanwhile, UGT2A3 and each UGT2B are encoded by individual genes (Mackenzie et al. 2005). Each of the UGTs is expressed in a tissue-specific manner and exhibits substrate specificity (Tukey and Strassburg 2000). The UGT1A family of proteins is responsible for more than 50% of the glucuronidation potential of most prescribed drugs (Williams et al. 2004).
The UGT1 locus is conserved in mammals such as humans, mice, and rats (Mackenzie et al. 2005). Therefore, to predict glucuronidation potential of drugs in humans, not only in vitro systems such as recombinant human UGTs have been used (Katoh et al. 2007) but also experimental animal models have been employed (Deguchi et al. 2011). Although most drugs that are glucuronidated in rodents are also conjugated in humans, species differences in the pattern of glucuronidation are extensive. One of the key differences is attributed to the fact that rodents lack a gene corresponding to human UGT1A4, which encodes a UGT1A4 protein that is responsible for N-glucuronidation of primary, secondary, and tertiary amine-containing xenobiotics such as imipramine and trifluoperazine (Nakajima et al. 2002; Uchaipichat et al. 2006). Glucuronidation of certain drugs containing carboxyl- or hydroxyl-moieties, such as furosemide and naproxen are also different among species (Rachmel and Hazelton 1986; el Mouelhi et al. 1993; Kerdpin et al. 2008). The metabolite of carboxylic acid drugs, acyl-glucuronide, is a reactive metabolite that can bind cellular proteins and DNA to form protein- and DNA-adducts, which have been associated with the development of adverse reactions such as hepatotoxicity (Koga et al. 2011). To predict and avoid human-specific drug-induced toxicities, species differences in glucuronidation need to be carefully evaluated. To overcome the species difference in drug glucuronidation, chimeric mice with humanized livers were established by transplanting human hepatocytes into an urokinase-type plasminogen activator+/+/severe combined immunodeficient transgenic mouse line (Katoh et al. 2008). In these mice, the replacement of their livers with human hepatocytes ranged from 80% to 90%. However, accumulating evidence has indicated that contribution of extrahepatic UGTs to metabolism of drugs could not be eliminated, as certain isoforms such as UGT1A8 and UGT1A10 are mainly expressed in the gastrointestinal tract and play an important role in drug metabolism (Mizuma 2009).
Humanized UGT1 mice in which the original Ugt1 locus was disrupted and replaced with the human UGT1 locus (hUGT1 mice) have been recently developed (Cai et al. 2010; Fujiwara et al. 2010, 2012). In this study, UGT activities along with inhibitory and heterotropic effects on UGTs were examined in liver microsomes of hUGT1 mice, humans, and wild-type mice to evaluate the use of hUGT1 mice to predict glucuronidation of drugs in human drug metabolism.
Materials and Methods
Chemicals and reagents
UDP-glucuronic acid, furosemide, estradiol, serotonin, 3′-azido-3′-deoxythymidine (AZT), and alamethicin were purchased from Sigma–Aldrich (St Louis, MO). S-Naproxen was purchased from Cayman Chemicals (Ann Arbour, MI). Furosemide acyl-glucuronide and S-Naproxen acyl-glucuronide were purchased from Toronto Research Chemicals (Toronto, ON, Canada). Imipramine and trifluoperazine were purchased from Wako Pure Chemical (Osaka, Japan). All other chemicals and solvents were of analytical grade or the highest grade commercially available. Human and male mouse liver microsomes were obtained from BD Gentest (Woburn, MA).
Animals and preparation of liver microsomes
Tg(UGT1A1*28)Ugt1−/− (hUGT1) mice were developed previously in a C57BL/6 background (Fujiwara et al. 2010). All animals received food and water ad libitum, and mouse handling and experimental procedures were conducted in accordance with our animal care protocol approved by Kitasato University. For tissue collections, mice were anesthetized by diethyl ether inhalation, and the liver was perfused with ice-cold 1.15% KCl. The skin and liver were rinsed in cold 1.15% KCl and stored at −80°C. Liver microsomes from male hUGT1 mice were prepared using the following procedure. Perfused liver with 1.15% KCl was homogenized in three volumes of Tris-buffered saline (25 mmol/L Tris-HCl buffer [pH 7.4], 138 mmol/L NaCl, and 2.7 mmol/L KCl). The homogenate was centrifuged at 10,000g for 30 min at 4°C, and the supernatant was collected. The supernatant was centrifuged at 105,000g for 60 min at 4°C, and the pellet was suspended in the same buffer and used as the microsomal fraction. Protein concentrations of microsomal fractions were measured by the Bradford method using BSA as a standard (Bradford 1976).
Enzyme assays
Furosemide and S-naproxen acyl-glucuronide formation was determined according to the method of Fujiwara et al. (2007b) with slight modifications. Briefly, a typical incubation mixture (200 μL of total volume) contained 100 mmol/L phosphate buffer (pH 7.4), 4 mmol/L MgCl2, 5 mmol/L UDP-glucuronic acid (UDPGA), 50 μg/mL alamethicin, 0.1 mg/mL liver microsomes and 50 μmol/L–5 mmol/L furosemide or 25 μmol/L–2 mmol/L S-naproxen. For an inhibition study, 5–200 μmol/L of estradiol, 0.05–4 mmol/L imipramine, 0.2–5 mmol/L serotonin, 10–1000 μmol/L propofol, and 500 μmol/L AZT were included in the reaction mixtures. To investigate the effects of bovine serum albumin (BSA) on the furosemide glucuronidation in the liver microsomes, 0–0.5% BSA was included in the reaction mixtures. The reaction was initiated by the addition of UDPGA after a 3-min preincubation at 37°C. After incubation at 37°C for 30 min, the reaction was terminated by addition of 200 μL of cold acetonitrile. After removal of the protein by centrifugation at 12,000g for 5 min, a 50-μL portion of the sample was subjected to HPLC. The enzyme assays were conducted under conditions which were linear with respect to time (<60 min) and protein content (0.4 mg/mL). As shown in Figure S1, incubation of furosemide acyl-glucuronide with liver microsomes did not decrease the amount of the acyl-glucuronide, indicating that acyl-glucuronide was stable in our enzyme assays. We used CD-1 mice liver microsomes for the control experiments; however, this is because it was demonstrated previously that liver microsomes from different mouse strains exhibited very similar kinetic parameters for drug glucuronidations (Shiratani et al. 2008).
HPLC conditions
The formation of glucuronides was determined by the HPLC system with a LC-10AD pump (Shimadzu, Kyoto, Japan), a FP-2020 fluorescence detector (JASCO, Tokyo Japan), a SPD-10A UV detector (Shimadzu) a SIL-10A autosampler (Shimadzu), a SLC-10A system controller (Shimadzu) and a Mightysil RP-18 GP column (4.6 × 150 mm, 5 μm; Kanto Chemical, Tokyo, Japan). The mobile phases were 30% acetonitrile containing 15 mmol/L phosphate for the furosemide glucuronide, 35% acetonitrile containing 0.12% acetic acid for the S-naproxen glucuronide, 33% acetonitrile containing 15 mmol/L monosodium phosphate for trifluoperazine N-glucuronide, and 22.5% acetonitrile containing 50 mmol/L monosodium phosphate for imipramine N-glucuronide; the flow rate was 1.0 mL/min. Detection was accomplished using a fluorescence detector at 345-nm excitation and 450-nm emission for the furosemide glucuronide and at 230-nm excitation and 355-nm emission for the S-naproxen glucuronide. Detection of the imipramine and trifluoperazine N-glucuronide was accomplished with a UV detector at 256 nm and 205 nm, respectively. Quantification of furosemide and that of naproxen glucuronides was carried out by comparing the HPLC peak area to that of the authentic standard. The imipramine and trifluoperazine N-glucuronide formation was determined as reported previously (Fujiwara et al. 2007a). The retention times of furosemide glucuronide, naproxen glucuronide, imipramine glucuronide, and trifluoperazine glucuronide were 5.2, 6.5, 25.2, and 18.7 min, respectively.
Equations
When kinetics of drug metabolism was typical and followed Michaelis–Menten kinetics, the relationship between substrate concentration and velocity was obtained by the Michaelis–Menten equation (1):
| (1) |
where V is the velocity of the metabolic reaction and S is the substrate concentration. The Vmax is the maximum rate of metabolism and Km is the Michaelis constant, which is defined as the substrate concentration at 1/2 the maximum velocity. While the clearance rate is substrate concentration-dependent, the rate is constant when the substrate concentration is much smaller than Km, providing the parameter, intrinsic clearance (CLint) (eq. 2):
| (2) |
For sigmoidal kinetics, kinetic parameters were obtained by the Hill equation (3):
| (3) |
where S50 is the substrate concentration showing the 1/2 Vmax and n is the Hill coefficient. While the clearance rate is substrate concentration-dependent, the maximum clearance rate, CLmax, can be described by equation (4): (Houston and Kenworthy 2000)
| (4) |
Substrate inhibition kinetics was analyzed by equation (5):
| (5) |
where Ksi is the constant describing the substrate inhibition interaction.
IC50 values were directly determined from linear regression.
Results
Furosemide glucuronidation in liver microsomes from hUGT1 mice, human, and regular mice
Furosemide is a drug that is subject to species-different glucuronidation (Rachmel and Hazelton 1986; Kerdpin et al. 2008). To examine whether furosemide glucuronidation in hUGT1 mice is similar to that in humans, liver microsomes were prepared from adult hUGT1 mice and furosemide glucuronidation was determined. The furosemide acyl-glucuronide formation by the liver microsomes from hUGT1 mice followed the Hill equation (Fig. 1A), yielding S50 = 715 μmol/L, Vmax = 673 pmol/min/mg, Hill coefficient, n = 1.30, and CLmax = 0.55 μL/min/mg (Table 1). Eadie–Hofstee plots were not linear (Fig. 1B), supporting the fact that the furosemide glucuronidation in liver microsomes from hUGT1 mice was sigmoidal. In human liver microsomes, the furosemide acyl-glucuronide formation also followed the Hill equation (Fig. 1A) as Eadie–Hofstee plots were not linear (Fig. 1B), yielding S50 = 681 μmol/L, and Vmax = 576 pmol/min/mg, Hill coefficient = 1.30, CLmax = 0.50 μL/min/mg (Table 1). In contrast, the furosemide acyl-glucuronide formation by mouse liver microsomes followed the Michaelis–Menten equation with a substrate inhibition as Eadie–Hofstee plots curved at a higher substrate concentration (Fig. 1A and B), yielding Km = 405 μmol/L, Vmax = 998 pmol/min/mg, Ki = 12.2 mmol/L, and CLint = 2.47 μL/min/mg (Table 1). These data confirmed that furosemide was species-differently glucuronidated in liver microsomes, as the kinetics was sigmoidal in humans, while it was typical in mice. Furosemide glucuronidation in hUGT1 mice showed sigmoidal kinetics, similar to the kinetic pattern formed in human liver microsomes. The clearance values predicted using hUGT1 liver and human liver microsomes were similar, 0.55 and 0.50 μL/min/mg, respectively. In contrast, the clearance value of wild-type mice was dramatically higher, 2.47 μL/min/mg. These results indicate that hUGT1 mice can be used to predict furosemide glucuronidation in humans, quantitatively.
Figure 1.
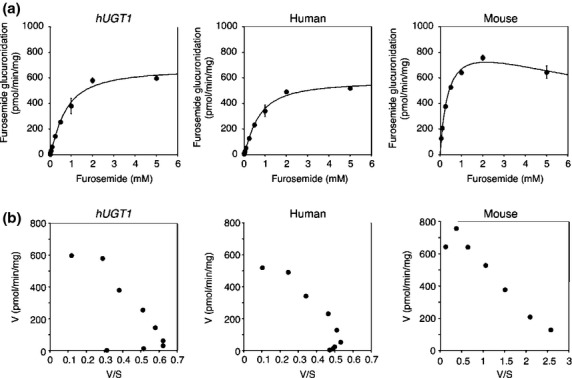
Kinetic analyses of furosemide acyl-glucuronide formation in liver microsomes. The substrate concentration-velocity curves (A) and Eadie–Hofstee plots (B) of the furosemide glucuronide formation are shown. Pooled liver microsomes of hUGT1 mice, humans, and regular mice were incubated with 50 μmol/L to 5 mmol/L furosemide and 5 mmol/L UDP-glucuronic acid at 37°C for 30 min. In the substrate concentration-velocity curves, data are the means ± SD of three independent determinations. In the Eadie–Hofstee plots, each data point represents the mean of three independent experiments.
Table 1.
Kinetic parameters of furosemide glucuronidation in liver microsomes
| Liver microsomes | Equation | Km or S50 (μmol/L) | n | Vmax | Ki | CLint or CLmax (μL/min/mg) |
|---|---|---|---|---|---|---|
| Humanized UGT1 mice | Hill | 715 ± 103 | 1.30 ± 0.14 | 673 ± 21 pmol/min/mg | — | 0.55 ± 0.06 |
| Human | Hill | 681 ± 124 | 1.30 ± 0.12 | 576 ± 21 pmol/min/mg | — | 0.50 ± 0.07 |
| Regular mice | Substrate inhibition | 405 ± 14 | — | 998 ± 40 pmol/min/mg | 12.2 ± 3.8 mmol/L | 2.47 ± 0.2 |
S-Naproxen glucuronidation in liver microsomes from hUGT1 mice, human, and mice
It has been reported that naproxen was glucuronidated differently when comparing metabolism between human and rodents (el Mouelhi et al. 1993). S-Naproxen glucuronidation in hUGT1 mice, human and wild-type mice liver microsomes was determined and the kinetics was analyzed. Although the S-naproxen acyl-glucuronide formation by the liver microsomes from hUGT1 mice was best fitted to the Hill equation as the Eadie–Hofstee plots were not linear at lower substrate concentrations, the Hill coefficient was 1.0, indicating that there is no cooperativity (Fig. 2). Therefore, the kinetic parameters of S-naproxen acyl-glucuronide formation were obtained by the Michaelis–Menten equation. In the liver microsomes from hUGT1 mice, the S-naproxen acyl-glucuronide formation yielded Km = 465 μmol/L, Vmax = 5.60 nmol/min/mg, and CLint = 12.0 μL/min/mg (Table 2). In human liver microsomes, the S-naproxen acyl-glucuronide formation also followed the Michaelis–Menten equation (Fig. 2), yielding Km = 308 μmol/L, Vmax = 1.72 nmol/min/mg, and CLint = 5.6 μL/min/mg (Table 2). The S-naproxen acyl-glucuronide formation by wild-type mouse liver microsomes followed the Michaelis–Menten equation, yielding Km = 703 μmol/L, Vmax = 10.0 nmol/min/mg, and CLint = 14.2 μL/min/mg (Table 2). The kinetic parameters obtained in liver microsomes from hUGT1 mice were slightly closer to the parameters in human liver microsomes than to those in mouse liver microsomes.
Figure 2.
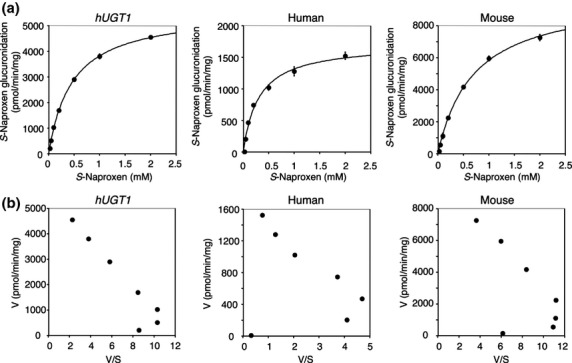
Kinetic analyses of S-naproxen acyl-glucuronide formation in liver microsomes. The substrate concentration-velocity curves (A) and Eadie–Hofstee plots (B) of the S-naproxen glucuronide formation are shown. Pooled liver microsomes of hUGT1 mice, humans, and regular mice were incubated with 25 μmol/L to 2 mmol/L S-naproxen and 5 mmol/L UDP-glucuronic acid at 37°C for 30 min. In the substrate concentration-velocity curves, data are the means ± SD of three independent determinations. In the Eadie–Hofstee plots, each data point represents the mean of three independent experiments.
Table 2.
Kinetic parameters of S-naproxen glucuronidation in liver microsomes
| Liver microsomes | Equation | Km (μmol/L) | Vmax (nmol/min/mg) | Clearance (CLint) (μL/min/mg) |
|---|---|---|---|---|
| Humanized UGT1 mice | Michaelis–Menten | 465 ± 14 | 5.60 ± 0.09 | 12.0 ± 0.2 |
| Human | Michaelis–Menten | 308 ± 30 | 1.72 ± 0.11 | 5.6 ± 0.2 |
| Regular mice | Michaelis–Menten | 703 ± 54 | 10.0 ± 0.4 | 14.2 ± 0.5 |
Inhibitory and heterotropic effects on furosemide glucuronidation in liver microsomes from hUGT1 mice, human, and mice
To investigate the species difference in inhibitory effects on furosemide glucuronidation, inhibitory effects of selective inhibitors, estradiol (UGT1A1), imipramine (UGT1A4), serotonin (UGT1A6), propofol (UGT1A9), and AZT (UGT2B7) were examined in liver microsomes from hUGT1 mice, humans, and wild-type mice. Among these inhibitors, estradiol exhibited the most potency inhibition toward furosemide glucuronidation, as the IC50 values were 32.5 μmol/L, 31.7 μmol/L, and 110.8 μmol/L in liver microsomes from hUGT1 mice, humans, and mice, respectively (Fig. 3A and Table 3). Propofol moderately inhibited furosemide glucuronidation with IC50 values of 186 μmol/L, 474 μmol/L, and 169 μmol/L in liver microsomes from hUGT1 mice, humans, and mice (Fig. 4B). The inhibitory effects of imipramine and serotonin toward furosemide glucuronidation was slight; their IC50 values were 0.25 mmol/L and 0.61 mmol/L in hUGT1 mice, 1.2 mmol/L and >5 mmol/L in humans, and 0.78 mmol/L and 0.45 mmol/L in regular mice, respectively (Figs. 3B and 4A). AZT did not inhibit furosemide glucuronidation in any species (Fig. 5). These data demonstrated that in most cases, inhibitory effects toward furosemide glucuronidation in hUGT1 mice were similar to those in humans. Especially, the IC50 values of estradiol were comparable between hUGT1 mice and humans, indicating that hUGT1 mice can be used to examine the inhibitory effects of compounds on the glucuronidation of drugs in humans.
Figure 3.
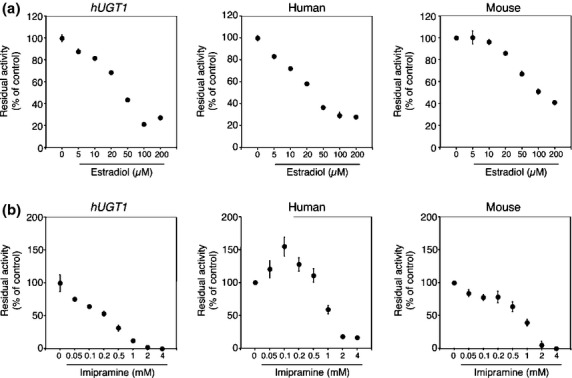
Inhibitory effects of estradiol (A) and imipramine (B) on furosemide acyl-glucuronide formation by liver microsomes of hUGT1 mice, humans, and regular mice. Residual activities were shown compared to the activity obtained in the absence of inhibitors. Data are the means ± SD of three independent determinations.
Table 3.
IC50 values for the inhibition of furosemide glucuronidation in liver microsomes
| Liver microsomes | Estradiol (μmol/L) | Imipramine (mmol/L) | Serotonin (mmol/L) | Propofol (μmol/L) | AZT (μmol/L) |
|---|---|---|---|---|---|
| Humanized UGT1 mice | 32.5 | 0.25 | 0.61 | 186 | >500 |
| Human | 31.7 | 1.2 | >5 | 474 | >500 |
| Regular mice | 110.8 | 0.78 | 0.45 | 169 | >500 |
Figure 4.
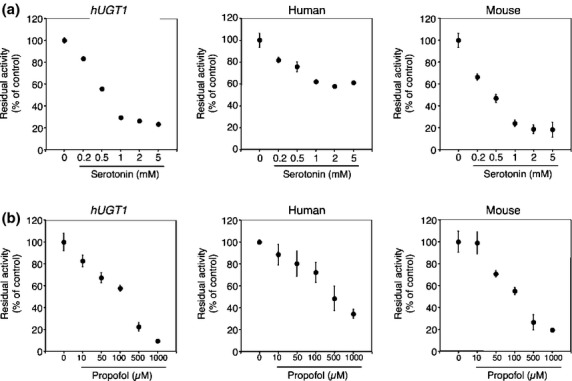
Inhibitory effects of serotonin (A) and propofol (B) on furosemide acyl-glucuronide formation by liver microsomes of hUGT1 mice, humans, and regular mice. Residual activities were shown compared to the activity obtained in the absence of inhibitors. Data are the means ± SD of three independent determinations.
Figure 5.
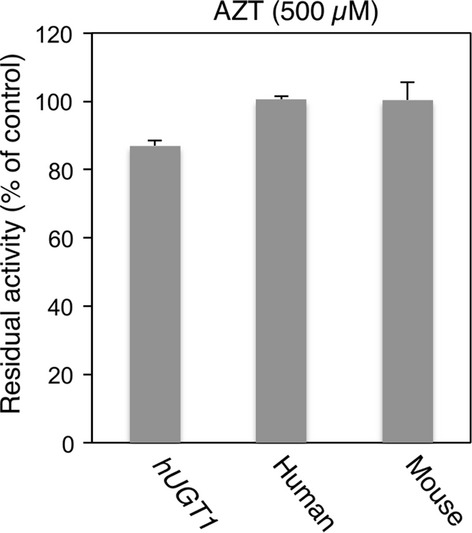
Inhibitory effects of AZT on furosemide acyl-glucuronide formation by liver microsomes of hUGT1 mice, humans, and regular mice. Residual activities were shown compared to the activity obtained in the absence of AZT. Data are the means ± SD of three independent determinations.
It should be noted that a lower concentration of imipramine (100 μmol/L) activated the furosemide glucuronidation in human liver microsomes. With 100 μmol/L imipramine, UGT activity was increased 1.5-fold compared to that in the absence of imipramine (Fig. 3B). In contrast, in the liver microsomes of hUGT1 mice and wild-type mice, such heterotropic activation of furosemide glucuronidation by imipramine was not observed.
Imipramine and trifluoperazine glucuronidation in liver microsomes from hUGT1 mice, human, and mice
While other UGT isoforms such as UGT1A3 can catalyze the N-glucuronidation of primary, secondary, and tertiary amine-containing compounds (Green et al. 1998), UGT1A4 has been known as the primary enzyme responsible for N-glucuronidation (Kaivosaari et al. 2011). Since rodents lack the human UGT1A4 homologue gene, regular experimental mice and rats exhibit less or no N-glucuronidation of activity (Al-Zoughool and Talaska 2005; Shiratani et al. 2008). To examine the potential usefulness of hUGT1 mice in predicting N-glucuronidation of drugs in humans, N-glucuronide formation of imipramine and that of trifluoperazine, which are substrates for human UGT1A4, were determined in liver microsomes from hUGT1 mice, humans, and wild-type mice. While imipramine and trifluoperazine N-glucuronide formations were observed in human liver microsomes, those metabolites were not detected in mouse liver microsomes (Fig. 6). In the liver microsomes from hUGT1 mice, however, comparable amounts of imipramine N-glucuronide formation and a lesser but detectable amount of trifluoperazine N-glucuronide formation were observed (Fig. 6). These data indicate that hUGT1 mice have the potential capacity to form N-glucuronides of drugs.
Figure 6.
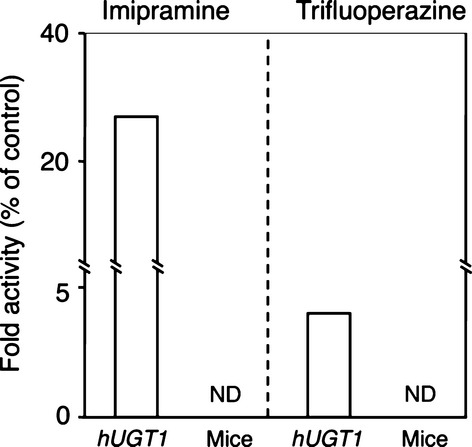
Imipramine and trifluoperazine N-glucuronidation in liver microsomes of hUGT1 mice, humans, and regular mice. Fold activities were shown compared to the activity obtained in human liver microsomes. Each column represents the mean of three independent determinations. ND: not detected.
Effects of BSA on furosemide glucuronidation in liver microsomes
It has been demonstrated that fatty acids included in liver microsomes inhibit glucuronidation reaction in vitro and that albumin can attenuate the inhibitory effects of fatty acids (Rowland et al. 2007). To investigate the species difference in the effects of albumin on the microsomal drug glucuronidation, 0–0.5% of BSA was included in the reaction mixtures and the enzyme activities were determined. As reported previously, BSA concentration-dependently activated the glucuronidation of drug in human liver microsomes (Fig. S2). Interestingly, such activation was similarly observed in liver microsomes from hUGT1 mice and control mice (Fig. S2). This indicates that there is no species difference in the effect of BSA on furosemide glucuronidation, and that BSA similarly activates microsomal glucuronidation in hUGT1 mice.
Discussion
Various efforts have been undertaken to predict human glucuronidation of drugs to optimize clinical dosages of drugs and also to avoid in vivo drug-drug interactions that can significantly increase or decrease the area under the plasma drug concentration-time curve (AUC). Among 19 functional human UGTs, the UGT1A family of proteins plays a key role in the metabolism of clinically used drugs (Williams et al. 2004). UGT1A enzymes expressed in tissue culture have been used to examine substrate specificity (Zhang et al. 2005); however, recent reports have demonstrated that clearance values calculated from in vitro data using UGT-expressing cells did not correlate well to those observed in vivo (Lin and Wong 2002), possibly due to the presence of protein–protein interactions between the UGT isoforms (Fujiwara et al. 2007a,b; Operaña and Tukey 2007). While primary cultured human hepatocytes can mimic in vivo drug glucuronidation (Miners et al. 2006), these hepatocytes are not only expensive and inconvenient to culture but also inconsistent, exhibiting different metabolic properties in each study, which can potentially be attributed to genetic polymorphisms or storage conditions. Animal scale-up is an alternative method for predicting in vivo human drug metabolism. A recent report by Deguchi et al. (2011) demonstrated that animal scale-up with monkeys, rather than with mice, could be a reliable method in predicting human pharmacokinetics of UGT substrates. However, due to their convenience, rodents are still the most extensively used animals in research.
The fundamental obstacle to utilizing rodents to predict human drug glucuronidation is that they lack a human UGT1A4 homologue gene, which encodes a primary UGT isoform responsible for N-glucuronidation. In addition, there are significant differences in substrate specificity attributed toward rodent and human homologs. Since hUGT1 mice carry the entire human UGT1 locus including UGT1A4, they can form N-glucuronides of imipramine and trifluoperazine in liver microsomes (Fig. 6), though N-glucuronidation activity is comparable or lower than that in human liver microsomes. The transgene introduced into hUGT1 mice contains promoter regions of each UGT1A isoform; therefore, treatment of hUGT1 mice with several UGT1A4 inducers would result in increased UGT1A4-catalyzed N-glucuronidations of drugs in the hUGT1 mice, as already demonstrated in human UGT1 transgenic mice (Chen et al. 2005). In addition to the N-glucuronidation of imipramine and trifluoperazine, the metabolic profile of the microsomal glucuronidation activity toward furosemide in hUGT1 mice was very similar to that in human liver microsomes, considering the identical clearance parameters and Eadie–Hofstee plots in hUGT1 mice and humans (Fig. 1 and Table 1). In contrast, similarity of S-naproxen glucuronidation between hUGT1 mice and humans was not significant, although the kinetic parameters of S-naproxen glucuronidation in hUGT1 mice were slightly closer to the parameters in humans than to those in mice (Table 2). This might be explained by the contribution of UGT2B family enzymes to S-naproxen glucuronidation. It has been shown that UGT1A and UGT2B proteins can glucuronidate S-naproxen (Bowalgaha et al. 2005). In humans, multiple UGT2B genes encode UGT2B4, UGT2B7, UGT2B10, UGT2B11, UGT2B15, UGT2B17, and UGT2B28 proteins. In mice, seven Ugt2b genes include Ugt2b1, 2b5, 2b34, 2b35, 2b36, 2b37, and 2b38. The species difference in the function of human UGT2B and mouse Ugt2b family enzymes has not been fully investigated. However, it has been reported that morphine 3-glucuronidation, which is specifically catalyzed by human UGT2B7 in human liver microsomes was significantly lower than the activity in mice, as the Vmax values in humans and mice were 2.7 and 19 nmol/min/mg, respectively (Court et al. 2003; Shiratani et al. 2008). Therefore, humanized UGT mice, in which not only Ugt1 but also Ugt2 genes can be replaced with human UGT1A and UGT2B genes, will become valuable animal models for predicting human glucuronidation of drugs.
While the kinetics of furosemide was similar between hUGT1 mice and humans, it should be noted that the hetero-activation of UGT1A-catalyzed furosemide glucuronidation by a lower concentration of imipramine was not observed in hUGT1 mice, which is in contradiction to the heterotropic activation observed in human liver microsomes (Fig. 3). Various compounds, including anthraflavic acid, 17 alpha-ethynylestradiol, 2-amino-1-methyl-6-phenylimidazo(4,5-b)pyridine, androstanediol, propofol, daidzein, 4-methylumbelliferone, and estradiol, have been reported as heterotropic activators of human UGT-catalyzed glucuronidation (Pfeiffer et al. 2006; Mano et al. 2004: Yamanaka et al. 2005; Williams et al. 2002). Interestingly, those heterotropic activations were reported in human liver microsomes and human UGT expressing cells, but not in other species such as mouse liver microsomes. Our data revealed that even though human UGT1A proteins were expressed in the mouse liver, such activation did not occur, indicating that differences in amino acid sequence, as well as factors such as membrane topology and latency of UGTs might be associated with the species different appearance of heterotropic activation. Indeed, latency of UGT activity has been reported to be different in humans and mice, as detergents, Brij 58 and CHAPS, only increased UGT activities by 9–66% in human liver microsomes, whereas activity increased by 439–563% in mouse liver microsomes (Court and Greenblatt 1997).
Human liver microsomes are commercially available and are a convenient tool to study human glucuronidation in in vitro research. However, predicted clearance values of glucuronidation from in vitro data utilizing human liver microsomes do not correlate well to observed in vivo clearances of drugs. While animal scale-up is an alternative method for predicting human drug glucuronidation, species difference in UGT activities can be a barrier for accurate prediction of in vivo glucuronidation of drugs in humans. In this study, we demonstrated that drug glucuronidation in hUGT1 mice was similar to that in humans. Furthermore, inhibitory effects of estradiol on UGT activities in hUGT1 mice were comparable to those in humans. This indicates that in vivo and in vitro studies utilizing hUGT1 mice are promising for predicting not only in vivo human drug glucuronidations but also potential drug–drug interactions.
Glossary
- UGT
UDP-glucuronosyltransferase
- HPLC
high performance liquid chromatography
- hUGT1
humanized UGT1
- AZT
3′-azido-3′-deoxythymidine
- AUC
area under the plasma drug concentration-time curve
- BSA
bovine serum albumin
Disclosures
None declared.
Supporting Information
Additional Supporting Information may be found in the online version of this article:
Figure S1. Incubation of furosemide glucuronide with microsomes did not decrease the amount of the acyl-glucuronide.
Figure S2. Effects of BSA on furosemide glucuronidation in liver microsomes.
References
- Al-Zoughool M, Talaska G. High-performance liquid chromatography method for determination of N-glucuronidation of 4-aminobiphenyl by mouse, rat, and human liver microsomes. Anal Biochem. 2005;340:352–358. doi: 10.1016/j.ab.2005.01.048. [DOI] [PubMed] [Google Scholar]
- Bowalgaha K, Elliot DJ, Mackenzie PI, Knights KM, Swedmark S, Miners JO. S-Naproxen and desmethylnaproxen glucuronidation by human liver microsomes and recombinant human UDP-glucuronosyltransferases (UGT): role of UGT2B7 in the elimination of naproxen. Br J Clin Pharmacol. 2005;60:423–433. doi: 10.1111/j.1365-2125.2005.02446.x. [DOI] [PMC free article] [PubMed] [Google Scholar]
- Bradford MM. A rapid and sensitive method for the quantitation of microgram quantities of protein utilizing the principle of protein-dye binding. Anal Biochem. 1976;72:248–254. doi: 10.1016/0003-2697(76)90527-3. [DOI] [PubMed] [Google Scholar]
- Cai H, Nguyen N, Peterkin V, Yang YS, Hotz K, La Placa DB, et al. A humanized UGT1 mouse model expressing the UGT1A1*28 allele for assessing drug clearance by UGT1A1-dependent glucuronidation. Drug Metab Dispos. 2010;38:879–886. doi: 10.1124/dmd.109.030130. [DOI] [PMC free article] [PubMed] [Google Scholar]
- Chen S, Beaton D, Nguyen N, Senekeo-Effenberger K, Brace-Sinnokrak E, Argikar U, et al. Tissue-specific, inducible, and hormonal control of the human UDP-glucuronosyltransferase-1 (UGT1) locus. J Biol Chem. 2005;280:37547–37557. doi: 10.1074/jbc.M506683200. [DOI] [PubMed] [Google Scholar]
- Court MH, Greenblatt DJ. Biochemical basis for deficient paracetamol glucuronidation in cats: an interspecies comparison of enzyme constraint in liver microsomes. J Pharm Pharmacol. 1997;49:446–449. doi: 10.1111/j.2042-7158.1997.tb06822.x. [DOI] [PubMed] [Google Scholar]
- Court MH, Krishnaswamy S, Hao Q, Duan SX, Patten CJ, Von Moltke LL, et al. Evaluation of 3′-azido-3′-deoxythymidine, morphine, and codeine as probe substrates for UDP-glucuronosyltransferase 2B7 (UGT2B7) in human liver microsomes: specificity and influence of the UGT2B7*2 polymorphism. Drug Metab Dispos. 2003;31:1125–1133. doi: 10.1124/dmd.31.9.1125. [DOI] [PubMed] [Google Scholar]
- Deguchi T, Watanabe N, Kurihara A, Igeta K, Ikenaga H, Fusegawa K, et al. Human pharmacokinetic prediction of UDP-glucuronosyltransferase substrates with an animal scale-up approach. Drug Metab Dispos. 2011;39:820–829. doi: 10.1124/dmd.110.037457. [DOI] [PubMed] [Google Scholar]
- Dutton GJ. Acceptor substrates of UDP glucuronosyltransferase and their assay. In: Dutton GJ, editor. Glucuronidation of Drugs and Other Compounds. Boca Raton, FL: CRC Press; 1980. pp. 69–78. [Google Scholar]
- Fujiwara R, Nakajima M, Yamanaka H, Katoh M, Yokoi T. Interactions between human UGT1A1, UGT1A4, and UGT1A6 affect their enzymatic activities. Drug Metab Dispos. 2007a;35:1781–1787. doi: 10.1124/dmd.107.016402. [DOI] [PubMed] [Google Scholar]
- Fujiwara R, Nakajima M, Yamanaka H, Nakamura A, Katoh M, Ikushiro S, et al. Effects of coexpression of UGT1A9 on enzymatic activities of human UGT1A isoforms. Drug Metab Dispos. 2007b;35:747–757. doi: 10.1124/dmd.106.014191. [DOI] [PubMed] [Google Scholar]
- Fujiwara R, Nguyen N, Chen S, Tukey RH. Developmental hyperbilirubinemia and CNS toxicity in mice humanized with the UDP glucuronosyltransferase 1 (UGT1) locus. Proc Natl Acad Sci USA. 2010;107:5024–5029. doi: 10.1073/pnas.0913290107. [DOI] [PMC free article] [PubMed] [Google Scholar]
- Fujiwara R, Chen S, Karin M, Tukey RH. Reduced expression of UGT1A1 in intestines of humanized UGT1 mice via inactivation of NF-κB leads to hyperbilirubinemia. Gastroenterology. 2012;142:109–118. doi: 10.1053/j.gastro.2011.09.045. [DOI] [PMC free article] [PubMed] [Google Scholar]
- Green MD, King CD, Mojarrabi B, Mackenzie PI, Tephly TR. Glucuronidation of amines and other xenobiotics catalyzed by expressed human UDP-glucuronosyltransferase 1A3. Drug Metab Dispos. 1998;26:507–512. [PubMed] [Google Scholar]
- Houston JB, Kenworthy KE. In vitro-in vivo scaling of CYP kinetic data not consistent with the classical Michaelis–Menten model. Drug Metab Dispos. 2000;28:246–254. [PubMed] [Google Scholar]
- Kaivosaari S, Finel M, Koskinen M. N-glucuronidation of drugs and other xenobiotics by human and animal UDP-glucuronosyltransferases. Xenobiotica. 2011;41:652–669. doi: 10.3109/00498254.2011.563327. [DOI] [PubMed] [Google Scholar]
- Katoh M, Matsui T, Yokoi T. Glucuronidation of antiallergic drug, Tranilast: identification of human UDP-glucuronosyltransferase isoforms and effect of its phase I metabolite. Drug Metab Dispos. 2007;35:583–589. doi: 10.1124/dmd.106.013706. [DOI] [PubMed] [Google Scholar]
- Katoh M, Tateno C, Yoshizato K, Yokoi T. Chimeric mice with humanized liver. Toxicology. 2008;246:9–17. doi: 10.1016/j.tox.2007.11.012. [DOI] [PubMed] [Google Scholar]
- Kerdpin O, Knights KM, Elliot DJ, Miners JO. In vitro characterisation of human renal and hepatic frusemide glucuronidation and identification of the UDP-glucuronosyltransferase enzymes involved in this pathway. Biochem Pharmacol. 2008;276:249–257. doi: 10.1016/j.bcp.2008.04.014. [DOI] [PubMed] [Google Scholar]
- Koga T, Fujiwara R, Nakajima M, Yokoi T. Toxicological evaluation of acyl glucuronides of nonsteroidal anti-inflammatory drugs using human embryonic kidney 293 cells stably expressing human UDP-glucuronosyltransferase and human hepatocytes. Drug Metab Dispos. 2011;39:54–60. doi: 10.1124/dmd.110.035600. [DOI] [PubMed] [Google Scholar]
- Lin JH, Wong BK. Complexities of Glucuronidation Affecting In Vitro-In Vivo Extrapolation. Curr Drug Metab. 2002;3:623–646. doi: 10.2174/1389200023336992. [DOI] [PubMed] [Google Scholar]
- Mackenzie PI, Bock KW, Burchell B, Guillemette C, Ikushiro S, Iyanagi T, et al. Nomenclature update for the mammalian UDP glycosyltransferase (UGT) gene superfamily. Pharmacogenet Genomics. 2005;15:677–685. doi: 10.1097/01.fpc.0000173483.13689.56. [DOI] [PubMed] [Google Scholar]
- Mano Y, Usui T, Kamimura H. Effects of beta-estradiol and propofol on the 4-methylumbelliferone glucuronidation in recombinant human UGT isozymes 1A1, 1A8 and 1A9. Biopharm Drug Dispos. 2004;25:339–344. doi: 10.1002/bdd.418. [DOI] [PubMed] [Google Scholar]
- Miners JO, Knights KM, Houston JB, Mackenzie PI. In vitro-in vivo correlation for drugs and other compounds eliminated by glucuronidation in humans: pitfalls and promises. Biochem Pharmacol. 2006;71:1531–1539. doi: 10.1016/j.bcp.2005.12.019. [DOI] [PubMed] [Google Scholar]
- Mizuma T. Intestinal glucuronidation metabolism may have a greater impact on oral bioavailability than hepatic glucuronidation metabolism in humans: a study with raloxifene, substrate for UGT1A1, 1A8, 1A9, and 1A10. Int J Pharm. 2009;378:140–141. doi: 10.1016/j.ijpharm.2009.05.044. [DOI] [PubMed] [Google Scholar]
- el Mouelhi M, Beck S, Bock KW. Stereoselective glucuronidation of (R)- and (S)-naproxen by recombinant rat phenol UDP-glucuronosyltransferase (UGT1A1) and its human orthologue. Biochem Pharmacol. 1993;46:1298–1300. doi: 10.1016/0006-2952(93)90480-k. [DOI] [PubMed] [Google Scholar]
- Nakajima M, Tanaka E, Kobayashi T, Ohashi N, Kume T, Yokoi T. Imipramine N-glucuronidation in human liver microsomes: biphasic kinetics and characterization of UDP-glucuronosyltransferase isoforms. Drug Metab Dispos. 2002;30:636–642. doi: 10.1124/dmd.30.6.636. [DOI] [PubMed] [Google Scholar]
- Operaña TN, Tukey RH. Oligomerization of the UDP-glucuronosyltransferase 1A proteins: homo- and heterodimerization analysis by fluorescence resonance energy transfer and co-immunoprecipitation. J Biol Chem. 2007;282:4821–4829. doi: 10.1074/jbc.M609417200. [DOI] [PubMed] [Google Scholar]
- Pfeiffer E, Graf E, Gerstner S, Metzler M. Stimulation of estradiol glucuronidation: a protective mechanism against estradiol-mediated carcinogenesis? Mol Nutr Food Res. 2006;50:385–389. doi: 10.1002/mnfr.200500198. [DOI] [PubMed] [Google Scholar]
- Rachmel A, Hazelton GA. The inducibility and ontogeny of rat liver UDP-glucuronyltransferase toward furosemide. Biochem Pharmacol. 1986;35:3777–3782. doi: 10.1016/0006-2952(86)90664-7. [DOI] [PubMed] [Google Scholar]
- Ritter JK, Chen F, Sheen YY, Tran HM, Kimura S, Yeatman MT, et al. A novel complex locus UGT1 encodes human bilirubin, phenol, and other UDP-glucuronosyltransferase isozymes with identical carboxyl termini. J Biol Chem. 1992;267:3257–3261. [PubMed] [Google Scholar]
- Rowland A, Gaganis P, Elliot DJ, Mackenzie PI, Knights KM, Miners JO. Binding of inhibitory fatty acids is responsible for the enhancement of UDP-glucuronosyltransferase 2B7 activity by albumin: implications for in vitro-in vivo extrapolation. J Pharmacol Exp Ther. 2007;321:137–147. doi: 10.1124/jpet.106.118216. [DOI] [PubMed] [Google Scholar]
- Shiratani H, Katoh M, Nakajima M, Yokoi T. Species differences in UDP-glucuronosyltransferase activities in mice and rats. Drug Metab Dispos. 2008;36:1745–1752. doi: 10.1124/dmd.108.021469. [DOI] [PubMed] [Google Scholar]
- Tukey RH, Strassburg CP. Human UDP-glucuronosyltransferases: metabolism, expression and disease. Annu Rev Pharmacol Toxicol. 2000;40:581–616. doi: 10.1146/annurev.pharmtox.40.1.581. [DOI] [PubMed] [Google Scholar]
- Uchaipichat V, Mackenzie PI, Elliot DJ, Miners JO. Selectivity of substrate (trifluoperazine) and inhibitor (amitriptyline, androsterone, canrenoic acid, hecogenin, phenylbutazone, quinidine, quinine, and sulfinpyrazone) “probes” for human udp-glucuronosyltransferases. Drug Metab Dispos. 2006;34:449–456. doi: 10.1124/dmd.105.007369. [DOI] [PubMed] [Google Scholar]
- Williams JA, Ring BJ, Cantrell VE, Campanale K, Jones DR, Hall SD, et al. Differential modulation of UDP-glucuronosyltransferase 1A1 (UGT1A1)-catalyzed estradiol-3-glucuronidation by the addition of UGT1A1 substrates and other compounds to human liver microsomes. Drug Metab Dispos. 2002;30:1266–1273. doi: 10.1124/dmd.30.11.1266. [DOI] [PubMed] [Google Scholar]
- Williams JA, Hyland R, Jones BC, Smith DA, Hurst S, Goosen TC, et al. Drug-drug interactions for UDP-glucuronosyltransferase substrates: a pharmacokinetic explanation for typically observed low exposure (AUCi/AUC) ratios. Drug Metab Dispos. 2004;32:1201–1208. doi: 10.1124/dmd.104.000794. [DOI] [PubMed] [Google Scholar]
- Yamanaka H, Nakajima M, Katoh M, Kanoh A, Tamura O, Ishibashi H, et al. Trans-3′-hydroxycotinine O- and N-glucuronidations in human liver microsomes. Drug Metab Dispos. 2005;33:23–30. doi: 10.1124/dmd.104.001701. [DOI] [PubMed] [Google Scholar]
- Zhang D, Chando TJ, Everett DW, Patten CJ, Dehal SS, Humphreys WG. In vitro inhibition of UDP glucuronosyltransferases by atazanavir and other HIV protease inhibitors and the relationship of this property to in vivo bilirubin glucuronidation. Drug Metab Dispos. 2005;33:1729–1739. doi: 10.1124/dmd.105.005447. [DOI] [PubMed] [Google Scholar]
Associated Data
This section collects any data citations, data availability statements, or supplementary materials included in this article.
Supplementary Materials
Figure S1. Incubation of furosemide glucuronide with microsomes did not decrease the amount of the acyl-glucuronide.
Figure S2. Effects of BSA on furosemide glucuronidation in liver microsomes.


