

Abstract
Objective
Laquinimod is an emerging oral medication for multiple sclerosis (MS) that reduces brain atrophy and progression of disability in two Phase III clinical trials. The mechanism of these effects is unclear. Persistent activation of microglia occurs in MS and contributes to injury. Thus, we investigated whether laquinimod alters properties of microglia in culture and in experimental autoimmune encephalomyelitis (EAE), and whether this reduces neurodegeneration.
Methods
Microglia were cultured from human brains. EAE was induced in mice.
Results
The activation of human microglia increased levels of several pro- and anti-inflammatory cytokines and these elevations were attenuated by pretreatment with laquinimod. Laquinimod prevented the decline in activated microglia of miR124a, a microRNA implicated in maintaining microglia quiescence, and reduced the activity of several signaling pathways (Jun-N-terminal kinase, ribosomal S6 kinase, and AKT/protein kinase B) in activated microglia. In EAE, axonal injury correlated with accumulation of microglia/macrophages in the spinal cord. EAE mice treated with laquinimod before onset of clinical signs subsequently had reduced microglia/macrophage density and axonal injury. Remarkably, when laquinimod treatment was initiated well into the disease course, the progressive demyelination, and axonal loss was halted. Besides inflammatory molecules associated with microglia, the level of inducible nitric oxide (NO) synthase capable of producing free radical toxicity was attenuated by laquinimod in EAE mice. Finally, in coculture where microglia activation caused neuronal death, laquinimod decreased NO levels, and neurotoxicity.
Interpretation
Laquinimod is a novel inhibitor of microglial activation that lowers microglia-induced neuronal death in culture and axonal injury/loss in EAE.
Introduction
The accumulation of activated microglia and blood-derived macrophages in the central nervous system (CNS) is an early and persistent feature of multiple sclerosis (MS).1–3 It is difficult to differentiate microglia from macrophages in tissue sections and they are thus collectively referred to as microglia/macrophages. In MS lesions, microglia/macrophages outnumber lymphocytes by approximately 10-fold.4 In experimental autoimmune encephalomyelitis (EAE), an animal model of MS, T lymphocyte counts eventually subside in the CNS, but the elevated density of microglia/macrophage persists and correlates with neuronal dysfunction.5
While microglia have useful roles in surveillance of the CNS,6,7 excessively activated microglia are toxic to neurons and axons through the upregulation of inflammatory cytokines, proteases, glutamate, and free radicals including nitric oxide (NO).8–10 In a recent study of cortical lesions in MS, patients with rims of activated microglia had a less favorable disease course than those that did not.11 Despite the potential detriments of activated microglia and their prominence and persistence in MS, medications in MS have not yet targeted these cells directly.
Laquinimod is an emerging oral medication that reduces relapse rate in relapsing-remitting MS.12,13 Its mechanisms of action include the generation of CD4+ T helper (Th) 2 cells,14 and it also produces Type 2 monocytes or dendritic cells that are regulatory in nature.15–17 Laquinimod also reduces the activity of B cells,18 and it decreases the accumulation of proinflammatory monocytes in the CNS.19
Laquinimod enters the CNS17 of normal or EAE-afflicted mice. Thus, it may have effects within the CNS that may be more important than its immunomodulatory activity in the periphery. In support, while the reduction in mean annualized relapse rate by laquinimod in the two Phase III trials was on the order of ∼20% compared to placebo, its reduction in the progression of disability or brain atrophy over 2 years ranged between 25% and 35%.12,13,20 In further analyses of MR images collected from the first Phase III trial, laquinimod was found to reduce atrophy of the gray and white matter.21 In animal models, laquinimod reduced astrocyte activation, prevented synaptic alterations caused by inflammation, mitigated demyelination produced by cuprizone, and promoted remyelination in EAE.22–24 While decreased microglia/macrophage density is an outcome in EAE mice treated with laquinimod before or at symptom onset,25 it is not known whether this is an indirect consequence or whether microglia are directly altered by laquinimod. Here, we have evaluated whether laquinimod affects microglia directly, and whether this impacts neuronal/axonal injury that is a feature of MS and the major pathological correlate of disability in MS patients.
Methods
Cell culture
Adult human microglia of over 95% purity were isolated from resected surgical brain specimens as previously described.26 Human neurons were from brains of fetuses of 15–20 weeks gestation.27 The use of all human specimens was approved by local institutional ethics committees. Primary neuronal cultures were also prepared from 15 to 16 days embryos of CD-1 mice.28
For mouse microglia, brains from neonatal pups were minced and vortexed vigorously for 1 min to kill neurons. Suspensions were sieved through 80 and 11 μm pore size meshes. Cells were seeded at a density of one pup per coated T-75 flask in medium containing 10% serum. When cells were confluent, the flasks were shaken at 250 rpm for 20 min to detach the loosely adherent microglia. The purity of the microglia was in excess of 95%.
Evaluation of the impact of laquinimod on microglia activation in culture
Microglia were reseeded in serum-containing medium into uncoated wells of 96-well plates at a seeding density of 104 cells/well/100 μL medium. When adhered, cells were switched to AIM-V serum free medium for experiments. Laquinimod was added to microglia cultures 24 h before the activator lipopolysaccharide (LPS, 100 ng/mL). Initial experiments used LPS to activate microglia while subsequent experiments used 100 U/mL IFN-γ and 100 ng/mL LPS (iLPS) as both were comparable in stimulating TNF-α production. A day after, cell conditioned medium was removed for TNF-α or matrix metalloproteinase (MMP)-9 ELISA, or for 42-plex (Eve Technologies, Calgary, AL, Canada) multi-factor analyses. The latter analytes are interferon (IFN)-α2, IFN-γ, interleukin (IL)-1α, IL-1β, IL-2 to IL-11, IL-12 (p40), IL-12 (p70), IL-13, IL-15, IL-17, IL-1 receptor antagonist (IL-1ra), chemokines (growth inducible oncogene [gro-α], IFN-γ inducible protein [IP]-10, macrophage chemoattractant protein [MCP]-1, MCP-3, macrophage-derived chemokine [MDC], macrophage inflammatory protein [MIP]-1α, MIP-1β, eotaxin, fractalkine and RANTES), growth factors (epidermal growth factor [EGF], fibroblast growth factor [FGF]-2, Flt-3 ligand, vascular endothelial cell growth factor [VEGF], granulocyte colony-stimulating factor [G-CSF], granulocyte-macrophage colony-stimulating factor [GM-CSF], plaltelet-derived growth factor [PDGF]-AA, and PDGF-AB/BB), transforming growth factor-α, TNF-α, TNF-β, and sCD40L.
Microglia size was evaluated using ImageXpressMicro instrumentation (Molecular Devices, Sunnyvale, CA), a high-throughput cellular imaging system.28,29 Cell viability was assessed by an ATP assay kit (Cell Titer-GloR; Promega) while nitrite levels (as an NO indicator) were determined by the Griess kit (Promega, Madison, WI).
Western blot analyses
Half a million microglia were treated with laquinimod or vehicle (saline) for 24 h followed by activation with iLPS. Ten or 30 min after, cells were lysed in protease inhibitor-containing radioimmunoprecipitation assay (RIPA) buffer. Ten μg of each sample was electrophoresed, transferred onto a polyvinylidene fluoride membrane, and the latter was incubated overnight at 4°C with a cocktail that contains antibodies for phosphorylated forms of extracellular regulated kinase (ERK1/2), ribosomal S6 kinases (90RSK), AKT (protein kinase B), and phsopho-S6 ribosomal protein; Rab11 served as an internal loading control. Primary antibodies against phospho-p38 MAPK, phospho-Jun-N-terminal kinase (JNK), and JNK were also used.
EAE and histological or RNA analyses
EAE was induced in female C57BL/6 mice with MOG35–55 as previously described.19 Laquinimod (25 mg/kg body weight) was given every day by oral gavage in 100 μL of saline. Treatment was either initiated at day 5 post myelin oligodendrocyte glycoprotein (MOG) immunization before clinical signs had appeared (preventative treatment paradigm), or at day 17 or 30 (therapeutic treatment paradigm) when mice were significantly impaired with disabilities. Animals were assessed daily using a 15-point clinical scale previously described (in Calgary),30 or by a five-point scale (in Göttingen).25
For histology, spinal cords were removed from mice, fixed in 4% buffered formalin and paraffin-embedded. For each mouse, ten series of longitudinal 10 μm thick sections across the entire thoracic spinal cord were sequentially cut and mounted on glass slides. Thus, for each series, adjacent sections on a glass slide were 100 μm apart, and each series covered the entire dorsal–ventral axis of the thoracic cord. The first series of spinal cord sections from each mouse was stained for hematoxylin/eosin and luxol fast blue (H&E/LFB).31 All H&E/LFB stained sections were scored, so that the average histological score for each mouse was obtained. Other series of sections were subjected to Bielschowsky's silver stain for axonal integrity,30 and to rabbit anti-Iba-1 for microglia/macrophages, and to inducible nitric oxide synthase (iNOS) (1:100; BD Bioscience, San Jose, CA) antibodies. Sections immediately adjacent to the one that best represents the average histological score for that mouse were photographed and used for quantitation of Iba1 or silver stains.
For rank order analysis, a blinded examiner ranked the images where each image was compared to another image, with a “winner” and “loser” decided for each pairing. Thus, for an experiment involving 20 specimens, a total of 20 × 19 scores were obtained. The total number of “wins” (i.e., greatest amount of Iba1 staining or most evidence of axonal pathology) was tallied for each animal, and the highest number of “wins” was scored the highest rank, and so on. A second level of assessment employed digitalized images and quantitation of Iba1-positive pixels32 using Matlab software (MathWorks, Natick, MA) to obtain an index of the extent of microglia/macrophages activation. For silver stained slides, a representative cross-section of the lateral column was selected across thresholded data, and the number of crossing points along a perpendicular selection line was processed by Matlab to obtain the objective automated axonal counts. All histological analyses were performed blinded.
For quantitative real-time PCR (qPCR), the lumbar/sacral spinal cord of mice was analyzed as previously described.31 For miRNA expression, real-time RT-PCR analyses were carried out using TaqMan miRNA assays (Applied Biosystems, Grand Island, NY) and relative expression was normalized to the housekeeping RNU6B miRNA.
Microglia-mediated neuronal death
Mouse cortical neurons were plated in 96-well plates at a density of 5.0 × 10⁴ cells/well and left to grow for 48 h in B27 supplemented neurobasal media. The medium was then changed to neurobasal medium but without B27 supplement, and mouse microglia (with or without 24 h prior exposure to laquinimod) were overlaid for 24 h. Laquinimod was readded during this period. Cells were then exposed to iLPS for 24 h. The conditioned medium was collected for nitrite measurement and the cells were fixed with 4% paraformaldehyde. Cells were stained for microtubule associated protein-2 (MAP-2), a neuronal marker, and the number of neurons remaining on each well was then enumerated using ImageXpressMicro.28 In the case of human cocultures, neurons and microglia from autologous fetal human specimens were used.
Statistical analysis
Results were reported as mean ± SEM, and statistical analyses were conducted with Student's t-test for two groups, or one-way ANOVA with Tukey post hoc test for multiple groups. Statistical differences in nonparametric histological or clinical disability scores were evaluated using the Mann–Whitney U test. Correlations were performed with nonparametric Spearman ranking.
Results
Microglia activation in culture is reduced by laquinimod
The size of human microglia increases with activation. Treatment with LPS resulted in noticeably larger microglia (Fig. 1A) which was ameliorated by pretreatment of microglia for 24 h with laquinimod (Fig. 1B). Similarly, LPS activation of human or murine microglia resulted in significant elevation of TNF-α which was reduced by pretreatment with laquinimod (Fig. 1C and D).
Figure 1.

Microglia activation is reduced by laquinimod in the absence of cytotoxicity. Human microglia were pretreated with different concentrations (0.1–20 μmol/L) of laquinimod (LQ) for 24 h following which LPS was used to activate the cells for 24 h. The size of CD14 stained microglia (A) was increased with activation and this was reduced by laquinimod (B). TNF-α measured from the conditioned media of cells shows that human (C) or mouse (D) microglia elevated this cytokine upon LPS activation and this was attenuated by laquinimod. *P < 0.05, **P < 0.01, and ***P < 0.001 compared to LPS-activated microglia (one-way ANOVA with Tukey's post hoc comparisons). Laquinimod was not toxic to microglia as indicated by an ATP assay (E) and morphology (F). Each histogram represents quadruplicate cultures, and the results were reproduced in at least one other experiment.
We noted that a pretreatment period of microglia with laquinimod for at least 6 h was necessary to reduce the subsequent activation by iLPS. A pretreatment period of 24 h was used in the majority of our experiments, and longer periods resulted in an even greater decrease in activation of microglia as monitored by TNF-α levels. The pretreatment period likely alters regulatory molecules/cascades within microglia since when laquinimod was removed from cells by washing following 24 h of exposure, the subsequent LPS- or iLPS-induced increase in TNF-α or MMP-9 was equally attenuated with or without the laquinimod washout (data not shown). The impact of laquinimod was not due to nonspecific cytotoxicity as ATP luminescence or morphology was not altered (Fig. 1E and F).
We found that a variety of proinflammatory and anti-inflammatory molecules were upregulated from basal condition by LPS, and that these were uniformly decreased by laquinimod (Fig. 2). Strikingly, the growth factors gro-α (CXCL1), G-CSF, and EGF that were elevated in activated microglia were not decreased by laquinimod.
Figure 2.

Laquinimod reduces the production of pro- and anti-inflammatory cytokines and MMP-9 from activated microglia. Multiplex luminex analyses show that human microglia increase their content of a variety of cytokines upon activation with LPS, and these elevations of pro- (A) and anti-inflammatory (B) molecules were reduced by laquinimod (LQ, 5 μmol/L). The rise of MMP-9 in activated microglia was diminished by laquinimod (C). In contrast, the elevation of gro-α, G-CSF, and EGF upon LPS treatment was not reduced by laquinimod. *P < 0.05, **P < 0.01, ***P < 0.001 compared to LPS (one-way ANOVA with Tukey's post hoc comparisons). Each histogram represents quadruplicate cultures, and the results were reproduced in a separate experiment.
Laquinimod influences activation of microglia by TLR2 and TLR4, but not TLR3
Microglia are activated through stimulation of toll-like receptors (TLRs), so we determined if signaling through commonly studied TLRs were reduced by laquinimod. We employed the TLR2 agonist, PAM (palmitoyl-3-cysteine-serine-lysine-4); TLR3 agonist, poly IC (poly(inosinic acid):poly(cystidylic acid); and the TLR4 agonist, LPS. We found that laquinimod reduced TNF-α elevation caused by stimulation of TLR2 and TLR4, but not TLR3 (Fig. 3A), and this was not through any obvious alteration of TLR2 and TLR4 cell surface receptor expression (Fig. 3B).
Figure 3.
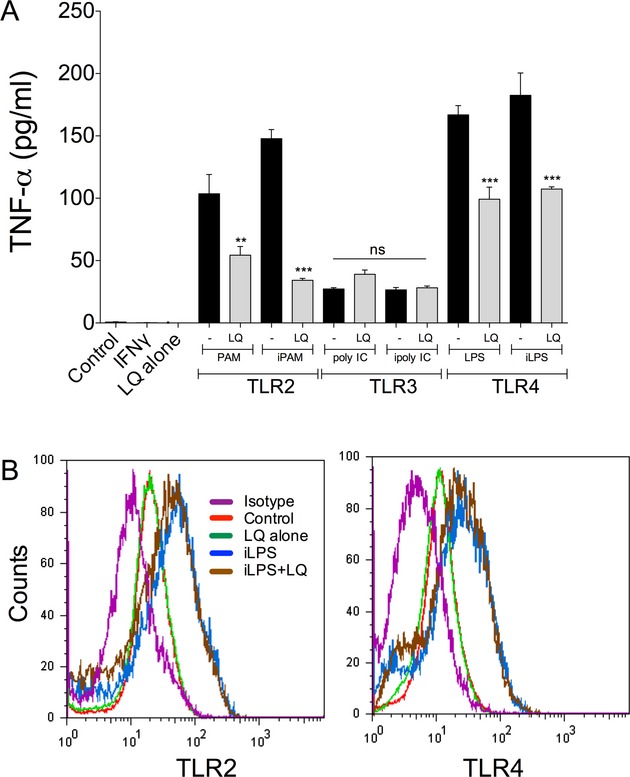
Laquinimod influences activation of microglia by TLR2 and TLR4, but not TLR3. Human microglia were activated through TLR2, 3 and 4 receptors using PAM, poly IC and LPS, respectively, with or without IFN-γ (i) priming. Laquinimod (5 μmol/L) reduced the TNF-α increase elicited through TLR2 and 4 stimulation but did not alter that of TLR3 stimulation (A). **P < 0.01, ***P < 0.001 compared to the respective cultures without laquinimod. ns = not significant. (B) Levels of TLR2 or TLR4 on human microglia were elevated when cells were treated with iLPS and this was not altered by laquinimod (5 μmol/L). Similarly, the basal expression of TLR2 and 4 in control nonactivated microglia did not change in response to laquinimod. The isotype plot refers to cells stained with the isotype antibody control.
Laquinimod reduces the phosphorylation state of specific signaling enzymes in activated microglia
We treated human microglia in culture with laquinimod for 24 h followed by activation with iLPS. Western blot analyses demonstrate a significant inhibition by laquinimod of the LPS-elevated phosphorylated JNK, AKT, and 90RSK, but not of ERK1/2 and p38MAPK (Fig. 4A and B). Thus, the reduction in cellular signaling may help account for the effects of laquinimod on activated microglia.
Figure 4.

Signaling cascades and miR124a are altered by laquinimod. Human microglia were pretreated for 24 h with laquinimod and iLPS was then applied. Cultures were harvested 10 and 30 min after iLPS as phosphorylation events occur rapidly in cells. There was robust activation of several signaling proteins as determined by increase in their phosphorylated forms, and the presence of laquinimod (1 μmol/L) reduced the activation of JNK, AKT, and 90RSK (A and B); duplicate experiments are presented in (A). For miRNA124a, levels declined in three different human microglia preparations (1–3) 24 h after iLPS, and this was negated by the pretreatment with laquinimod (C).
Increase in miR124a in human microglia by laquinimod
MicroRNAs (miR) are noncoding single stranded small RNAs that function in regulation of gene expression. Ponomarev et al.33 reported that miR124a maintains microglia quiescence and that its loss in microglia and in EAE results in microglia activation. In microglia prepared from three human subjects, miR124a level was downregulated upon iLPS activation but the 24 h pretreatment with laquinimod normalized or increased its content (Fig. 4C). Thus, the elevation of miR124a and reduction in signaling activity appear to be mechanisms that contribute to the reduction in microglia activation by laquinimod.
Preventative treatment with laquinimod reduces the density of microglia/macrophages in EAE correspondent with amelioration of axonal injury
We tested the hypothesis that laquinimod reduces microglial activation in EAE. Laquinimod administered by oral gavage from day 5 after MOG immunization delayed mice from succumbing to EAE (Fig. 5A). In corroboration, histological analyses at day 18 showed that laquinimod reduced the significant representation of activated microglia/macrophages in the spinal cord of EAE mice (Fig. 5B and C).
Figure 5.

Laquinimod reduces manifestations of activated microglia/macrophages in EAE. While vehicle-treated MOG-immunized mice developed clinical signs of EAE, this was ameliorated in mice administrated daily oral laquinimod doses from 5 days postimmunization (A); mean ± SEM (n of 10). In mice sacrificed at day 18, Iba1 staining for microglia/macrophages and iNOS immunoreactivity in longitudinal sections of the spinal cord show intense staining in EAE + vehicle group, and reduced signals with laquinimod treatment (B); this was verified by blinded rank order analyses (C) where the scores of individual mice are displayed (the higher the rank order, the greater the Iba1 immunoreactivity). Statistical analyses of the Iba1 rank order using a nonparametric one-way ANOVA (Kruskal–Wallis) reveal no significant difference (P > 0.05) between naïve and EAE + laquinimod groups. ***P < 0.001, EAE + vehicle versus naïve; *P < 0.05, EAE + vehicle versus EAE + laquinimod. For miR124a, levels in the spinal cord were highest in EAE mice treated with laquinimod (D); *P < 0.05, EAE+vehicle versus EAE+laquinimod (one-way ANOVA with Tukey's post hoc comparisons). In E, spinal cords subjected to PCR analysis display elevation of CD68, iNOS, IL-1β and MyD88 transcripts in EAE that is attenuated in laquinimod-treated mice. *P < 0.05, **P < 0.01, ***P < 0.001 compared to EAE + vehicle.
We found that miR124a content in the spinal cord was reduced in EAE-afflicted animals, as reported by others;33 however, this was restored by laquinimod (Fig. 5D). Moreover, transcripts encoding markers associated with activation of microglia/macrophage were increased in the spinal cord of EAE-afflicted mice and these were normalized in laquinimod-treated animals (Fig. 5E).
Next, we evaluated axonal integrity and found that axonal loss, swollen bulbs, and axonal transections were evident in EAE-afflicted mice treated with vehicle, while EAE immunized mice treated with preventative laquinimod had relative preservation of axons (Fig. 6A–I). Finally, the rank on the order of microglia/macrophages activation and axonal injury was correlated for individual mice, and the results (Fig. 6J) show a strong correlation coefficient that approached one. Thus, the activation of microglia/macrophages was correspondent with axonal injury in their vicinity, and both were reduced by laquinimod.
Figure 6.

Areas of axonal injury in EAE-afflicted spinal cord are correspondent with accumulation of microglia/macrophages; benefits of laquinimod. Iba1 microglia/macrophage (A–D) accumulation corresponds with reduced axonal density (Bielchowsky silver stains, E–H) in EAE + vehicle mice {A/E and B/F are adjacent sections at low (10× original magnification) or high (40×) magnification respectively}. In contrast, mice with laquinimod treatment had relatively normal profiles (C/G and D/H are adjacent sections at low and high magnification respectively). A blinded rank order analysis of axonal disruption/loss (I) in individual mice is displayed, where the increasing severity is represented by a higher rank order. **P < 0.01, nonparametric one-way ANOVA (Kruskal–Wallis). (J) Respective rank orders of individual mice for axonal disruption/loss and extent of Iba1 immunoreactivity (from Fig. 5) are compared.
Therapeutic treatment with laquinimod decreases the prominent density of activated microglia/macrophages in chronic EAE and halts the progression of axonal loss and demyelination
We tested the capacity of laquinimod to resolve established EAE disease. In a first series of experiments, mice were initiated treatment at day 17, when clinical scores of mice were near/at peak severity (tail and all four limbs affected). Figure 7A shows that over the next 21 days, the chronic EAE mice treated with vehicle continued to display significant disabilities whereas in those treated with laquinimod, clinical signs gradually resolved, although this was not complete resolution of disability. Blinded rank order analyses of inflammation and demyelination in the spinal cord at death found chronic EAE vehicle mice to have the worst severity while that of chronic EAE mice treated with laquinimod were maintained at the level of mice sacrificed at the time of initiation of treatment (henceforth called EAE control) (Fig. 7B). PCR determinations revealed that inflammatory markers associated with microglia/macrophages (iNOS, IL-1β, and MyD88) had largely resolved in laquinimod mice compared to the still high levels in the spinal cord of EAE control or chronic EAE vehicle mice (Fig. 7C).
Figure 7.

Therapeutic treatment with laquinimod decreases clinical and histological severity of EAE correspondent with lower level of transcripts of markers of activated microglia/macrophages. Treatment from day 17 following MOG immunization with 25 mg/kg laquinimod lowered clinical scores in chronic EAE (A); there were five EAE controls (i.e., mice killed at the time of initiation of treatment in other groups), and eight each of chronic EAE mice treated with laquinimod or vehicle. (B) The daily clinical score is added per animal to obtain the sum of disability score for that mouse; this represents the overall burden of clinical disease per animal. The mean sum of disability score comparison between treatments, when plotted for the entire experiment (i.e., from day 0), or from onset of treatment (Rx) when mice are severely disabled, further highlights the amelioration of clinical disease activity in chronic EAE by laquinimod. *P < 0.05, **P < 0.01. At sacrifice (day 38), the H&E/LFB histology scores indicate that there was continued worsening with chronic EAE compared to naive or EAE controls but this was mitigated with laquinimod (C). Levels of transcripts (D) encoding markers likely to be enriched in microglia/macrophages indicate that there was elevation of iNOS, IL-1β or MyD88 in the EAE controls, and this was decreased in chronic EAE and lowered still in chronic EAE mice + laquinimod. *P < 0.05; **P < 0.01 compared between the indicated groups. Statistical difference was maintained when the outlier (top value) in the chronic EAE group was removed.
We examined the density of axons and microglia/macrophages in the spinal cord. Qualitatively, axonal loss (Bielchowsky silver stain) and the density of microglia/macrophages (Iba1) continued to worsen from day 17 (EAE control) to 38 (chronic EAE) and this appeared to be prevented by laquinimod (Fig. 8). This was corroborated by blinded rank order analyses of axonal integrity or axonal counts, where the two measures were significantly correlated (Fig. 9A). Remarkably, the number of axons in chronic EAE mice treated with laquinimod matched those of EAE control (i.e., mice sacrificed at day 17 when treatment was initiated), suggesting that the progressive axonal degeneration in EAE was halted by laquinimod.
Figure 8.

Qualitative histopathology of mice in chronic EAE. From the mice in Figure 7 at sacrifice, consecutive longitudinal spinal cord sections were subjected to H&E/LFB for general histology of inflammation and demyelination, Bielchowsky silver stain for axons, and Iba1 immunohistochemistry for microglia/macrophages. All indices of neuropathology appeared increased in severity in chronic EAE (day 38 following MOG) compared to EAE controls (day 17), and the progressive changes were qualitatively diminished by laquinimod. The area of investigation was the lateral column of the spinal cord.
Figure 9.

Laquinimod halts the progression of histopathology in chronic EAE. By blinded rank order or quantitative analyses, the extent of axon loss or microglia/macrophage density was worst in chronic EAE mice treated with vehicle, was intermediate in the EAE control group, and was least in the chronic EAE mice dosed with laquinimod. Indeed, the levels in the laquinimod group at day 38 after 21d of treatment were comparable to those at initiation of treatment (EAE control group, day 17 of EAE). For both axonal integrity and microglia/macrophage density, the blinded rank order analyses were highly correlated with quantitative counts (A,B). Finally, the correlation between axonal integrity (axonal counts from the silver stain) and microglia/macrophage Iba1 density was highly significant in chronic EAE (C). # represent comparison with chronic EAE, # and ## denotes P < 0.05, 0.01.
The density of activated microglia/macrophages was examined by rank order analyses or Iba1 thesholded area of staining, and the results from the two analyses were highly correlated; microglia/macrophages were highest in chronic EAE treated with vehicle, and lower and comparable between EAE control and chronic EAE mice administered laquinimod (Fig. 9B). In all cases, axonal counts and microglia/macrophage density were correlated (Fig. 9C).
In a second series of experiments, EAE-afflicted mice were initiated vehicle or laquinimod treatment from day 30 of disease, for the next 30 days. Laquinimod ameliorated but did not completely resolve clinical severity in chronic EAE, and it reduced demyelination compared to vehicle control (Fig. S1). Indeed, laquinimod prevented the progression of demyelination that occurred over 30 days in vehicle-treated animals; this was mainly due to an inhibition of the expansion of existing lesions and not due to the prevention of the formation of new lesions. The extent of microglia/macrophage immunoreactivity was also reduced by laquinimod (Fig. S1).
Overall, in chronic EAE with ongoing axonal loss, demyelination and microglia/macrophage activation, laquinimod treatment initiated in mice with significant disability prevented the progressive histological changes.
In coculture of neurons and microglia, activated microglia kill neurons and this is reduced by laquinimod
Although the correspondence of activated microglia/macrophages and axonal injury in the mouse spinal cord suggests a causative relationship, this remains an association. Thus, we designed a coculture model, in which microglia with prior or no exposure to laquinimod was added to neurons. The addition of iLPS to coculture of neurons and microglia elevated NO and killed neurons, and this was diminished by the laquinimod pretreatment of microglia for both the murine and human cocultures (Fig. 10). Laquinimod was not protective in neuron-enriched or neuron-microglia cocultures that were exposed to insults directed at neurons, including ferrous ion and hydrogen peroxide (Fig. S2). Thus, laquinimod was not directly protective for neurons, but ameliorated neurotoxicity caused by activated microglia.
Figure 10.

In culture, laquinimod reduces iLPS-activated, microglia-mediated toxicity to mouse and human neurons. Syngeneic mouse microglia and neurons were cocultured and the addition of iLPS promptly reduced neuronal counts 24 h after (A; MAP-2 staining for neurons in red; DAPI for nuclei in yellow) correspondent with elevation of NO levels (B). Pretreatment of microglia with 1 μmol/L laquinimod (LQ) reduced neuronal loss (A) and this was verified by automated counting of remaining mouse neurons through ImageXpressMicro quantitation (C). Similarly, human neurons in coculture with autologous microglia were reduced in numbers in the presence of iLPS, and this was prevented by laquinimod pretreatment of microglia. Mean ± SEM of quadruplicate analyses. *P < 0.05, ***P < 0.001 compared to iLPS alone (one-way ANOVA with Tukey's post hoc comparisons). iLPS added to neurons in the absence of microglia did not kill neurons (Fig. S2).
Discussion
As a potential medication for relapsing-remitting MS, laquinimod has characteristics distinct from those of established immunomodulators. Specifically, results from two Phase III trials12,13 suggest that laquinimod exerts a significant impact within the CNS. In support, laquinimod reduces astrocyte activation,22 prevents demyelination produced by cuprizone,22 attenuates synaptic alterations,23 and it promotes remyelination and axonal conduction in EAE.24 We now report that laquinimod is a direct inhibitor of microglial activation, likely involving miR124a regulation, and that it supports neuroaxonal survival via this activity. Previous work has shown that miR124a maintains microglia quiescence.33,34 In our tissue culture studies, we found that both pro- and anti-inflammatory cytokines are reduced in activated microglia by laquinimod (Fig. 2). These results suggest that laquinimod normalizes microglia activity and returns them to near basal state, rather than polarize microglia from one state (e.g., proinflammatory) to another (e.g., anti-inflammatory). We note that activated microglia exposed to laquinimod are not completely at basal level, as growth factors are still elevated in the laquinimod-exposed microglia (Fig. 2).
Microglial activation is an invariant feature of neurological insults. Some of the properties of activated microglia are beneficial, including the defense of the nervous system against infections.6,7 However, the excessive and prolonged activation of microglia as noted in conditions such as MS1–4 is likely to be detrimental.8–10,35 Thus, it is noteworthy that the treatment of EAE-afflicted mice with laquinimod in a preventative or therapeutic paradigm reduced the density of microglia/macrophages in the spinal cord and that this was correlated with decreased axonal injury. Indeed, it is remarkable that laquinimod prevented the further loss of axons and myelin, when the treatment was initiated at significant clinical severity where axons and myelin were already being lost (Figs. 9A and S1). The further expansion of preexisting lesions is a major pathology of progressive MS and this expansion was halted by laquinimod. The correlation between activated microglia/macrophages and axonal density in our study is likely causative, as the activation of microglia in tissue culture that results in neuronal death is attenuated by the treatment of microglia with laquinimod (Fig. 10). One mediator of neuronal death is NO,36 and we found that the generation of NO in murine microglia in culture is reduced by laquinimod (Fig. 10B); in EAE, iNOS expression in the spinal cord is reduced by preventative (Fig. 5B) or therapeutic (Fig. 7C) laquinimod treatment. It is likely that other neurotoxins are also reduced by the treatment of microglia with laquinimod. In support, MMP-937 from activated microglia can kill neurons, and it is possible that reduced amounts of MMP-9 (Fig. 2) or other neurotoxins generated by activation of the JNK, AKT, or 90RSK pathways help account for the laquinimod-mediated neuroprotection against activated microglia.
The activation of microglia is a feature of progressive MS2,38,39 for which there is no current treatment. Our data provides the rationale that laquinimod may be useful in progressive MS to reduce the microglia activation contributing to the axonal degeneration seen in this condition.
While our results emphasize that laquinimod is a direct inhibitor of microglia activation that reduces neurodegenerative insults, we are cognizant that some of the outcomes of laquinimod are contributed by its immunomodulatory activities. As noted earlier, the mechanisms of action of laquinimod include the generation of Th2 cells14 and Type 2 regulatory monocytes and dendritic cells.15–17 Laquinimod reduces the activity of B cells18 and mitigates the accumulation of proinflammatory monocytes in the CNS.19 It also inhibits the antigen-presenting capacity of myeloid cells.15
In summary, we have discovered that a potential MS medication, laquinimod, inhibits the activation of microglia and reduces microglia-mediated neuroaxonal injury. These results have implications in understanding the clinical effects observed with laquinimod in two Phase III trials, and they provide the rationale of using laquinimod in progressive forms of MS.
Acknowledgments
This study was sponsored by an unrestricted research operating grant from Teva Pharmaceuticals, Israel, and the Canadian Institutes of Health Research. MKM was supported by a fellowship from Alberta Innovates – Health Solutions (AIHS). MBK receives studentship support from AIHS and the MS Society of Canada. VWY is a Canada Research Chair in Neuroimmunology (Tier 1) that provides his salary. These sources of support are gratefully acknowledged. LH is an employee of Teva Pharmaceuticals Industries.
Conflict of Interest
None declared.
Supporting Information
Additional Supporting Information may be found in the online version of this article:
Figure S1. Treatment of mice from 30 days of EAE with laquinimod reduced clinical severity, demyelination, and activated microglia/macrophage density in lesions. Mice were immunized for EAE with MOG35-55 peptide. At day 30, with mice having impairment of tail, fore- and hind limbs (EAE is on a five-point scale), daily oral laquinimod treatment was initiated. Clinical scores declined in the laquinimod but not the control vehicle group (A). The extent of demyelination was tabulated by previously described methods.25 In contrast to the progression of demyelination in the control group from day 30 to 60 of EAE, this was prevented by laquinimod (C); mean ± SEM, n of 15 each. Density of activated S100A9-positive microglia/macrophages was also reduced by laquinimod treatment at day 60 compared to day 30 controls.
Figure S2. Laquinimod did not protect human neurons against insults that kill neurons directly. Ferrous ion (Fe) and hydrogen peroxide (H2O2) are two stressors that kill neurons in neuron-enriched (data herein) or neuron-microglia cocultures (not shown). MAP-2 staining for neurons 24 h after exposure shows prominent loss of neurons in H2O2 or iron-exposed cultures that were not reduced by the presence of laquinimod (LQ) (A). This was confirmed by quantitation using ImageXpress (B). Mean ± SEM, n of four cultures. ***P < 0.001 compared to neurons only, or neurons + iLPS (interferon-γ and LPS). The above also demonstrates that iLPS added to neuron-enriched cultures without microglia did not result in neuronal loss. Thus, the protection against microglia-induced neuronal loss by laquinimod reported in this article occurred through affecting the microglia intermediary and not by a direct action on neurons.
References
- 1.Howell OW, Rundle JL, Garg A, et al. Activated microglia mediate axoglial disruption that contributes to axonal injury in multiple sclerosis. J Neuropathol Exp Neurol. 2010;69:1017–1033. doi: 10.1097/NEN.0b013e3181f3a5b1. [DOI] [PMC free article] [PubMed] [Google Scholar]
- 2.Prineas JW, Kwon EE, Cho ES, et al. Immunopathology of secondary-progressive multiple sclerosis. Ann Neurol. 2001;50:646–657. doi: 10.1002/ana.1255. [DOI] [PubMed] [Google Scholar]
- 3.Singh S, Metz I, Amor S, et al. Microglial nodules in early multiple sclerosis white matter are associated with degenerating axons. Acta Neuropathol. 2013;125:595–608. doi: 10.1007/s00401-013-1082-0. [DOI] [PMC free article] [PubMed] [Google Scholar]
- 4.Lucchinetti C, Bruck W, Parisi J, et al. Heterogeneity of multiple sclerosis lesions: implications for the pathogenesis of demyelination. Ann Neurol. 2000;47:707–717. doi: 10.1002/1531-8249(200006)47:6<707::aid-ana3>3.0.co;2-q. [DOI] [PubMed] [Google Scholar]
- 5.Rasmussen S, Wang Y, Kivisakk P, et al. Persistent activation of microglia is associated with neuronal dysfunction of callosal projecting pathways and multiple sclerosis-like lesions in relapsing–remitting experimental autoimmune encephalomyelitis. Brain. 2007;130(Pt 11):2816–2829. doi: 10.1093/brain/awm219. [DOI] [PubMed] [Google Scholar]
- 6.Nimmerjahn A, Kirchhoff F, Helmchen F. Resting microglial cells are highly dynamic surveillants of brain parenchyma in vivo. Science. 2005;308:1314–1318. doi: 10.1126/science.1110647. [DOI] [PubMed] [Google Scholar]
- 7.Ransohoff RM, Cardona AE. The myeloid cells of the central nervous system parenchyma. Nature. 2010;468:253–262. doi: 10.1038/nature09615. [DOI] [PubMed] [Google Scholar]
- 8.Glass CK, Saijo K, Winner B, et al. Mechanisms underlying inflammation in neurodegeneration. Cell. 2010;140:918–934. doi: 10.1016/j.cell.2010.02.016. [DOI] [PMC free article] [PubMed] [Google Scholar]
- 9.Takeuchi H. Neurotoxicity by microglia: mechanisms and potential therapeutic strategy. Clin Exp Neuroimmunol. 2010;1:12–21. [Google Scholar]
- 10.Nikic I, Merkler D, Sorbara C, et al. A reversible form of axon damage in experimental autoimmune encephalomyelitis and multiple sclerosis. Nat Med. 2011;17:495–499. doi: 10.1038/nm.2324. [DOI] [PubMed] [Google Scholar]
- 11.Kooi EJ, Strijbis EM, van der Valk P, Geurts JJ. Heterogeneity of cortical lesions in multiple sclerosis: clinical and pathologic implications. Neurology. 2012;79:1369–1376. doi: 10.1212/WNL.0b013e31826c1b1c. [DOI] [PubMed] [Google Scholar]
- 12.Comi G, Jeffery D, Kappos L, et al. Placebo-controlled trial of oral laquinimod for multiple sclerosis. N Engl J Med. 2012;366:1000–1009. doi: 10.1056/NEJMoa1104318. [DOI] [PubMed] [Google Scholar]
- 13.Vollmer TL, Soelberg SP, Arnold DL. A placebo-controlled and active comparator phase III trial (BRAVO) for relapsing-remitting multiple sclerosis. Mult Scler. 2011;17:S507. [Google Scholar]
- 14.Yang JS, Xu LY, Xiao BG, et al. Laquinimod (ABR-215062) suppresses the development of experimental autoimmune encephalomyelitis, modulates the Th1/Th2 balance and induces the Th3 cytokine TGF-beta in Lewis rats. J Neuroimmunol. 2004;156:3–9. doi: 10.1016/j.jneuroim.2004.02.016. [DOI] [PubMed] [Google Scholar]
- 15.Jolivel V, Luessi F, Masri J, et al. Modulation of dendritic cell properties by laquinimod as a mechanism for modulating multiple sclerosis. Brain. 2013;136:1048–1066. doi: 10.1093/brain/awt023. [DOI] [PubMed] [Google Scholar]
- 16.Schulze-Topphoff U, Shetty A, Varrin-Doyer M, et al. Laquinimod, a quinoline-3-carboxamide, induces type II myeloid cells that modulate central nervous system autoimmunity. PLoS One. 2012;7:e33797. doi: 10.1371/journal.pone.0033797. [DOI] [PMC free article] [PubMed] [Google Scholar]
- 17.Bruck W, Zamvil SS. Laquinimod, a once-daily oral drug in development for the treatment of relapsing-remitting multiple sclerosis. Expert Rev Clin Pharmacol. 2012;5:245–256. doi: 10.1586/ecp.12.12. [DOI] [PubMed] [Google Scholar]
- 18.Toubi E, Nussbaum S, Staun-Ram E, et al. Laquinimod modulates B cells and their regulatory effects on T cells in multiple sclerosis. J Neuroimmunol. 2012;251:45–54. doi: 10.1016/j.jneuroim.2012.07.003. [DOI] [PubMed] [Google Scholar]
- 19.Mishra MK, Wang J, Silva C, et al. Kinetics of proinflammatory monocytes in a model of multiple sclerosis and its perturbation by laquinimod. Am J Pathol. 2012;181:642–651. doi: 10.1016/j.ajpath.2012.05.011. [DOI] [PubMed] [Google Scholar]
- 20.Bruck W, Vollmer T. Multiple sclerosis: oral laquinimod for MS – bringing the brain into focus. Nat Rev Neurol. 2013;9:664–665. doi: 10.1038/nrneurol.2013.234. [DOI] [PubMed] [Google Scholar]
- 21.Filippi M, Rocca MA, Pagani E, et al. Placebo-controlled trial of oral laquinimod in multiple sclerosis: MRI evidence of an effect on brain tissue damage. J Neurol Neurosurg Psychiatry. 2013 doi: 10.1136/jnnp-2013-306132. DOI: 10.1136/jnnp-2013-306132. [Epub ahead of print] [DOI] [PubMed] [Google Scholar]
- 22.Bruck W, Pfortner R, Pham T, et al. Reduced astrocytic NF-kappaB activation by laquinimod protects from cuprizone-induced demyelination. Acta Neuropathol. 2012;124:411–424. doi: 10.1007/s00401-012-1009-1. [DOI] [PMC free article] [PubMed] [Google Scholar]
- 23.Ruffini F, Rossi S, Bergamaschi A, et al. Laquinimod prevents inflammation-induced synaptic alterations occurring in experimental autoimmune encephalomyelitis. Mult Scler. 2013;19:1084–1094. doi: 10.1177/1352458512469698. [DOI] [PubMed] [Google Scholar]
- 24.Moore S, Khalaj AJ, Yoon J, et al. Therapeutic laquinimod treatment decreases inflammation, initiates axon remyelination, and improves motor deficit in a mouse model of multiple sclerosis. Brain Behav. 2013;3:664–682. doi: 10.1002/brb3.174. [DOI] [PMC free article] [PubMed] [Google Scholar]
- 25.Wegner C, Stadelmann C, Pfortner R, et al. Laquinimod interferes with migratory capacity of T cells and reduces IL-17 levels, inflammatory demyelination and acute axonal damage in mice with experimental autoimmune encephalomyelitis. J Neuroimmunol. 2010;227:133–143. doi: 10.1016/j.jneuroim.2010.07.009. [DOI] [PubMed] [Google Scholar]
- 26.Williams K, Bar-Or A, Ulvestad E, et al. Biology of adult human microglia in culture: comparisons with peripheral blood monocytes and astrocytes. J Neuropathol Exp Neurol. 1992;51:538–549. doi: 10.1097/00005072-199209000-00009. [DOI] [PubMed] [Google Scholar]
- 27.Vecil GG, Larsen PH, Corley SM, et al. Interleukin-1 is a key regulator of matrix metalloproteinase-9 expression in human neurons in culture and following mouse brain trauma in vivo. J Neurosci Res. 2000;61:212–224. doi: 10.1002/1097-4547(20000715)61:2<212::AID-JNR12>3.0.CO;2-9. [DOI] [PubMed] [Google Scholar]
- 28.Cua RC, Lau LW, Keough MB, et al. Overcoming neurite-inhibitory chondroitin sulfate proteoglycans in the astrocyte matrix. Glia. 2013;61:972–984. doi: 10.1002/glia.22489. [DOI] [PubMed] [Google Scholar]
- 29.Lau LW, Keough MB, Haylock-Jacobs S, et al. Chondroitin sulfate proteoglycans in demyelinated lesions impair remyelination. Ann Neurol. 2012;72:419–432. doi: 10.1002/ana.23599. [DOI] [PubMed] [Google Scholar]
- 30.Giuliani F, Metz LM, Wilson T, et al. Additive effect of the combination of glatiramer acetate and minocycline in a model of MS. J Neuroimmunol. 2005;158:213–221. doi: 10.1016/j.jneuroim.2004.09.006. [DOI] [PubMed] [Google Scholar]
- 31.Goncalves DaSilva A, Yong VW. Matrix metalloproteinase-12 deficiency worsens relapsing-remitting experimental autoimmune encephalomyelitis in association with cytokine and chemokine dysregulation. Am J Pathol. 2009;174:898–909. doi: 10.2353/ajpath.2009.080952. [DOI] [PMC free article] [PubMed] [Google Scholar]
- 32.Sloka S, Metz LM, Hader W, et al. Reduction of microglial activity in a model of multiple sclerosis by dipyridamole. J Neuroinflamm. 2013;10:89. doi: 10.1186/1742-2094-10-89. [DOI] [PMC free article] [PubMed] [Google Scholar]
- 33.Ponomarev ED, Veremeyko T, Barteneva N, et al. MicroRNA-124 promotes microglia quiescence and suppresses EAE by deactivating macrophages via the C/EBP-alpha-PU.1 pathway. Nat Med. 2011;17:64–70. doi: 10.1038/nm.2266. [DOI] [PMC free article] [PubMed] [Google Scholar]
- 34.Freilich RW, Woodbury ME, Ikezu T. Integrated expression profiles of mRNA and miRNA in polarized primary murine microglia. PLoS One. 2013;8:e79416. doi: 10.1371/journal.pone.0079416. [DOI] [PMC free article] [PubMed] [Google Scholar]
- 35.Popovich PG, Guan Z, McGaughy V, et al. The neuropathological and behavioral consequences of intraspinal microglial/macrophage activation. J Neuropathol Exp Neurol. 2002;61:623–633. doi: 10.1093/jnen/61.7.623. [DOI] [PubMed] [Google Scholar]
- 36.Zhang J, Hung AC, Ng PY, et al. PKCdelta mediates Nrf2-dependent protection of neuronal cells from NO-induced apoptosis. Biochem Biophys Res Commun. 2009;386:750–756. doi: 10.1016/j.bbrc.2009.06.129. [DOI] [PubMed] [Google Scholar]
- 37.Kauppinen TM, Swanson RA. Poly(ADP-ribose) polymerase-1 promotes microglial activation, proliferation, and matrix metalloproteinase-9-mediated neuron death. J Immunol. 2005;174:2288–2296. doi: 10.4049/jimmunol.174.4.2288. [DOI] [PubMed] [Google Scholar]
- 38.Kutzelnigg A, Lucchinetti CF, Stadelmann C, et al. Cortical demyelination and diffuse white matter injury in multiple sclerosis. Brain. 2005;128:2705–2712. doi: 10.1093/brain/awh641. [DOI] [PubMed] [Google Scholar]
- 39.Lassmann H, van Horssen J, Mahad D. Progressive multiple sclerosis: pathology and pathogenesis. Nat Rev Neurol. 2012;8:647–656. doi: 10.1038/nrneurol.2012.168. [DOI] [PubMed] [Google Scholar]
Associated Data
This section collects any data citations, data availability statements, or supplementary materials included in this article.
Supplementary Materials
Figure S1. Treatment of mice from 30 days of EAE with laquinimod reduced clinical severity, demyelination, and activated microglia/macrophage density in lesions. Mice were immunized for EAE with MOG35-55 peptide. At day 30, with mice having impairment of tail, fore- and hind limbs (EAE is on a five-point scale), daily oral laquinimod treatment was initiated. Clinical scores declined in the laquinimod but not the control vehicle group (A). The extent of demyelination was tabulated by previously described methods.25 In contrast to the progression of demyelination in the control group from day 30 to 60 of EAE, this was prevented by laquinimod (C); mean ± SEM, n of 15 each. Density of activated S100A9-positive microglia/macrophages was also reduced by laquinimod treatment at day 60 compared to day 30 controls.
Figure S2. Laquinimod did not protect human neurons against insults that kill neurons directly. Ferrous ion (Fe) and hydrogen peroxide (H2O2) are two stressors that kill neurons in neuron-enriched (data herein) or neuron-microglia cocultures (not shown). MAP-2 staining for neurons 24 h after exposure shows prominent loss of neurons in H2O2 or iron-exposed cultures that were not reduced by the presence of laquinimod (LQ) (A). This was confirmed by quantitation using ImageXpress (B). Mean ± SEM, n of four cultures. ***P < 0.001 compared to neurons only, or neurons + iLPS (interferon-γ and LPS). The above also demonstrates that iLPS added to neuron-enriched cultures without microglia did not result in neuronal loss. Thus, the protection against microglia-induced neuronal loss by laquinimod reported in this article occurred through affecting the microglia intermediary and not by a direct action on neurons.