

A universal feature of the response to stress and nutrient limitation is transcriptional upregulation of genes encoding proteins important for survival. Under many of these conditions overall protein synthesis levels are reduced, thereby dampening the stress response at the level of protein expression1. For example, during glucose starvation in yeast, translation is rapidly repressed, yet transcription of many stress- and glucose-repressed genes is increased2,3. Using ribosome profiling and microscopy, we found that this transcriptionally upregulated gene set consists of two classes: (1) one producing mRNAs that are translated during glucose limitation and are diffusely localized in the cytoplasm – this class includes many heat shock protein mRNAs; and (2) another producing mRNAs that are not efficiently translated during glucose limitation and are concentrated in foci that co-localize with P bodies and stress granules – this class is enriched for glucose metabolism mRNAs. Surprisingly, the information specifying differential localization and protein production of these two classes of mRNAs is encoded in the promoter sequence – promoter responsiveness to heat shock factor (Hsf1) specifies diffuse cytoplasmic localization and higher protein production upon glucose starvation. Thus, promoter sequences and transcription factor binding can influence not only mRNA levels, but also subcellular localization of mRNAs and the efficiency with which they are translated, enabling cells to tailor protein production to environmental conditions.
To investigate how cells alter gene expression during stress conditions that elicit an overall reduction in translation, we performed ribosomal profiling4 on budding yeast cells grown in glucose replete and glucose starvation conditions. In agreement with previous results2, during glucose starvation there was a collapse of polysomes into the 80S monosome peak, indicative of a reduction in global translation (Extended Data Fig. 1a). As reported previously3, we observed an inverse correlation between the change in ribosome occupancy upon glucose starvation and the change in mRNA levels (Fig. 1a and Extended Data Fig. 2). For mRNAs whose levels increase in glucose starvation we observe two different classes of behavior: some upregulated mRNAs (log2 fold-change >2.5) had a decrease in ribosome occupancy upon glucose starvation (log2 <−1; Fig. 1a, blue dots); and others had a relative increase in ribosome occupancy that was greater than the median increase of all genes (log2 >.09; Figure 1a, red vs. black dots).
Figure 1. Ribosome profiling reveals differences in ribosome occupancy of transcriptionally upregulated mRNAs upon glucose starvation.

a, Fold change in ribosome occupancy versus fold change mRNA levels, 15 minutes after cells are transferred to medium lacking glucose. Genes are represented by individual symbols on the plot. Ribosome occupancy is calculated for the coding region of each gene by dividing the total number of ribosome sequence counts in an open reading frame (normalized to total aligned reads – reads per million reads - RPM) by the number of mRNA sequence counts (RPM) in the same sequence. RNA sequencing was performed on RNA depleted for rRNA, but not polyA selected. Red symbols indicate genes that have upregulated mRNA levels (>2.5) and higher ribosome occupancy (>0.09), blue symbols denote genes that have upregulated mRNA levels (>2.5) with lower ribosome occupancy (<−1.0),and green symbols indicate genes that have decreased mRNA levels (<−1.25)in glucose limitation. Black symbols represent all other genes in the genome for which measurements were obtained. b, Ribosome occupancy (calculated as ribosome reads at each position relative to the average mRNA reads per base pair), for 3 classes of mRNAs: those from genes that have high levels of mRNA prior to glucose limitation (black); those whose mRNA levels increase in glucose limitation and have higher ribosome occupancy in glucose limitation (red); and those whose mRNA levels increase in glucose limitation and have lower ribosome occupancy (blue). Time point shown is 15 min after glucose starvation. c, Strains expressing TAP-tagged versions of the indicated genes19 grown in glucose-rich medium and then starved for glucose. mRNA levels were measured by qPCR after 15 minutes of glucose starvation, protein abundances were measured after 30 minutes of starvation, and the mean fold changes in protein abundance (solid bars) and mRNA levels (striped bars) ± standard error of the mean (s.e.m.) were calculated relative to their respective values in glucose-rich medium. The Western blotting experiments were performed on four independent biological replicates and normalized to Tub1 protein levels. Hsp30 and Hsp26 protein levels were significantly increased upon glucose starvation compared to growth in glucose-rich medium (p<0.05). A one-tailed, paired t-test was used to determine p-values. mRNA measurements were made on three independent biological replicates and normalized to ACT1 mRNA levels.
Moreover, during glucose starvation we observe significantly higher ribosome occupancy in the coding region of the upregulated, increased ribosome occupancy genes than for the upregulated, decreased ribosome occupancy group (Fig. 1b; red vs. blue genes). The upregulated, higher ribosome occupancy genes were enriched for stress-response genes (16 of 26 genes; p= 2.4E−9), including those encoding heat shock proteins, whereas the upregulated mRNAs with lower ribosomal occupancy were enriched for those encoding proteins involved in glucose metabolism (7 of 18 genes; p=7.8E−4) (Fig 1a,b and Extended Data Table 1). Because there is a large reduction in global translation during glucose limitation, our measurements of ribosome occupancy in this condition are almost certainly overestimates (see Methods). Although this overestimation increases the fold change in ribosome occupancy for all genes, relative differences between genes are preserved (e.g. red versus blue genes). Moreover, we observe these relative differences in ribosome occupancy in different yeast strains and using different RNA isolation methods (Extended Data Fig. 2, Supplementary Table 1). Thus, mRNAs upregulated during glucose starvation have differences in ribosome occupancy.
To determine if the differences in ribosome occupancy translate into to differences in protein production during glucose starvation, we measured protein levels by Western blotting. We observed significant increases in proteins derived from the upregulated, higher ribosome occupancy genes HSP30 and HSP26 (8-fold and 2-fold, respectively; red bars, Fig. 1c), but no significant change in protein levels for proteins derived from either lower ribosome occupancy gene (blue bars, Fig. 1c), even though the mRNAs were induced to similar levels (Fig. 1c). For all upregulated genes that were measured, we observed a corresponding increase in RNA polymerase II occupancy in their ORFs, suggesting that increased transcription contributes to upregulation of these mRNAs in glucose starvation (Extended Data Fig. 3). Thus, upon glucose starvation, transcriptionally upregulated mRNAs have differences in ribosome occupancy, which lead to differences in protein production.
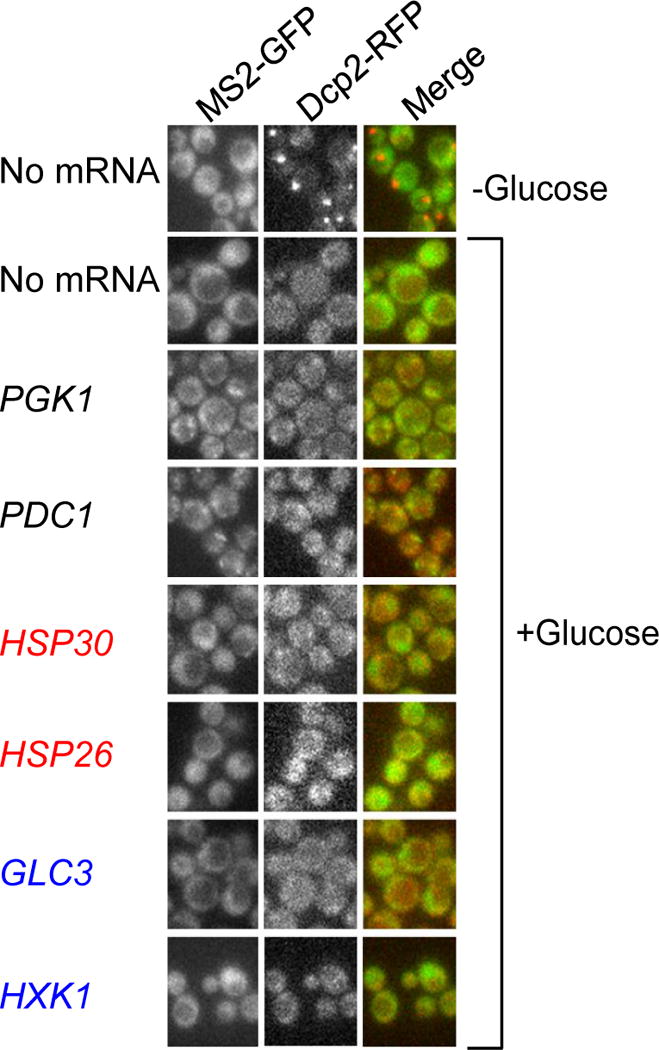
Since some mRNAs localize to messenger ribonucleoprotein (mRNP) foci (including P bodies and stress granules) during glucose limitation5, one possibility is that mRNA localization influences the ribosome occupancy and translational properties of an mRNA. To investigate whether mRNAs that have differences in ribosome occupancy have differences in localization during glucose limitation, we generated fusions of gene coding regions with the MS2 sequence and visualized mRNAs using the MS2-coat protein fused to GFP, and P bodies using RFP fused to the P body protein component Dcp26. In agreement with previous observations, PGK1 and PDC1, mRNAs that are abundant pre-starvation, localized predominantly to P bodies after glucose starvation7 (Fig. 2a,b). In contrast, the transcriptionally upregulated higher ribosome occupancy mRNAs HSP26 and HSP30 remained diffusely localized during glucose starvation, and the transcriptionally upregulated lower ribosome occupancy mRNAs GLC3 and HXK1 became localized to P bodies as well as other foci (Fig. 2a,b). The formation of foci was dependent on glucose starvation (Extended Data Fig. 4). Stress granules, containing high concentrations of translation initiation factors, are formed during conditions in which translation is impaired and have been shown to partially overlap with P body foci8. Using a Pab1-cyan fluorescent protein (CFP) fusion to visualize stress-granules9, we found that stress granules co-localize with a subset of P bodies, as well as with GLC3 mRNA foci that were independent of P bodies (Fig. 2c). Therefore, mRNA classes with different ribosome occupancy and protein production properties have distinct subcellular localization patterns.
Figure 2. Glucose starvation induces differences in localization of mRNAs.

a, The promoter, 5′ UTR and ORF for genes of interest were fused upstream of the MS2 sequence and the native 3′ UTR and then visualized with fluorescence microscopy using an MS2-coat protein-GFP fusion after 15 min of glucose starvation. Dcp2-RFP was used to visualize P bodies6. b, Quantification of mRNA localization to P bodies, as measured by overlap of the MS2 signal with that of the P body marker Dcp2-RFP. Cells without foci were cells that had P body foci but no GFP foci. For cells that contain both GFP (MS2) and RFP (P body) foci, the foci were categorized as either co-localized with P bodies or non-overlapping/distinct from P bodies. Values are means ±s.e.m. from Fig. 2a measured on a minimum of 25 cells in quadruplicate (two biological replicates with two technical replicates per sample). Cells expressing the HSP30 and HSP26 mRNAs had fewer foci in comparison to cells expressing PGK1, PDC1, GLC3, or HXK1 mRNAs (p<0.01). Cells expressing GLC3 and HXK1 mRNAs had significantly more distinct foci in comparison to those expressing PGK1 and PDC1 mRNAs (p<0.05 for all comparisons). Since there were few cells with foci for those expressing HSP30 and HSP26 mRNAs, they were excluded from statistical tests because of the high measurement variability. A two-tailed, two-sample unequal variance t-test was performed to determine p-values. c, Pab1-CFP was used to visualize stress granule localization10 after 30 min of glucose starvation. Blue arrows represent stress granules (Pab1-CFP signals) that do not co-localize with P bodies (Dcp2-RFP signal). In the GLC3-MS2 strain, the Pab1-CFP stress granule foci overlap with GFP foci that are distinct from P bodies.
To investigate whether the timing of mRNA production relative to glucose limitation contributes to mRNA localization, we analyzed localization and translation of a reporter gene consisting of the doxycycline-inducible Tet-On promoter controlling expression of lacZ-MS2. When lacZ-MS2 was induced prior to glucose starvation and cells were then starved, the mRNAs co-localized predominantly with P bodies (Extended Data Fig. 5a,b) – this is consistent with the published observation that mRNAs existing pre-starvation become localized to P bodies upon glucose limitation7. In contrast, when the mRNA was induced only during glucose starvation, it formed foci that co-localized with P bodies as well as foci distinct from P bodies, a pattern similar to that of transcriptionally upregulated, lower ribosome occupancy mRNAs (blue genes in Fig. 2). These results were not sensitive to the timing of induction during starvation or to the level of induction (over a range from 4-fold to 30-fold induction) (Extended Data Fig. 5). Thus, the timing of mRNA production relative to glucose limitation influences cytoplasmic mRNA localization.
The timing of mRNA production can influence whether mRNAs are localized exclusively to P bodies or not, but what causes the differential localization and translation of transcriptionally upregulated higher- and lower-ribosome occupancy mRNAs? To determine if we could identify signals present in the mRNA itself, we fused the promoter and/or 5′ UTR of each gene to a constant ORF, CFP, and found that these fusions exhibited the same patterns of localization as the native ORFs, suggesting that the information specifying localization was contained in these elements (Fig. 3a,b, and Extended Data Fig. 6a). To determine if the promoter or 5′ UTR was sufficient to determine localization, we generated chimeras between the HSP26 promoter and the GLC3 5′ UTR, and also between the GLC3 and HXK1 promoters and the HSP26 5′ UTR. In each case the promoter was sufficient to recapitulate the localization observed for the native gene (Fig. 3a,b, and Extended Data Fig. 6a). Changes in the transcription start sites are not likely to account for these observations, as we do not see significant differences in the 5′ ends of the mRNAs produced from the chimeras (Extended Data Table 2). To determine if the correlation between localization and translation we observed previously for native genes (Figs. 1, 2) also holds for these chimeras, we measured protein production and found that the HSP promoters which specify diffuse mRNA localization have a larger increase in protein production during glucose starvation (red bars, Fig. 3c). In contrast, although the foci forming GLC3 and HXK1 promoters drive similar levels of mRNA induction as HSP26, there is no significant increase in protein production during glucose starvation from mRNAs driven by these promoters (blue bars, Fig. 3c). Thus, the promoter can influence gene expression through means other than simply controlling mRNA induction.
Figure 3. Differential localization of mRNAs is determined by the promoter.

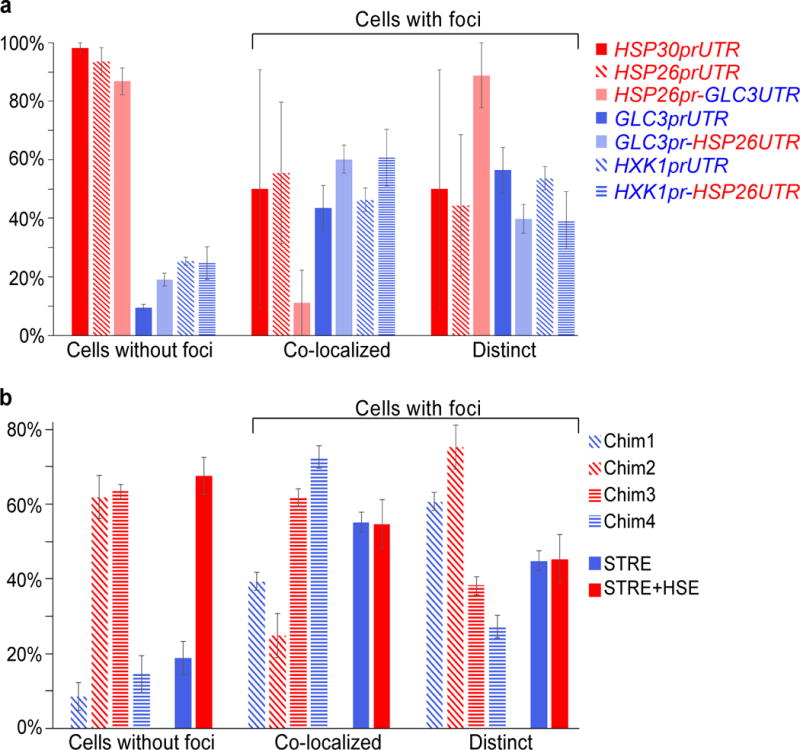
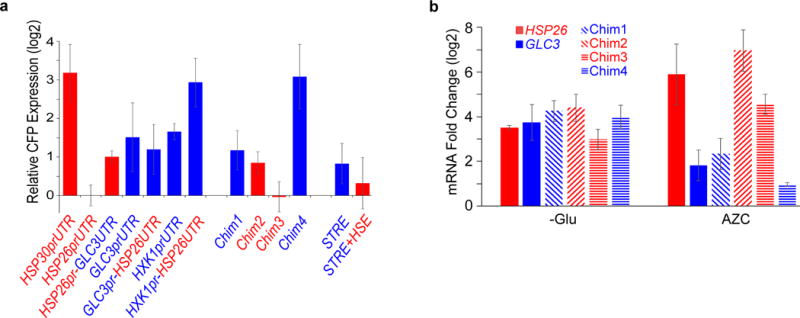
a, The promoter and 5′ UTR of the indicated genes were fused upstream of CFP-MS2 and localization of the resulting mRNA was visualized 15 min following glucose starvation. b, Quantification of data shown in Figure 3a. Values are means ± s.e.m. measured on a minimum of 30 cells in quadruplicate (two biological replicates with two technical replicates per sample). There were significantly fewer foci in the cells containing HSP30 and HSP26 promoted mRNAs (red bars) compared to cells with GLC3 or HXK1 promoted mRNAs (blue bars) (p<0.01). A two-tailed, two-sample unequal variance t-test was performed to determine p-values. c, Protein expression directed by the indicated promoter-UTR combinations was measured by Western blotting using a GFP antibody that recognizes CFP. Protein levels were measured after 30 minutes of glucose starvation and in glucose-rich medium and the fold change was calculated. MS2-CP-GFP(3x)driven by the MYO2 promoter was used as a loading control for the Western blotting. Protein fold changes are means ±s.e.m. performed on four independent biological replicates. The levels of proteins produced from HSP30 and HSP26 promoted mRNAs (red bars) were significantly increased upon glucose starvation versus growth in glucose-rich medium (p<0.01). A one-tailed, paired t-test was used to determine p-values. Fold change in mRNA levels after 15 minutes of glucose starvation versus growth in glucose-rich medium, measured by qPCR using CFP primers and ACT1 levels to normalize expression. mRNA fold change values are mean ±s.e.m. performed on three independent biological replicates.
To identify specific promoter sequences that influence mRNA localization and protein production, we made promoter chimeras between GLC3 and HSP26 and used these chimeras to drive expression of CFP-MS2. Two transcription factors that activate transcription upon glucose starvation are: Msn2/Msn4, which bind to stress-response elements (STREs)10; and Hsf1, which binds to heat-shock elements (HSEs)11. We generated chimeric promoters containing combinations of STREs and HSEs from the GLC3 and HSP26 promoters and analyzed mRNA localization from reporters. mRNA reporters whose expression is controlled by chimeras 1 and 4 were induced in response to glucose limitation, formed foci in a high percentage of cells, but produced no significant change in CFP protein levels (Fig. 4b–d and Extended Data Fig. 6b) –these chimeras exclude many of the HSE sites contained in the HSP26 promoter and maintain at least three STRE sites. In contrast, mRNA reporters whose expression is controlled by chimeras 2 and 3 were also induced in response to glucose limitation, but had generally diffuse localization (Fig. 4b–d and Extended Data Fig. 6b), more similar to that of the full HSP26 promoter, and also produced significant increases in protein levels upon glucose starvation (Fig. 4d). All four chimeras had similar levels of mRNA induction and chimeras 1 and 2 had similar absolute mRNA levels after 15 minutes of glucose starvation (Fig. 4d and Extended Data Fig. 7a). The common sequence between chimeras 2 and 3 was a 90 base pair region containing several HSEs12. To determine if Hsf1 responsiveness correlates with diffuse localization of the chimeras, we treated cells expressing different reporters with AZC, a proline analog that robustly increases Hsf1 transcriptional activity with low activation of the STRE response13. The full-length HSP26 and GLC3 promoters both exhibited strong induction from glucose starvation, but only the HSP26 promoter showed robust induction from AZC treatment (Extended Data Fig. 7b). All four of the chimeric promoters responded similarly to glucose starvation, but only chimeras 2 and 3 had greater than 20-fold induction upon treatment with AZC (Extended Data Fig. 7b). Thus, responsiveness to Hsf1 correlates with, and may contribute to, diffuse mRNA localization and protein production during glucose starvation.
Figure 4. Promoter elements influence mRNA translation efficiency and localization.

a, Schematic of promoter regions controlling expression of CFP-MS2. HSE sites are from12. b, Localization of CFP-MS2 mRNAs driven by chimeric HSP26/GLC3 promoters or synthetic STRE and STRE+HSE promoters visualized after 15 minutes of glucose starvation. Dcp2-RFP was used to visualize P bodies6. c, Quantification of data in Figure 4b. Values are means ±s.e.m. measured on a minimum of 25 cells in quadruplicate (two biological replicates with two technical replicates per sample). Chim1 and Chim4 promoted mRNAs had more foci formation than Chim2 and Chim3 promoted mRNAs (p<0.05). The STRE alone promoted mRNAs had more foci formation than STRE-HSE promoted promoters (p<0.01). A two-tailed, two-sample unequal variance t-test was performed to determine p-values. d, Protein expression directed by the different promoters was measured by Western blotting using a GFP antibody that recognizes CFP. Protein levels were measured after 30 minutes of glucose starvation and the fold change was calculated relative to measurements in glucose-rich medium. MS2-CP-GFP(3x) driven by the MYO2 promoter was used as a loading control for the Western blotting. Protein fold change values are mean ±s.e.m. performed on five independent biological replicates for the chimeric promoters and seven independent biological replicates for the synthetic promoters. The levels of proteins produced from Chim2, Chim3 and STRE+HSE driven mRNAs (red bars) were significantly increased upon glucose starvation versus growth in glucose-rich medium (p<0.05). A one-tailed, paired t-test was used to determine p-values. Fold change in mRNA levels after 15 minutes of glucose starvation versus growth in glucose-rich medium, measured by qPCR using CFP primers and ACT1 levels to normalize expression. mRNA fold change values are mean ±s.e.m. performed on three independent biological replicates. e, mRNAs actively transcribed during log-phase, such as PDC1 and PGK1, localize to P bodies during glucose starvation. mRNAs activated by Hsf1 through HSE elements, including HSP30 and HSP26, remain diffusely localized during glucose starvation and have high levels of protein production. mRNAs like GLC3 and HXK1 that are upregulated by STREs in a manner independent of Hsf1 localize to P bodies and stress granules and are poorly translated.
Although our ability to assess whether Hsf1 is necessary for diffuse localization was precluded by the inviability of the S. cerevisiae HSF1 deletion strain14, we can infer the role of Hsf1 by examining the localization and protein production of mRNAs produced from constructs containing different combinations of STREs and HSEs. (Fig. 4b, schematic and Extended Data Fig. 8). CFP-MS2 expressed under the control of a synthetic promoter containing only STREs forms many foci during glucose limitation (Fig. 4b, bottom panel and 4c, right; Extended Data Fig. 6b). The addition of three HSEs to this synthetic STRE promoter was sufficient to switch the mRNA localization from foci to diffuse localization (Fig. 4b, bottom panel and 4c, right; Extended Data Fig. 6b). The synthetic reporter containing HSE binding sites produced more protein during glucose starvation than a synthetic promoter containing only STREs, even though the two promoters had similar levels of mRNA induction (Fig. 4d). We conclude that the HSE binding sites, likely functioning through the transcription factor Hsf1, influence mRNA localization and translation upon glucose starvation.
Our data suggests that promoter sequences and the action of select transcription factors in the nucleus can influence mRNA localization and translation upon glucose starvation (Fig. 4e). A linkage between transcriptional regulation and cytoplasmic localization may be a general adaptation during times of stress, enabling the cell to coordinately regulate the production of entire classes of proteins. Under non-stress conditions upregulation of a class of transcripts by a transcription factor would produce similar amounts of protein from each of the mRNAs, as translation would proceed at a generally high rate. Under stressful conditions when overall translation is reduced, selective translation may be required to produce proteins needed for adaptation to the new condition. In the case of glucose starvation, Hsf1 targets that encode cytoprotective proteins such as chaperones may need to be produced as soon as possible to help cope with the stress, but alternative glucose metabolism genes may be superfluous when no carbon source is present. Induction of mRNAs without a concomitant increase in protein levels for glucose metabolism genes may allow the cell to more rapidly produce proteins upon reintroduction of a carbon source. Intriguingly, the localization of HSP70 and HSP90 mRNAs in stressed yeast and mammalian cells appear to be similar – these mRNAs are largely excluded from stress granules during cellular stress in mammalian cells15,16. Previous work has shown that the promoter can influence the stability of an mRNA through co-transcriptional loading of an accessory protein to the mRNA17,18. A similar phenomenon may be operating here, where transcription factors load RNA binding proteins that direct mRNA localization, or there may be cis alterations to the mRNA such as polyA tail length or RNA methylation that influence mRNA fate. Future studies will reveal aspects of these mechanisms, as well as whether this phenomenon is conserved in higher eukaryotes.
Methods
Yeast Strains and Growth
All yeast strains are listed in Supplementary Table 2. For ribosome profiling experiments presented in Figure 1 the yeast strain BY4741 (Euroscarf) (MATa, his3Δ1, leu2Δ0, met15Δ0, ura3Δ0) was grown at 30°C in batch culture with shaking at 125 rpm in synthetic complete glucose medium (SCD) and synthetic complete -glucose (SC) medium. Yeast cells were randomly chosen by taking half the cells from a culture for glucose starvation and the other half for glucose replete conditions. There was no blinding to which group the yeast were allocated. Ribosome profiling and RNA-seq were repeated in the same growth conditions using the yeast strain EY0690 (W303 MATa trp1-1 leu2-3 ura3-1 his3-11 can1-100) and similar results were obtained (Extended Data Fig. 2, Supplementary Table 1).
The yeast strain background W303 (EY0690) was used for all microscopy experiments. To image mRNAs the 12x MS2 sequence was excised from the MS2L construct20 and placed in the LEU2-marked integration vector pRS305. The ADH1 3′ UTR was cloned downstream of this sequence and gene specific sequences were cloned upstream of the MS2 sequence by Gibson assembly21. Integration was performed by cutting the resulting plasmids in the LEU2 gene with EcoRV and transforming the linear fragment into a yeast strain (EY2888) containing MS2-CP-GFP(3x)20 under the control of the MYO2 promoter integrated at the HIS3 locus. Dcp2 was tagged with RFP, and Pab1 with mTurquoise2 by C-terminal chromosomal integration of polymerase chain reaction (PCR) products, including auxotrophic or antibiotic makers flanked by 40 bp of sequence found directly upstream and downstream from the gene, followed by selection on the appropriate medium22. TETO7-lacZ-MS2-ADH1_3′ UTR was integrated into the EY2888 strain at the LEU2 locus with the addition of the rtTA activator under the control of the ERV14 promoter (EB1674). Doxycycline was added to a final concentration of 20 μg/mL either 15 min before glucose starvation or at the time of glucose starvation. A yeast codon-optimized CFP reporter (SCFP3A)23 was used to generate a uniform ORF for localization constructs driven by various promoters (Figs. 3, 4). To determine Hsf1 responsiveness, azetidine-2-carboxylate (AZC) was added to a final concentration of 10 mM to cells at ~0.2 OD600 and cells were incubated with shaking for 2 hrs.
Chimeric HSP26 and GLC3 promoters shown in Fig. 4a were made by fusion PCR of the indicated promoter regions (Supplementary Table 2), and placed upstream of CFP-MS2-ADH1_3′ UTR. Synthetic reporters were created by Gibson assembly of a 4x STRE with or without a 3xHSE element followed by an attenuated CYC1 promoter24 upstream of CFP-MS2-ADH1_3′ UTR (Extended Data Fig. 8). A Mig1-binding site25 (AAAAATGCGGGG) was added 5′ of the STREs to reduce leaky expression in glucose-rich conditions.
Ribosome Profiling and RNA-sequencing
Ribosome profiling and RNA-Seq were performed as described4. We performed two ribosome profiling experiments for BY4741 and two for EY0690. Yeast were grown in SCD at 30°C to an OD600 between 0.3 and 0.4, cells were collected by filtration, resuspended in SC medium lacking glucose, and grown for 15 min. Cycloheximide was added to a final concentration of 100 μg/mL for 1 min with continued shaking at 30°C and cells were then harvested. Cells were pulverized in a Retsch PM100 ball mill and the extracts were digested with RNAse I followed by the isolation of ribosome protected fragments either by purifying RNA from the monosome fraction of a sucrose gradient (BY4741 two samples), or by using a sucrose cushion (EY0690 two samples). Isolated 28 mers were polyadenylated and reverse transcription was performed using either OTi225 (BY4741) or OTi9pA (EY0690) (Supplementary Table 3). OTi9pA allowed samples to be multiplexed at subsequent steps. RNA-seq was performed on RNA depleted of rRNA using a yeast Ribo-Zero kit (Epicentre) (EY0690 – 1 experiment), total RNA (BY4741, EY0690 – 1 experiment for each) or polyA selected RNA using oligo-dT Dynabeads (Invitrogen) (BY4741 and EY0690 – 2 independent samples for each strain). Ribosomal RNA-depleted and total RNA for EY0690 had a high Pearson correlation between samples (r > 0.9), so these sequences were combined to give higher sequence coverage for the mRNA sample. BY4741 samples were sequenced on an Illumina Genome Analyzer II, while EY0690 samples were multiplexed and sequenced on an Illumina HiSeq (both at the FAS Center for Systems Biology Core Facility). All raw sequencing data is available at NCBI GEO, with accession number GSE56622.
To analyze the ribosome profiling and RNA-seq sequences, reads were trimmed of the 3′run of polyAs and then aligned against S. cerevisiae ribosomal RNA sequences using Bowtie sequence aligner26. Reads that did not align to ribosomal RNA sequences were aligned against the full S. cerevisiae genome. Reads that had an unambiguous alignment with less than three mismatches were used in the measurements of ribosome occupancy and mRNA levels. Since there were many reads mapping to the initiation region (−16 bp to +20 bp in relation to the AUG; Extended Data Fig. 1b) the ribosome occupancy for each gene was calculated by taking the total ribosome reads (normalized to total aligned reads – reads per million reads (RPM)) in the downstream region (+20 bp from the AUG to the end of the ORF; Extended Data Fig. 1b) and dividing this by the number of mRNA reads (RPM) in this same region. The ribosome occupancy along the mRNA (Fig. 1b) was calculated by dividing the ribosome read counts at each base pair along the gene by the average mRNA reads per base pair for each gene. Because there is a large reduction in global translation during glucose limitation, our measurements of ribosome occupancy in this condition are almost certainly overestimates. This arises because even when there is a large reduction in ribosomes associated with mRNAs, as seen by the collapse in the polysome profile during glucose starvation (Extended Data Fig. 1), we isolate and sequence the same number of ribosome-protected sequence reads. Although this has the effect of increasing ribosome occupancy values for all genes, relative differences between genes remain (e.g. red - Hsp genes versus blue – glucose metabolism genes).
To reduce sampling error a cut off of 30 or more reads in the downstream region was set for RNA-seq during glucose starvation. Since we focused on mRNAs upregulated in glucose limitation and many of these genes are poorly expressed in glucose-rich conditions, we set a cut-off of four or more reads for RNA-seq during glucose-rich conditions, as well as four or more reads for ribosome profiling in both glucose-rich and glucose starvation conditions. Even with such a low number of reads as a cut-off, there was a large overlap between ribosome profiling and non-polyA selected RNA-seq experiments performed in BY4741 and EY0690 at both the individual gene level and the gene ontology class level for the different categories of upregulated mRNAs (Extended Data Table 1 and Supplementary Table 1). At the individual gene level 21 of the 33 upregulated higher ribosome occupancy genes classified from BY4741 were in the same category for the EY0690 data, while only 2 genes switched to upregulated lower ribosome occupancy (Supplementary Table 1). For lower ribosome occupancy mRNAs 13 of the 19 genes classified as such in BY4741 were also found in the same category for the EY0690 data, while only two genes switched to the upregulated higher ribosome occupancy category (Supplementary Table 1). Extended Data Fig. 2 shows the data from all 4 ribosome profiling data sets together with the six mRNA preparations that include both polyA selected and non-polyA selected mRNA.
Polysome Analysis
Sucrose density gradients (10%–50%) were prepared and measured using a BioComp Gradient Station (BioComp Instruments) according to the manufacturer’s instructions. Sucrose solutions were prepared in 20 mM Tris pH 8.0, 140 mM KCl, 5 mM MgCl2, 0.5 mM DTT buffer, 50 U/mL Superasin (Ambion). Samples were loaded onto gradients and spun for 3 hr at 35,000 rpm, 4°C in a SW41 rotor (Beckman Coulter). Samples were run through a Biocomp Gradient Station and the 260 nm absorbance was read using a BIO-RAD Econo UV Monitor.
Microscopy
Cells were grown to an OD600 between 0.3 and 0.4 in SCD 30°C, washed and resuspended in SC. After 15 min cells were concentrated and imaged using a Zeiss Axiovert 200M inverted microscope with Cascade 512 cooled charge-coupled (CCD) camera (Photometrics) with an oil-immersion 63× objective. A custom Matlab script was written to measure co-localization of GFP/mRNA foci and RFP/P body foci. In brief, a threshold mask was set for individual cells using the Otsu Thresholding Filter27 and subsequently used to create a binary image. The centroid of each focus was then obtained using the regionprops command. If no mRNA foci were found, the cell was counted as without foci. If there were one or more mRNA foci, the minimum distance between each mRNA focus and every P body foci in the cell was calculated. If this distance was less than or equal to 1.5 pixels, the focus was considered to be co-localized – otherwise it was considered non-overlapping and distinct. p-values were calculated using a two-tailed, two-sample unequal variance t-test to account for possible differences in variance which may arise from unrelated data28. For stress granule visualization cells were imaged after 30 minutes of glucose starvation to observe clear stress granule formation.
Quantitative real-time PCR (qPCR)
RNA was extracted using the MasterPure Yeast RNA purification kit (Epicenter). cDNA was prepared using Superscript III reverse transcriptase (Invitrogen) with a combination of oligodT primers and random hexamers according to the manufacturer’s instructions. mRNA abundance was determined by quantitative PCR (qPCR) using a SYBR Green PCR mix (Applied Biosystems) and primers specific for each transcript. mRNA levels were normalized to ACT1 abundance and fold change in glucose-limited versus glucose-rich conditions, was calculated.
Chromatin Immunoprecipiation (ChIP)
ChIP-qPCR experiments were conducted as previously described29 with the following differences noted. Rpb3-TAP (tandem affinity purification)19 was used to determine RNA polymerase II occupancy in glucose-rich conditions and after 15 minutes of glucose starvation. Rpb3-TAP was immunoprecitated using IgG Sepharose FastFlow (GE Healthcare). Input and immunoprecipitated samples were assayed by qPCR to access the extent of RNA polymerase II occupancy in different genomic regions. Primer pairs against the indicated ORFs as well as an untranscribed telomeric region (Supplementary Table 2) were used to determine PCR efficiencies during glucose-rich conditions and glucose starvation.
Western Blotting
Strains were grown in the appropriate medium and then centrifuged at 4000xg for 2 minutes. Pellets were resuspended in Buffer A (0.5% Triton X-100, 150mM NaCl, 1mM EDTA, 50mM HEPES pH 7.4) followed by lysis with glass beads at 4°C and centrifugation at 5000xg for 5 minutes. The crude extract was then resolved by SDS-PAGE and a rabbit polyclonal antibody against calmodulin-binding peptide (GenScript - #A00635–40) was used to detect TAP-tagged proteins. A mouse anti-alpha-tubulin antibody (Developmental Studies Hybridoma Bank - #12G10) was used as a loading control. CFP and GFP were detected using a rabbit polyclonal antibody against GFP (Invitrogen- #A-6455), with the pMYO2 driven MS2-CP-3xGFP used as a loading control. To determine if there was an increase in protein levels upon glucose starvation versus glucose replete conditions, a one-tailed paired t-test was used. The Shapiro-Wilk’s statistic was computed to test for normality from these small sample sizes of 4–7 replicates. These sample sizes are commonly used to measure differences in protein levels.
5′RACE
The transcriptional start site was determined for various promoters using the ExactSTART 5′RACE Kit (Epicentre). An adaptor oligoribonucleotide (5′ adaptor) was ligated to the 5′end of the RNA, and cDNA was synthesized using an oligo(dT) primer that contained another adaptor sequence (3′ adaptor). The 5′region of the mRNA was amplified by PCR using a 5′adaptor primer, and a CFP-specific primer (Supplementary Table 2). The PCR products were cloned into the pCR4-TOPO vector (Invitrogen) and were sequenced (Eton).
Extended Data
Extended Data Figure 1. Glucose starvation causes a reduction in overall translation along with gene specific changes in ribosome and mRNA read density.
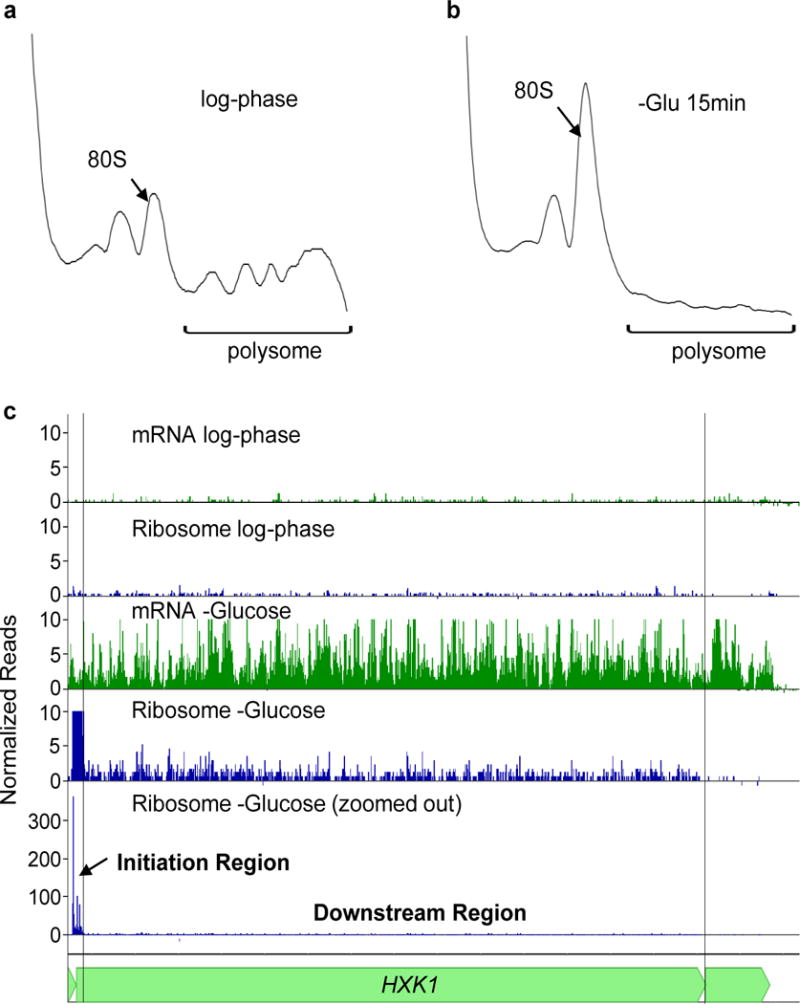
a, Sedimentation profile of log-phase cells of strain BY4741 grown in SCD medium. The arrow marks the sedimentation of the 80S ribosome. b, Sedimentation profile of cells of strain BY4741 grown in SCD medium and then transferred to the same medium lacking glucose for 15 min. c, Ribosome and mRNA read density across the HXK1 mRNA during log-phase growth in glucose-rich conditions and after 15 min of glucose starvation. For the tracks labeled “mRNA”, shown is the number of mRNA reads, normalized to total number of sequence reads for that sample (reads per million reads – RPM). For the tracks labeled “Ribosome”, shown is the number of ribosome reads, normalized to the total number of reads for that sample (RPM). The initiation region was defined as a 36 bp region that contains 16 bp upstream of the AUG and 20 bp downstream. The downstream region is defined as the rest of the open reading frame.
Extended Data Figure 2. Differences in ribosome occupancy of transcriptionally upregulated mRNAs upon glucose starvation are reproducible and independent of the mRNA isolation method.
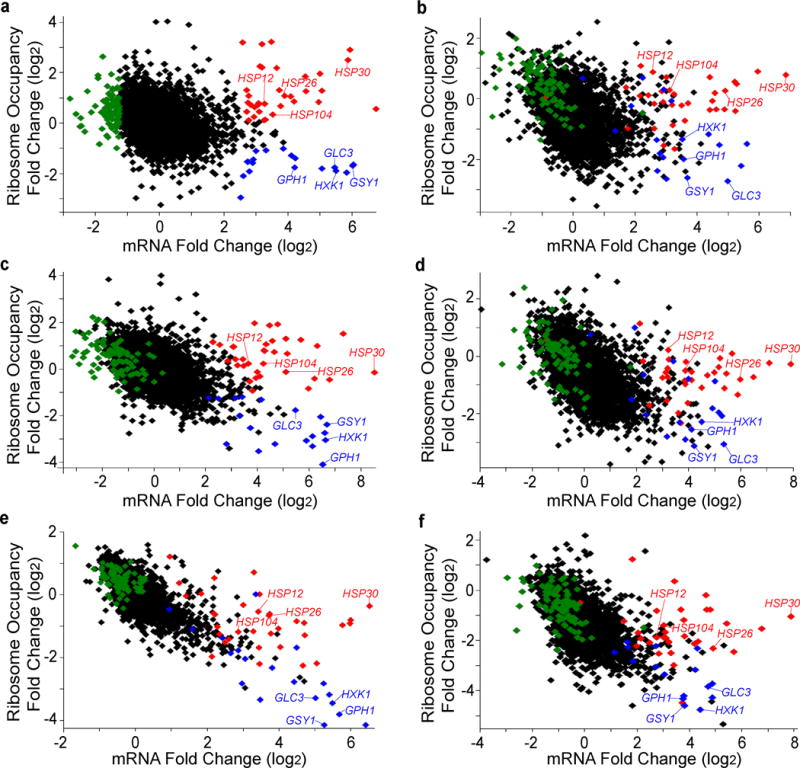
Ribosome profiling was performed on strains BY4741 and EY690 grown in glucose-rich and and glucose-starved conditions. Fold change in ribosome occupancy versus fold change mRNA levels, 15 minutes after cells are transferred to medium lacking glucose. Genes are represented by individual symbols on the plot. Ribosome occupancy is calculated for the coding region of each gene by dividing the total number of ribosome sequence counts in an open reading frame (normalized to total aligned reads – reads per million reads - RPM) by the number of mRNA sequence counts (RPM) in the same sequence. The colored symbols in each panel show the gene classes defined from BY4741 ribosome profiling, non-polyA selected mRNA replicate 1 in panel (a) (and Fig. 1a). Red symbols indicate genes that have upregulated mRNA levels (>2.5) and higher ribosome occupancy (>0.09), blue symbols denote genes that have upregulated mRNA levels (>2.5) with lower ribosome occupancy (<−1.0) and green symbols indicate genes that have decreased mRNA levels (<−1.25) in glucose limitation. While downregulated mRNAs have decreased mRNA levels, many of them have increased ribosome occupancy and are enriched for ribosome biogenesis mRNAs (26 of 84; FDR-adjusted p=9.9E−4) by gene ontology analysis. Similarly it has previously been seen that ribosome biogenesis mRNAs have decreased mRNA levels with increased polysome association during early glucose starvation3. Black symbols represent all other genes in the genome for which measurements were obtained. The upregulated higher-ribosome occupancy genes (HSP30, HSP26, HSP12, HSP104) and the upregulated lower-ribosome occupancy genes (GLC3, GSY1, GPH1, HXK1) are labeled in each panel. a, BY4741 non-polyA selected RNA ribosome profiling replicate 1 (same as Fig. 1a). b, EY0690 non-polyA selected RNA, ribosome profiling replicate 1. c, BY4741 polyA selected RNA, ribosome profiling replicate 1. d, EY0690 polyA selected RNA, ribosome profiling replicate 1. e, BY4741 polyA selected RNA, ribosome profiling replicate 2. f, EY0690 polyA selected RNA, ribosome profiling replicate 2.
Extended Data Figure 3. Upregulated mRNAs have increased RNA Polymerase II occupancy upon glucose starvation.
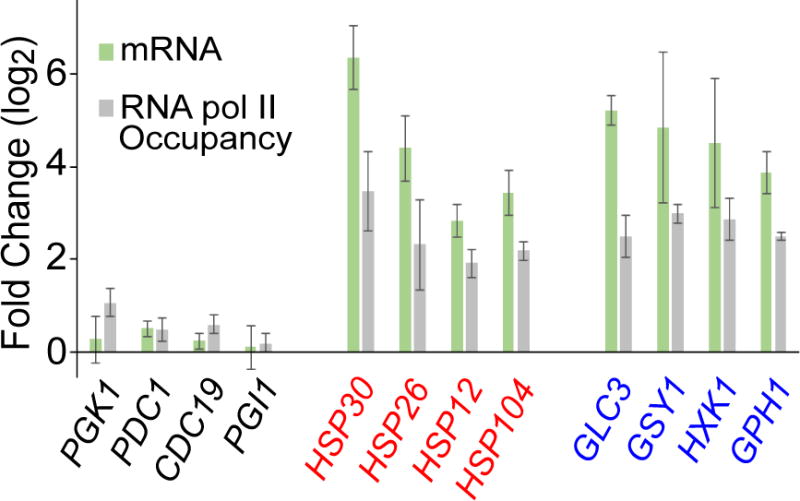
mRNA levels for the indicated genes were measured by RNA-sequencing after 15 minutes of glucose starvation and were divided by levels in glucose-rich medium to obtain fold change values. Measurements were made on independent biological samples (BY4741 and EY0690) and the values reported reflect the mean ±s.e.m. RNA polymerase II occupancy was measured after 15 minutes of glucose starvation and then divided by levels in glucose-rich medium to obtain the fold change. RNA polymerase II occupancy was measured on three independent biological replicates of BY4741 and mean values are reported ±s.e.m.
Extended Data Figure 4. Formation of mRNA foci is dependent on MS2 binding sites and does not occur in cells growing exponentially in medium containing glucose.
In the absence of mRNA containing MS2 binding sites, MS2-GFP remains diffusely localized during glucose starvation (first two rows, first column). When glucose is present in the medium, MS2-mRNAs and the P body marker Dcp2-RFP are diffusely localized during log-phase growth.
Extended Data Figure 5. Timing of lacZ-MS2 induction relative to glucose starvation affects mRNA localization while timing or level of induction during glucose starvation has no effect.
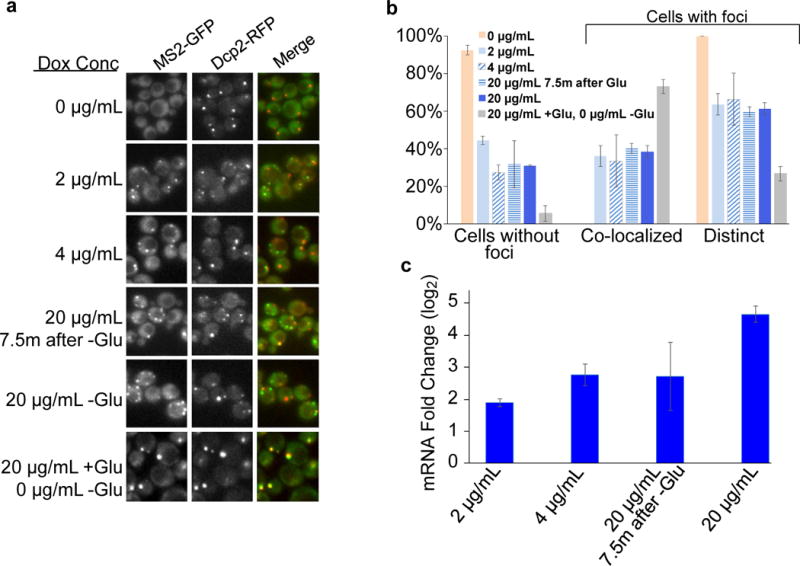
Expression of lacZ-MS2 was either uninduced (0 μg/mL), induced to different levels during glucose starvation with doxycycline (2 μg/mL, 4 μg/mL, 20 μg/mL), induced at different times during glucose starvation (7.5 minutes of glucose starvation with 0 μg/mL, then 20 μg/mL was added for the final 7.5 minutes of glucose starvation) or induced prior to glucose starvation (20 μg/mL during log phase, 0 μg/mL during glucose starvation) in the EY2897 strain. a, Localization of the mRNA was visualized using MS2-GFP after 15 min of glucose starvation for all strains. Dcp2-RFP was used to visualize P body localization. lacZ-MS2 expression prior to glucose starvation causes high colocalization with P bodies, while mRNA induction during glucose starvation causes the formation of mRNA foci that colocalize with and are distinct from P bodies. b, Quantification of localization data in (a). Values are means ± standard error of the mean measured. 0 μg/mL, 2 μg/mL, 20 μg/mL -Glu and 20 μg/mL +Glu, 0 μg/mL –Glu were performed in quadruplicate (two biological replicates with two technical replicates per sample). 4 μg/mL and 20 μg/mL 7.5m after -Glu were performed in triplicate on technical replicates. c, Quantification of lacZ-MS2 mRNA levels 15 minutes after glucose starvation. Fold change was calculated versus the uninduced sample (0 μg/mL) and normalized to ACT1 abundance performed on three independent biological replicates.
Extended Data Figure 6. Promoter sequences determine mRNA localization upon glucose starvation.
a, The promoter and 5′ UTR of the indicated genes were fused upstream of CFP-MS2 in plasmid pRS305 and integrated into EY0690. mRNA localization was measured after 15 min of glucose starvation. Values are means ± standard error of the mean (s.e.m.) from Fig. 3c measured on a minimum of 30 cells in quadruplicate (two biological replicates with two technical replicates per sample). b, Localization of CFP-MS2 mRNAs driven by chimeric HSP26/GLC3 promoters or synthetic STRE and STRE+HSE promoters upon glucose starvation. Values are means ± s.e.m. from Fig. 4b measured on a minimum of 25 cells in quadruplicate (two biological replicates with two technical replicates per sample).
Extended Data Figure 7. mRNA levels of CFP-MS2 in different conditions controlled by varied promoter-UTR combinations.
a, Relative levels of CFP-MS2 mRNA, under the control of the indicated promoter and UTR regions, 15 minutes after glucose starvation as measured by qPCR. Values are normalized to ACT1 abundance and reported as the mean ± standard error of the mean relative to HSP26prUTR-CFP levels, performed on three independent biological replicates. b, Fold-change in CFP-MS2 mRNA abundance after 15 minutes of glucose starvation (-Glu), or after treatment with 10 mM AZC for 2 hours (+AZC), relative to levels in log-phase growth in glucose-rich medium. CFP-MS2 mRNA was measured by qRT-PCR and was normalized to ACT1 levels. Values are mean ±standard error of the mean performed on three independent biological replicates.
Extended Data Figure 8. Synthetic STRE ± HSE promoter sequences.
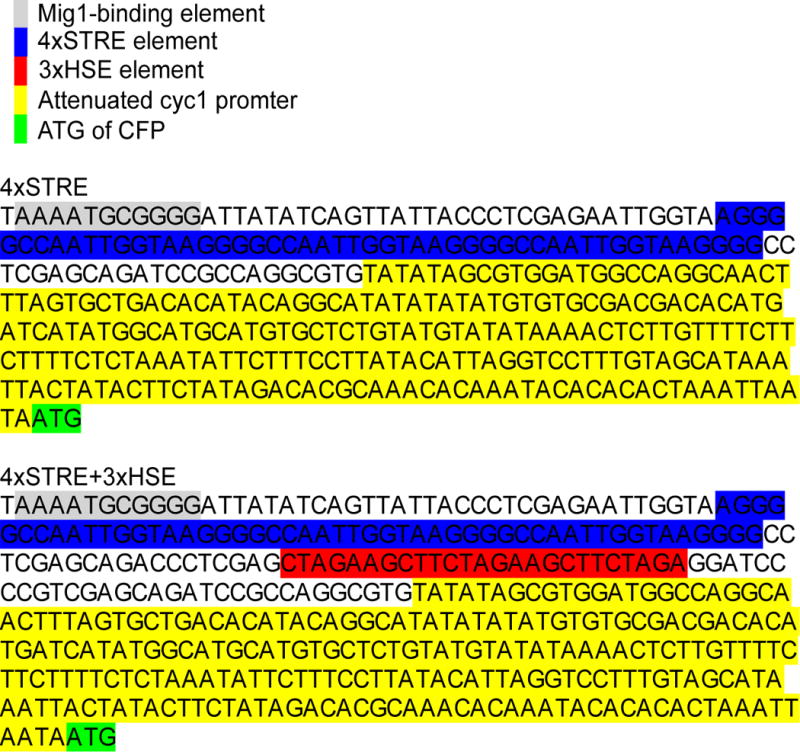
The STRE ± HSE elements were placed upstream of an attenuated CYC1 promoter17 driving expression of CFP-MS2. A Mig1-binding element was added upstream of the promoter elements to reduce expression pre-starvation. The Mig1-binding element is in grey, the 4x STRE is labeled in blue, the 3x HSE is labeled in red and the CYC1 promoter is labeled in yellow.
Extended Data Table 1. Gene ontology analysis of classes of genes differentially regulated in glucose starvation.
DAVID analysis software was used to find Gene Ontology (GO) terms significantly enriched (FDR-adjusted p-value<1.0E-2) in differentially regulated groups of genes from non-polyA selected RNA-Seq data and ribosome profiling replicate 1 data in each strain (mRNA upregulated, higher ribosome occupancy (red); mRNA upregulated, lower ribosome occupancy (blue); mRNA downregulated (green)). GO terms that were common between BY4741 and EY0690 are in bold.
| BY4741
|
EY0690
|
||||
|---|---|---|---|---|---|
| Upregulated Higher-Ribo n=26 | Genes | p-value | Upregulated Higher-Ribo n=36 | Genes | p-value |
| Response to temperature stimulus | 14 | 1.3E-9 | Response to abiotic stimulus | 21 | 9.1E-12 |
| Response to abiotic stimulus | 16 | 2.4E-9 | Response to temperature stimulus | 18 | 1.7E-11 |
| Cellular response to heat | 11 | 1.4E-6 | Cellular response to heat | 15 | 9.0E-9 |
| Vacuolar protein catabolic process | 8 | 1.7E-3 | Cellular response to stress | 16 | 3.4E-3 |
|
Upregulated Lower-Ribo n=18
|
Upregulated Lower-Ribo n=37
|
||||
| Glucose metabolic process | 7 | 7.8E-4 | Vacuolar protein catabolic process | 10 | 1.4E-4 |
| Vacuolar protein catabolic process | 7 | 2.0E-3 | Energy reserve metabolic process | 7 | 5.9E-4 |
| Hexose metabolic process | 7 | 2.5E-3 | Glycogen metabolic process | 6 | 2.6E-3 |
| Glucose metabolic process | 8 | 8.2E-3 | |||
|
Downregulated n=84
|
Downregulated n=83
|
||||
| RNA modification | 19 | 7.6E-10 | Ribosome biogenesis | 33 | 1.6E-13 |
| ncRNA metabolic process | 25 | 2.3E-5 | Ribonucleoprotein complex biogenesis | 33 | 8.4E-12 |
| rRNA processing | 19 | 9.0E-5 | rRNA processing | 24 | 3.9E-9 |
| Ribonucleoprotein complex biogenesis | 24 | 1.3E-4 | maturation of SSU-rRNA | 16 | 6.7E-9 |
| Ribosome biogenesis | 26 | 9.9E-4 | ncRNA metabolic process | 27 | 5.9E-7 |
| RNA processing | 8 | 1.1E-3 | RNA processing | 28 | 4.3E-5 |
| Methionine biosynthetic process | 8 | 1.1E-3 | RNA modification | 13 | 7.3E-4 |
| Sulfur amino acid biosynthetic process | 8 | 3.2E-3 | maturation of 5.8S rRNA | 10 | 2.5E-3 |
Extended Data Table 2. Transcription start sites of mRNAs produced from promoters driving differential localization and protein production.
5′RACE was used to determine the transcriptional start sites of the CFP-MS2 mRNAs driven by the indicated promoter-5′UTR combination.
|
HSP26prUTR
|
| AAAGCAAACAAACAAACTAAACAAATTAACATG |
| ATTAAAACAGGTATCCAAAAAAGCAAACAAACAAACTAAACAAATTAACATG |
| ATTAAAACAGGTATCCAAAAAAGCAAACAAACAAACTAAACAAATTAACATG |
| ATTAAAACAGGTATCCAAAAAAGCAAACAAACAAACTAAACAAATTAACATG |
| ATATCAGATCTCTATTAAAACAGGTATCCAAAAAAGCAAACAAACAAACTAAACAAATTAACATG |
|
GLC3pr-HSP26UTR |
| TAAAACAGGTATCCAAAAAAGCAAACAAACAAACTAAACAAATTAACATG |
| ATTAAAACAGGTATCCAAAAAAGCAAACAAACAAACTAAACAAATTAACATG |
| ATTAAAACAGGTATCCAAAAAAGCAAACAAACAAACTAAACAAATTAACATG |
| GATCTCTATTAAAACAGGTATCCAAAAAAGCAAACAAACAAACTAAACAAATTAACATG |
|
HXK1pr-HSP26UTR |
| ATTAAAACAGGTATCCAAAAAAGCAAACAAACAAACTAAACAAATTAACATG |
| ATTAAAACAGGTATCCAAAAAAGCAAACAAACAAACTAAACAAATTAACATG |
| ATTAAAACAGGTATCCAAAAAAGCAAACAAACAAACTAAACAAATTAACATG |
| TATCAGATCTCTATTAAAACAGGTATCCAAAAAAGCAAACAAACAAACTAAACAAATTAACATG |
|
GLC3pr-GLC3UTR |
| AAGTATAAAGAACCGTCAAGAATAAAATG |
| AAGTATAAAGAACCGTCAAGAATAAAATG |
| AAGTATAAAGAACCGTCAAGAATAAAATG |
| AAACCAAGTATAAAGAACCGTCAAGAATAAAATG |
| AAACCAAGTATAAAGAACCGTCAAGAATAAAATG |
|
HSP26UTR-GLC3UTR |
| CAAACCAAGTATAAAGAACCGTCAAGAATAAAATG |
| ACAAACCAAGTATAAAGAACCGTCAAGAATAAAATG |
| GATAAACAAACCAAGTATAAAGAACCGTCAAGAATAAAATG |
| ACCGATAAACAAACCAAGTATAAAGAACCGTCAAGAATAAAATG |
| ACCGATAAACAAACCAAGTATAAAGAACCGTCAAGAATAAAATG |
|
STRE |
| ACGCAAACACAAATACACACACTAAATTAATAATG |
| ATAGACACGCAAACACAAATACACACACTAAATTAATAATG |
| ATAGACACGCAAACACAAATACACACACTAAATTAATAATG |
| ATACTTCTATAGACACGCAAACACAAATACACACACTAAATTAATAATG |
| ATACTTCTATAGACACGCAAACACAAATACACACACTAAATTAATAATG |
| GTAGCATAAATTACTATACTTGCATAGACACGCAAACACAAATACACACACTAAATTAATAATG |
|
STRE+HSE |
| AAATTAATAATG |
| AAACACAAATACACACACTAAATTAATAATG |
| ATACTTCTATAGACACGCAAACACAAATACACACACTAAATTAATAATG |
| ATACTTCTATAGACACGCAAACACAAATACACACACTAAATTAATAATG |
| ATACTTATATAGACACGCAAACACAAATACACACACTAAATTAATAATG |
| ATAAATTACTATACTTCTATAGACACGCAAACACAGATACACACACTAAATTAATAATG |
Supplementary Material
Acknowledgments
We thank A. Subramaniam, S. Mukherji, V. Denic, B. Stern, and M. Waldram for feedback on the paper; members of the O’Shea, Denic, and Calarco laboratories for helpful discussions; and C. Daly at the FAS center for Systems Biology for sequencing assistance. This research was supported by the American Cancer Society and the New England Division Funding A Cure initiative (B.M.Z.) and the Howard Hughes Medical Institute (E.K.O.)
Footnotes
Author Contributions B.M.Z. collected and analyzed the data. B.M.Z. and E.K.O. designed experiments and wrote the manuscript.
References
- 1.Simpson CE, Ashe MP. Adaptation to stress in yeast: to translate or not? Biochem Soc Trans. 2012;40:794–9. doi: 10.1042/BST20120078. [DOI] [PubMed] [Google Scholar]
- 2.Ashe MP, Long SK De, Sachs AB. Glucose Depletion Rapidly Inhibits Translation Initiation in Yeast. Mol Biol Cell. 2000;11:833–848. doi: 10.1091/mbc.11.3.833. [DOI] [PMC free article] [PubMed] [Google Scholar]
- 3.Arribere JA, Doudna JA, Gilbert WV. Reconsidering Movement of Eukaryotic mRNAs between Polysomes and P Bodies. Mol Cell. 2011;44:745–758. doi: 10.1016/j.molcel.2011.09.019. [DOI] [PMC free article] [PubMed] [Google Scholar]
- 4.Ingolia NT, Ghaemmaghami S, Newman JRS, Weissman JS. Genome-wide analysis in vivo of translation with nucleotide resolution using ribosome profiling. Science. 2009;324:218–23. doi: 10.1126/science.1168978. [DOI] [PMC free article] [PubMed] [Google Scholar]
- 5.Decker CJ, Parker R. P-bodies and stress granules: possible roles in the control of translation and mRNA degradation. Cold Spring Harb Perspect Biol. 2012;4:a012286. doi: 10.1101/cshperspect.a012286. [DOI] [PMC free article] [PubMed] [Google Scholar]
- 6.Brengues M, Teixeira D, Parker R. Movement of eukaryotic mRNAs between polysomes and cytoplasmic processing bodies. Science. 2005;310:486–9. doi: 10.1126/science.1115791. [DOI] [PMC free article] [PubMed] [Google Scholar]
- 7.Teixeira D, Sheth U, Valencia-Sanchez Ma, Brengues M, Parker R. Processing bodies require RNA for assembly and contain nontranslating mRNAs. RNA. 2005;11:371–82. doi: 10.1261/rna.7258505. [DOI] [PMC free article] [PubMed] [Google Scholar]
- 8.Buchan JR, Parker R. Eukaryotic stress granules: the ins and outs of translation. Mol Cell. 2009;36:932–41. doi: 10.1016/j.molcel.2009.11.020. [DOI] [PMC free article] [PubMed] [Google Scholar]
- 9.Hoyle NP, Castelli LM, Campbell SG, Holmes LEa, Ashe MP. Stress-dependent relocalization of translationally primed mRNPs to cytoplasmic granules that are kinetically and spatially distinct from P-bodies. J Cell Biol. 2007;179:65–74. doi: 10.1083/jcb.200707010. [DOI] [PMC free article] [PubMed] [Google Scholar]
- 10.Martínez-Pastor MT, et al. The Saccharomyces cerevisiae zinc finger proteins Msn2p and Msn4p are required for transcriptional induction through the stress response element (STRE) EMBO J. 1996;15:2227–35. [PMC free article] [PubMed] [Google Scholar]
- 11.Hahn JS, Thiele DJ. Activation of the Saccharomyces cerevisiae heat shock transcription factor under glucose starvation conditions by Snf1 protein kinase. J Biol Chem. 2004;279:5169–76. doi: 10.1074/jbc.M311005200. [DOI] [PubMed] [Google Scholar]
- 12.Susek RE, Lindquist S. Transcriptional derepression of the Saccharomyces cerevisiae HSP26 gene during heat shock. Mol Cell Biol. 1990;10:6362–73. doi: 10.1128/mcb.10.12.6362. [DOI] [PMC free article] [PubMed] [Google Scholar]
- 13.Trotter EW, et al. Misfolded proteins are competent to mediate a subset of the responses to heat shock in Saccharomyces cerevisiae. J Biol Chem. 2002;277:44817–25. doi: 10.1074/jbc.M204686200. [DOI] [PubMed] [Google Scholar]
- 14.Wiederrecht G, Seto D, Parker CS. Isolation of the gene encoding the S. cerevisiae heat shock transcription factor. Cell. 1988;54:841–53. doi: 10.1016/s0092-8674(88)91197-x. [DOI] [PubMed] [Google Scholar]
- 15.Kedersha N, Anderson P. Stress granules: sites of mRNA triage that regulate mRNA stability Stress granules (SGs): a historical perspective. 2002:963–969. doi: 10.1042/bst0300963. [DOI] [PubMed] [Google Scholar]
- 16.Stöhr N, et al. ZBP1 regulates mRNA stability during cellular stress. J Cell Biol. 2006;175:527–34. doi: 10.1083/jcb.200608071. [DOI] [PMC free article] [PubMed] [Google Scholar]
- 17.Bregman A, et al. Promoter Elements Regulate Cytoplasmic mRNA Decay. Cell. 2011;147:1473–1483. doi: 10.1016/j.cell.2011.12.005. [DOI] [PubMed] [Google Scholar]
- 18.Trcek T, Larson DR, Moldón A, Query CC, Singer RH. Single-Molecule mRNA Decay Measurements Reveal Promoter- Regulated mRNA Stability in Yeast. Cell. 2011;147:1484–1497. doi: 10.1016/j.cell.2011.11.051. [DOI] [PMC free article] [PubMed] [Google Scholar]
- 19.Ghaemmaghami S, et al. Global analysis of protein expression in yeast. Nature. 2003;425:737–41. doi: 10.1038/nature02046. [DOI] [PubMed] [Google Scholar]
- 20.Haim-Vilmovsky L, Gerst JE. m-TAG: a PCR-based genomic integration method to visualize the localization of specific endogenous mRNAs in vivo in yeast. Nat Protoc. 2009;4:1274–84. doi: 10.1038/nprot.2009.115. [DOI] [PubMed] [Google Scholar]
- 21.Gibson DG, et al. Enzymatic assembly of DNA molecules up to several hundred kilobases. 2009;6:12–16. doi: 10.1038/nmeth.1318. [DOI] [PubMed] [Google Scholar]
- 22.Longtine MS, Mckenzie A, Iii, D DJ. Additional modules for versatile and economical PCR-based gene deletion and modification in Saccharomyces cerevisiae. Yeast. 1998;4:953–961. doi: 10.1002/(SICI)1097-0061(199807)14:10<953::AID-YEA293>3.0.CO;2-U. [DOI] [PubMed] [Google Scholar]
- 23.Hansen AS, O’Shea EK. Promoter decoding of transcription factor dynamics involves a trade-off between noise and control of gene expression. Mol Syst Biol. 2013;9:704. doi: 10.1038/msb.2013.56. [DOI] [PMC free article] [PubMed] [Google Scholar]
- 24.Brandman O, et al. A ribosome-bound quality control complex triggers degradation of nascent peptides and signals translation stress. Cell. 2012;151:1042–54. doi: 10.1016/j.cell.2012.10.044. [DOI] [PMC free article] [PubMed] [Google Scholar]
- 25.Lutfiyya LL, et al. Characterization of three related glucose repressors and genes they regulate in Saccharomyces cerevisiae. Genetics. 1998;150:1377–91. doi: 10.1093/genetics/150.4.1377. [DOI] [PMC free article] [PubMed] [Google Scholar]
- 26.Langmead B, Trapnell C, Pop M, Salzberg SL. Ultrafast and memory-efficient alignment of short DNA sequences to the human genome. Genome Biol. 2009;10:R25. doi: 10.1186/gb-2009-10-3-r25. [DOI] [PMC free article] [PubMed] [Google Scholar]
- 27.Otsu NA. Threshold Selection Method from Gray-Level Histograms. IEEE Trans Sys, Man, Cyber. 1979;9:62–66. [Google Scholar]
- 28.Ruxton GD. The unequal variance t-test is an underused alternative to Student’s t-test and the Mann-Whitney U test. Behav Ecol. 2006;17:688–690. [Google Scholar]
- 29.Cook KE, O’Shea EK. Hog1 controls global reallocation of RNA Pol II upon osmotic shock in Saccharomyces cerevisiae. G3 (Bethesda) 2012;2:1129–36. doi: 10.1534/g3.112.003251. [DOI] [PMC free article] [PubMed] [Google Scholar]
Associated Data
This section collects any data citations, data availability statements, or supplementary materials included in this article.