

Abstract
Energy-yielding beverages reportedly contribute to positive energy balance uniquely. They are highly consumed and evoke weaker satiety signaling and dietary energy compensation than solid foods of the same energy content. This study measured the contribution of learning to appetitive sensations and adjustments of energy intake for preloads varying in energy content and food form in lean and obese adults. One-hundred seven participants received four preload trials before and after a dietary intervention in this randomized cross-over trial with the stipulation that lean and obese individuals were evenly assigned to each intervention. The study entailed monitoring appetitive sensations and daily energy intake after consumption of low and high energy beverage and solid food loads on weekly visit days. Preload testing was conducted at baseline, followed by daily ingestion of one load for 14 days and then retesting responses to the four treatments. Lean individuals compensated precisely for the high energy beverage and solid loads from the onset of the study, whereas the obese did not alter eating patterns after consuming the higher energy beverage load. The learning intervention did not have an effect on the responses to the preloads, as responses in both lean and obese participants did not differ from baseline values. Responses to personality and eating behavior questionnaires revealed differences between the lean and obese groups and weakly, but significantly, predicted challenge meal and total daily energy intake. These data suggest that lean and obese individuals respond to energy in beverage form differently, and this is not altered by purposeful daily exposure to loads varying in physical form and energy content for two weeks.
Keywords: Beverages, Energy, Obesity, Intervention, Intake, Conditioning
1.1 Introduction
Consumption of energy-yielding beverages has paralleled the incidence of obesity (Popkin 2010). A causal relationship has been proposed based on the weak satiety properties of beverages (DiMeglio and Mattes 2000; Mourao, Bressan et al. 2007; Wolf, Bray et al. 2008; Mattes and Campbell 2009; Pan and Hu 2011) leading to incomplete energy compensation (Mattes 2006; Mattes 2006). Contributing to this are cognitive factors, as expectations about the satiating effect of a food may influence the behavioral and physiological responses to beverage and solid food consumption (Cassady, Considine et al. 2012). In addition, obese individuals may exhibit a less precise compensatory response to ingested energy as compared to lean individuals (Campbell, Hashim et al. 1971; Ebbeling, Sinclair et al. 2004), especially for beverages (Houchins, Burgess et al. 2012). In post-hoc analyses, several trials have noted especially high energy intake among the obese when consuming energy as a beverage (Ebbeling, Feldman et al. 2006; Sichieri, Paula Trotte et al. 2009; Houchins, Burgess et al. 2012).
Food choice, eating frequency, and portion size are largely driven by cues learned through prior dietary experiences, where cognitive impressions acquire predictive value for the likely post-ingestive consequences of ingesting a given food or meal (Wooley 1972; Mattes 2005; Welch 2011; Cassady, Considine et al. 2012). Food choice and eating behaviors are frequently driven by personality traits and conditioned behaviors as well (Mela 1999). Beverages and solid foods present distinct sensory experiences with markedly different physiological responses. Beverages have lower anticipatory satiety value (Tournier and Louis-Sylvestre 1991; Mattes 2005; Cassady, Considine et al. 2012; Hogenkamp, Mars et al. 2012), require less oral processing (Tournier and Louis-Sylvestre 1991; de Wijk, Zijlstra et al. 2008; Zijlstra, Mars et al. 2008; Mars, Hogenkamp et al. 2009), empty from the stomach faster (Marciani, Gowland et al. 2001; Hoad, Rayment et al. 2004; Juvonen, Purhonen et al. 2009; Cassady, Considine et al. 2012), and have shorter GI transit times (Hoad, Rayment et al. 2004; Cassady, Considine et al. 2012) than solid foods. Consequently, it is hypothesized that beverages may foster weaker sensory-metabolic learning, which would be consistent with evidence of less precise dietary compensation for beverages compared to solid food energy intake. Also, given differences in BMI, which stem from chronic energy imbalance (i.e., imprecise dietary compensation), it is hypothesized that lean individuals more precisely adjust to varying energy loads than overweight/obese individuals due to stronger food form-energy learning.
To test these hypotheses, participants consumed preloads differing in energy content and food form, and subsequent eating behaviors and appetitive sensations were monitored. Participants completed testing at baseline and a two-week dietary intervention. This intervention involved repeated consumption of one of the test loads in an attempt to condition metabolic consequences of ingesting a food along with cognitive impressions of the food. The preload testing was then repeated to measure the effect of the intervention. Measuring energy intake, meal timing, and appetitive responses before and after the intervention was conducted to allow assessment of the conditioning intervention.
1.2 Methods
1.2.1 Recruitment
Eligibility requirements included the following: ages 18-60 years, either lean (BMI 18-25 kg/m2) or obese (30-40 kg/m2), weight stable (< 3 kg weight change within last 3 months), constant habitual activity patterns (variation of < 30 min/week within the past 3 months), no purposeful dietary restrictions or supplementations within last 3 months, willingness to eat a chocolate-flavored snack at test sessions and two week training period, no allergies to test foods, no plan to change use of medications known to influence appetite or metabolism, and not diabetic. Eligibility was assessed by using a prescreening form emailed to interested participants. The study was conducted between September 2011 and November 2013 at Purdue University, West Lafayette, IN.
At the screening visit, participants ingested approximately 20 g of each of four test foods (high-energy beverage—HB, high-energy solid—HS, low-energy solid—LS, low-energy beverage— LB), and each was rated greater than “neither like nor dislike” on an unnumbered labeled affective magnitude (LAM) scale (Schutz and Cardello 2001) with anchors “greatest imaginable dislike” and “greatest imaginable like.” Physical characteristics of the test loads are given in Table 1, and test load recipes are given in Table 2. Participants then completed the Eating Attitudes Test-26 to disqualify disordered eaters (scores > 20) from the participant pool (Garner and Garfinkel 1979). BMI was calculated by obtaining participants' weight to the nearest 0.1 kg using a digital clinical scale and height to the nearest cm using a Holtain stadiometer. In total, 124 participants completed the screening visit, and 110 were enrolled in the study. Three participants dropped out of the study due to time conflicts within the first four weeks and are not included in the analysis. Of the remaining 107 participants, 104 completed the entirety of the study, and 3 completed the majority of the study and were included in the analyses. Overall, 94.5% of enrolled participants completed the study, and 97.3% of the participants are included in analyses. Demographics of the participant pool are given in Table 3. All participants provided written informed consent as approved by the Purdue University Biomedical Institutional Review Board. The study was registered on clinicaltrials.gov under number NCT01490034.
Table 1.
Physical properties of finished test loads.
| HS | LS | HB | LB | |
|---|---|---|---|---|
| Mass (g) | 106 | 48 | 521 | 447 |
| Volume (cm3 or mL) | 210 | 210 | 470 | 430 |
| Energy Content (kcal) | 430 | 155 | 430 | 155 |
Table 2.
Test load recipes (mass in grams).
| HS | LS | HB | LB | |
|---|---|---|---|---|
| Water | 7.0 | 7.0 | 400.0 | 400.0 |
| Cocoa | 2.4 | 1.8 | 2.4 | 2.4 |
| Marshmallow | 35.0 | 21.0 | - | - |
| Polycose™ | 27.5 | - | 103.1 | 27.5 |
| Rice Cereal | 24.5 | 24.5 | - | - |
| Butter | 13.5 | - | - | - |
| Splenda™ | - | 0.65 | - | 1.95 |
| Sugar | - | - | 15.0 | 15.0 |
Table 3.
Study participant (n=107) demographics.
| Mean Age | 26.8 ± 7.9 yrs. | |
|---|---|---|
| Gender | n | Percentage |
| Male | 41 | 38.3 |
| Female | 66 | 61.7 |
| Race/Ethnicity | ||
| White | 77 | 72.0 |
| Asian | 18 | 16.8 |
| Black | 7 | 6.5 |
| Hispanic | 2 | 1.9 |
| Other/Unknown | 3 | 2.8 |
1.2.2 Visits
Participants were asked to consume the same type of breakfast throughout the study. They reported to the laboratory at their customary lunchtime after having fasted (except water) for at least three hours since breakfast. They were then allotted 15 minutes to consume their test food in its entirety. They were required to stay in the laboratory for one hour, after which they were given 15 minutes to consume a challenge meal consisting of macaroni and cheese (Easy Mac, Kraft Foods, Northfield, IL) and 8 oz. of water. During the hour interval, they estimated the mass (< 500 g) of five objects by holding them in their hands. This served as a cross-modality index of learning unrelated to ingestion during the study period. Practice weights were standardized to a visual analog scale, and responses were recorded on the same scale. Participants were not given feedback as to their responses. In addition, over the course of the nine visits, each participant completed the following nine questionnaires pertaining to personality or ingestive behavior: the Food Craving Questionnaire—State (Cepeda-Benito, Gleaves et al. 2000), Perceived Stress Scale (Cohen, Kamarck et al. 1983), Zung Self-Rating Scale of Depression (Zung 1965), Eysenck Personality Questionnaire-Revised (Eysenck, Eysenck et al. 1985), Food Attitudes Survey (Raudenbush, Vanderklaauw et al. 1995), Brief Sensation Seeking Scale 4 (Stephenson, Hoyle et al. 2003), Three-Factor Eating Questionnaire (Stunkard and Messick 1985), Power of Food Scale (Cappelleri, Bushmakin et al. 2009), and Physical Activity Questionnaire (Johansson and Westerterp 2008). On trial days, participants completed digital appetite logs on a hand-held electronic device (PalmPilot™) every fifteen minutes while in the laboratory and every hour after their laboratory visit until retiring for the night. Responses were recorded on visual analog scales with anchors of “not at all” and “extremely” for each of nine appetitive sensations: “hunger,” “fullness,” “desire to eat,” “prospective food consumption,” “preoccupation with food,” “thirst,” “desire to eat salty food,” “desire to eat fatty food,” and “desire to eat sweet food,” following previously validated methods (Hill and Blundell 1983; Flint, Raben et al. 2000; Stubbs, Hughes et al. 2001. Participants also kept a food diary for the remainder of the day following each laboratory visit. Figure 1 is a diagram of visit procedures.
Figure 1.
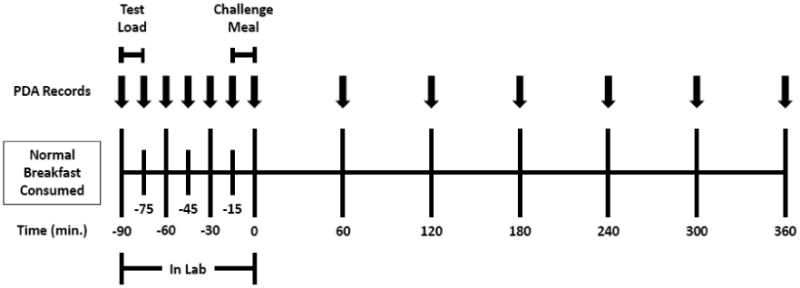
Diagram of study visit procedures.
Figure 2 illustrates the design of the study. Participants completed weekly visits for four weeks (first time point). This was followed by a two week intervention during which participants reported to the laboratory at lunchtime daily to consume one of the test loads or a control (two saltine crackers) and practice the weight assessment task. On weekend days, the participants did not report to the laboratory; rather, they consumed the test foods on their own after receiving them on Fridays. The intervention was followed by four more weeks of visits that repeated the four initial visits (second time point). Following a two week washout period, participants reported for one additional visit (third time point), consuming the test load corresponding to the intervention test load to allow for a determination as to whether the effects of the learning period withstood a short time span without training. Control subjects, individuals who consumed saltine crackers during the intervention, were randomly assigned one of the test loads for this visit. Because the control subjects showed no significant differences than those in the intervention groups, they were analyzed as one pool of participants. The order of the test loads in each set of four weekly visits was determined at random, and assignment to an intervention or control group was also randomized.
Figure 2.
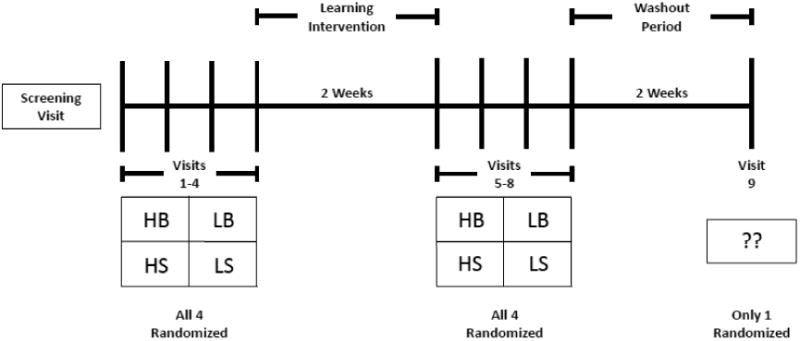
Diagram of study timeline.
1.2.3 Dietary Assessment
Energy intake was analyzed using the University of Minnesota Nutrition Data System for Research 2010, and the data were inputted by only one researcher to reduce variability.
1.2.4 Statistical Analysis
Mixed models ANOVA was conducted using PROC MIXED in SAS Version 9.3 (SAS Institute Inc., Cary, NC). The model included intervention, time, weight status, and preload treatment as fixed effects and subject as a random effect. Two-way interactions and significant three-way interactions were also included. Post hoc means comparisons were conducted using the Bonferroni adjustment for multiple comparisons. Appetitive responses were analyzed similarly, using differences in values as the outcome variable. The estimation task was analyzed using one-way ANOVA, with time as the independent variable, and correlations between the questionnaires and outcomes were measured using PROC CORR univariate regression.
1.3 Results
1.3.1 Challenge Meal
As shown in Figure 3, after consuming the LS preload at any time point, lean participants ate a greater amount of the challenge meal than after consuming the HS preload (380 ± 171 kcal vs. 337 ± 163 kcal) (p<0.001). There was no difference in challenge meal consumption between the HB or LB preloads (347 ± 156 kcal and 368 ± 186 kcal) (p>0.05) by the lean participants, and there was no difference in challenge meal consumption after any of the test loads in the obese. There were no differential responses to the learning intervention among test loads or between lean and obese participants (p>0.05).
Figure 3.
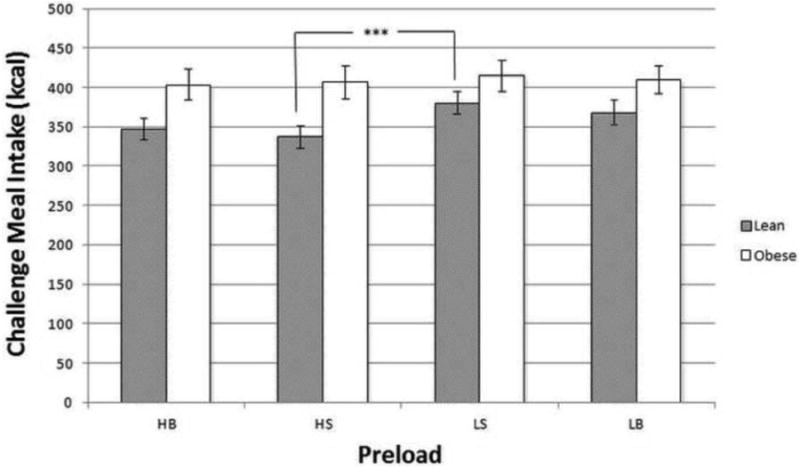
Mean challenge meal intake (in kcal, ± SE) over all time points one hour after preload consumption.
HB—High-Energy Beverage, HS—High-Energy Solid, LS—Low-Energy Solid, LB—Low-Energy Beverage
***Lean participants (N=60) consumed significantly more energy after the LS preload than after the HS preload (p<0.001).
1.3.2 Time until Next Meal
Over all time points, the HB preload delayed the time before the next meal eaten outside of the laboratory as compared to the LB preload in lean participants (p<0.01), but not in the obese (Figure 4). The mean time before the next meal was 255 ± 115 minutes after the HB preload and 215 ± 115 minutes after the LB preload for the lean participants, while in the obese it was 218 ± 112 minutes for the HB preload and 231 ± 118 for the LB preload. There was no difference between the high- and low-energy solid preloads in either the lean or obese groups. Additionally, the intervention, regardless of food form or energy content, had no effect on the time until the next meal.
Figure 4.
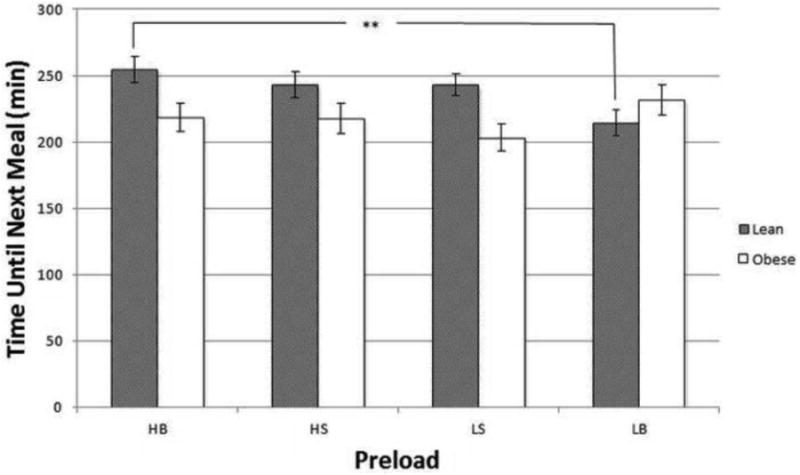
Mean time until the next meal (in min, ± SE) over all time points after consumption of preload and challenge meal.
HB—High-Energy Beverage, HS—High-Energy Solid, LS—Low-Energy Solid, LB—Low-Energy Beverage
**Lean participants (N=60) had a longer inter-meal interval when consuming the HB preload, as compared to the LB preload (p<0.01).
1.3.3 Total Energy Intake
At the baseline visits, participants consumed more energy with the HB (2262 ± 679 kcal) preload than the LB preload (1986 ± 660 kcal) (p<0.001) (Figure 5). Participants also consumed more energy with the HS preload (2326 ± 692 kcal) than the LB or LS (1986 ± 660 kcal and 2040 ± 669 kcal) preloads (p<0.01). This did not differ between lean and obese participants. After the intervention, participants continued to consume more energy after either HB (2279 ± 745 kcal) or HS (2183 ± 662 kcal) preloads than after the LB preload (1920 ± 632 kcal) (p<0.001). Energy consumed after the LS preload (2024 ± 604 kcal) was not significantly different than the other preloads. There were no significant differences in energy intake among the different preloads after the washout period, and only intake after the HS preload decreased from the previous time point (decrease from 2183 ± 662 kcal to 1988 ± 530 kcal).
Figure 5.
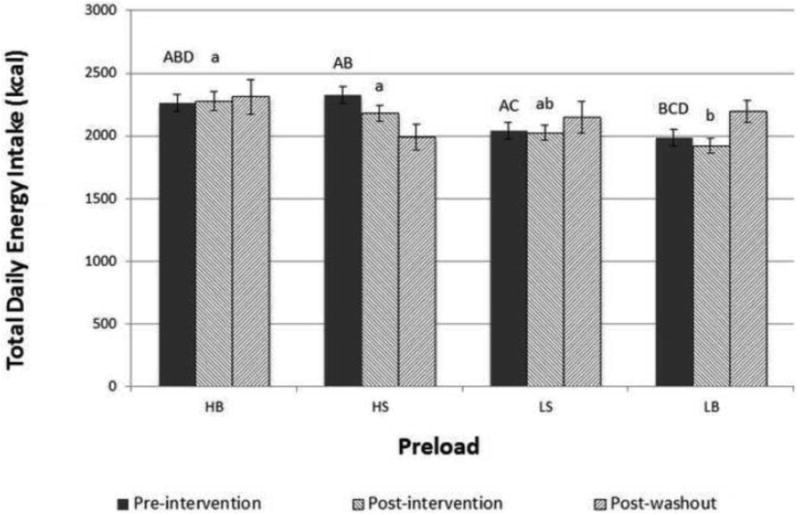
Total daily energy intake (in kcal, ± SE) of participants when consuming the given preloads.
HB—High-Energy Beverage, HS—High-Energy Solid, LS—Low-Energy Solid, LB—Low-Energy Beverage
Letters indicate significant differences within each time point at p<0.01
1.3.4 Appetite Attributes
After consuming the HB and LB preloads, participants showed decreases in thirst (-21 ± 24 and -21 ± 25 mm, respectively) while the HS and LS preloads resulted in increases in thirst of 18 ± 22 and 12 ± 20 mm (p<0.0001) (Figure 6). After consuming the challenge meal, participants who had consumed the HB or LB preloads showed smaller declines in thirst (-9 ± 18 and -11 ± 20) than those who had consumed the HS or LS preloads (-19 ± 25 and -20 ± 20) (p<0.0001). There were no significant differences in hunger (Figure 7), fullness, or any other measured appetitive sensations after participants received the preloads.
Figure 6.
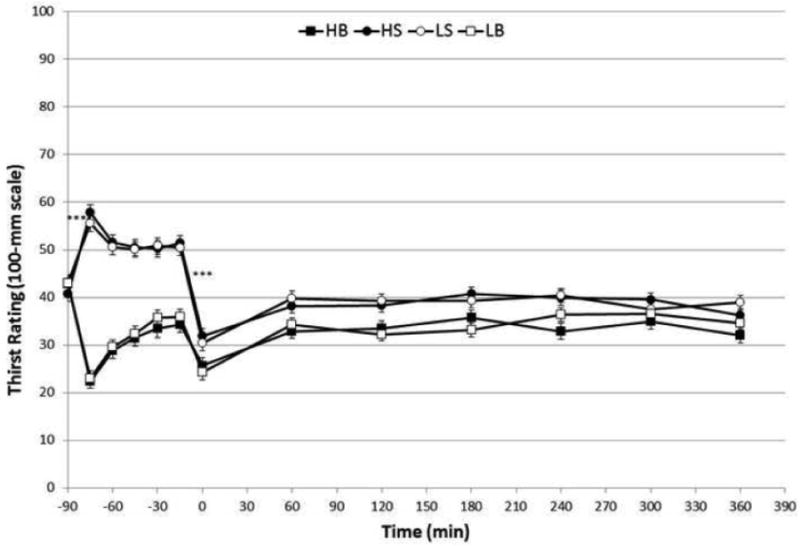
Mean visual analog scale (100-mm) ratings (± SE) of thirst when consuming different preloads.
HB—High-Energy Beverage, HS—High-Energy Solid, LS—Low-Energy Solid, LB—Low-Energy Beverage
***p<0.0001 for difference in change thirst between beverage and solid test loads
Figure 7.
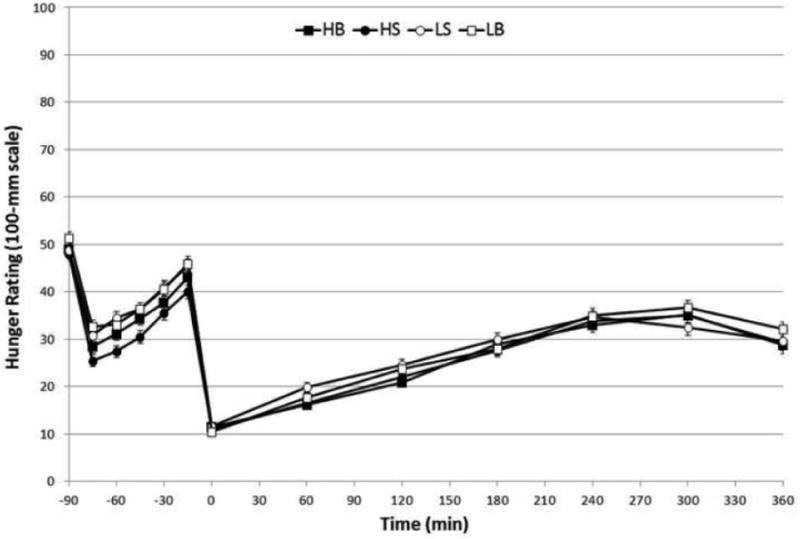
Mean visual analog scale (100-mm) ratings (± SE) of hunger when consuming different preloads.
HB—High-Energy Beverage, HS—High-Energy Solid, LS—Low-Energy Solid, LB—Low-Energy Beverage
1.3.5 Estimation Task
There was no difference among groups in performance on the weight estimation task. The difference between the actual and estimated values was not improved over the intervention portion, and the values did not improve after the washout period.
1.3.6 Questionnaires
There were no initial differences between lean and obese participants or the intervention groups for any of the questionnaires. However, there were positive correlations between BMI and scores on the Eating Attitude Test (p<0.05, r=0.230), Perceived Stress Scale (p<0.05, r=0.190), and the disinhibition portion of the Three-Factor Eating Questionnaire (p<0.0001, r=0.428). Higher scores on these scales are indicative of disordered eating, greater amounts of stress, and greater incidence of disinhibited eating behaviors, respectively, and obese participants were more likely to have greater scores on these assessments.
The time until the next eating occasion was not correlated with any of the questionnaires, but energy intake at the challenge meal and the remainder of the day were both weakly, but significantly, correlated with physical activity (r=0.11, p<0.01, and r=0.10, p<0.01, respectively), disinhibited eating (r=-0.18, p<0.001, and r=-0.11, p<0.001) and restrained eating (r=-0.28, p<0.001, and r=-0.17, p<0.001,). Additionally, intake at the challenge meal was correlated with disordered eating (r=-0.16, p<0.001), finickiness (r=-0.12, p<0.001), sensation seeking behavior (r=0.07, p<0.05), extraversion (r=-0.13, p<0.001), food cravings (r=-0.07, p<0.05), and depression (r=-0.17, p<0.001).
1.4 Discussion
A key hypothesis of this trial held that sensory-energy learning would be less robust when based on a beverage vehicle compared to a solid. It was further posited that learning would be weaker among obese individuals compared to those who are lean. While many of the planned comparisons did not yield the expected differences, there were significant treatment effects consistent with the hypotheses and none in conflict with them. Based on mean responses to the preloads, lean participants had lower intakes of the challenge meal after the high energy solid preload compared to the low energy solid preload, whereas this was not the case with the beverage loads. Thus, the solid food form appeared to be a more salient sensory signal, evoking stronger behavioral adjustments as reported previously (Tournier and Louis-Sylvestre 1991; DiMeglio and Mattes 2000; Mourao, Bressan et al. 2007; Pan and Hu 2011). Further, the lean, but not the obese, responded differentially to the beverage energy loads. The lean were also more responsive to the energy value of beverages than the obese as evidenced by a longer inter-meal interval by the lean for the higher energy beverage with no difference observed in the obese. These findings are consistent with evidence that beverages pose a greater hazard for positive energy balance and weight gain in obese compared to lean individuals (Ebbeling, Feldman et al. 2006; Sichieri, Paula Trotte et al. 2009; Houchins, Burgess et al. 2012). It is held that cognitive factors, sensory stimulation, and gastric feedback are three of the main drivers of the differential satiety of solids and beverages.
First, cognitive factors play a large role in differential responses to beverages and solid foods (Wooley, Wooley et al. 1972; Wooley 1972; Cassady, Considine et al. 2012). The cognitive impact of feeding is highlighted by differential responses to identical test loads identified as soup or as beverage (Mattes 2005) and by telling participants that a test load will change form in the stomach when such changes do not actually occur (Cassady, Considine et al. 2012). Similar pre-ingestive cognitive manipulations have altered satiety, decreased hunger, and increased fullness for three hours after receiving identical test loads (Brunstrom, Brown et al. 2011). By labelling identical test loads as being “indulgent” rather than “sensible,” not only are cognitive impressions altered, but the orexigenic hormone ghrelin is significantly reduced after the “indulgent” test load as compared to the “sensible” test load (Crum, Corbin et al. 2011). This has led to suggestions that cognition is an important component of satiety, whether anticipated or measured postprandially (Tournier and Louis-Sylvestre 1991; Mattes 2005; Tieken, Leidy et al. 2007; Pan and Hu 2011).
A second contributor is sensory stimulation, which is increased by the greater oral processing required for solid foods as opposed to beverages (de Wijk, Zijlstra et al. 2008; Zijlstra, de Wijk et al. 2009; Bolhuis, Lakemond et al. 2011; de Graaf 2011). Sensory stimulation can occur via many sensory modalities, such as the gustatory, olfactory, and somatosensory systems (Sorensen, Moller et al. 2003), but each increases the satiety value of food. A greater eating rate alone results in increased intake (Viskaal-van Dongen, Kok et al. 2011), and the eating rate for beverages is much greater than that of solid foods. A yogurt test load consumed with a straw rather than a spoon was ingested at a much greater rate, and more was eaten using the straw, demonstrating the importance of orosensory exposure (Hogenkamp, Mars et al. 2010). Sensory stimuli trigger many of the physiological responses necessary to process and digest food, often before the food or beverage enters the mouth. These responses are often small and transient, but nonetheless influence ingestive behavior (Mattes 1997). Taken together, sensory stimulation has proven to be an important modulator of satiation.
Third, gastric feedback following ingestion of solids and beverages differs substantially. Because beverages have weak satiety properties and elicit incomplete energy compensation responses compared to solid foods matched on macronutrient content and palatability (DiMeglio and Mattes 2000; Mourao, Bressan et al. 2007; Cassady, Considine et al. 2012; Houchins, Burgess et al. 2012), strategies to manipulate the viscosity of beverages in the gut have been developed (Hoad, Rayment et al. 2004; Peters, Koppert et al. 2011). Thickening the beverage can lengthen GI transit time and exposure time in the gut, resulting in increased hormonal responses to beverages, and gradations of viscosity have proven effective in eliciting satiety (Mattes and Rothacker 2001; Zijlstra, Mars et al. 2008; Mars, Hogenkamp et al. 2009). Solids and beverages appear to trigger responses from different areas of the stomach, with emptying of liquid foods driven by stretch receptors around the gastric fundus at the proximal end of the stomach and grinding and breakdown of solid foods occurring at the distal antrum (Phillips and Powley 1996; Powley and Phillips 2004; Park and Camilleri 2005). Satiety feedback is primarily driven by stretch receptors in the stomach and nutrients in the intestines, respectively (Powley and Phillips 2004). Thus, satiety driven by solid foods will persist longer due to prolonged activation of stretch receptors. Because macronutrient composition was largely controlled in the present study, the stomach would likely be more important for satiety signals, and because beverages empty from the stomach more quickly than solid foods (Marciani, Gowland et al. 2001; Hoad, Rayment et al. 2004), they distend the stomach to a lesser extent and for a shorter time than would be necessary to elicit significant satiety value. Shorter overall GI transit times are also reported for beverages (Marciani, Gowland et al. 2001) and may contribute to their weaker satiety properties. In the present trial, the size of the challenge meal was not impacted by the beverages, but lean participants were able to accurately compensate for the solid preloads.
Although hunger, fullness, and other appetitive sensations did not differ based on food form or energy content, ratings of thirst were significantly decreased by beverage preloads, and individuals consuming solid preloads reported greater ratings of thirst. Subsequent ratings of thirst showed that the initial suppression of thirst lasted past the preload and challenge meal period, as the beverage loads showed smaller rebounds after the challenge meal. This finding suggests that thirst (or the absence of thirst) activated by the preloads was a highly salient signal, affecting ingestive behavior, not only within the laboratory portion of the study, but after the challenge meal as well.
The personality and behavioral questionnaires administered to participants confirm previously-documented differences between lean and obese participants. Obese participants were more likely to be stressed and exhibit traits of disordered eating, consistent with past research (Torres and Nowson 2007; Desai, Miller et al. 2008). Energy intake at the challenge meal and throughout the day also increased with attributes associated with stress and disordered eating.
Studies finding that beverages are more filling most often base comparisons on energy density (Rolls, Bell et al. 1999; Leahy, Birch et al. 2008; Rolls 2009), but the energy densities used are not representative of commonly-ingested beverages. These studies utilized beverages with energy densities ranging from 0.82 to 1.77 kcal/g while the current study utilized beverages with energy densities of 0.35 and 0.83 kcal/g. For comparison, whole milk, beer, and a commonly-consumed cola have energy densities of 0.60, 0.43, and 0.39 kcal/g. Thus, the test loads used in the current study are more representative of normal intake. Energy-yielding beverages are low energy density foods, while still capable of contributing a large amount of energy to the diet (Popkin 2010). Other studies that report greater satiety and hunger suppression with beverages tend to utilize larger test load volumes than this study, such as 590 ml test loads in one study (Almiron-Roig and Drewnowski 2003). These data can be interpreted differently, either that when matched on energy, the beverages are more satiating because of their much larger volume or that they are less satiating when matched on volume. Generally, large volumes of either solids or beverages will be more satiating than intakes of small volumes (Bell, Roe et al. 2003). In the present trial, the solids and beverages were matched closely for energy and macronutrient content, but were not matched for volume.
1.5 Study Strengths and Limitations
A strength of the current study is that it is a randomized, controlled intervention, and eating behaviors outside of the laboratory are also recorded. Many preload studies collect appetite and diet records only within the laboratory, but monitoring intake for a 24-hour period better allows for free-living compensatory responses to be measured. Additionally, the test loads are flavor-matched so that the flavor of the preloads will not exert unique effects on subsequent energy intake.
It has been held that decreased sensory exposure time for beverages limits the formation of associations between sensory signals and the metabolic consequences of ingesting beverages (de Graaf 2011), and individuals adjust their subsequent intake based on their beliefs about the energy content of a meal (Wooley, Wooley et al. 1972). The two week learning intervention may not have been sufficiently long to reveal the full extent of its impact. The training period used was based on earlier trials of orosensory-energy learning effects over 10-day and 5-day periods, respectively (Louis-Sylvestre, Tournier et al. 1989; Tepper, Mattes et al. 1991). However, other work exploring the time course of hedonic shifts for selected taste qualities indicated 4-12 weeks of training were necessary for changes of preferred salt and fat concentrations in food to occur (Bertino, Beauchamp et al. 1986; Mattes 1993). Thus, a longer intervention may have been required. A different measure of learning may also be appropriate. It could also be argued that the use of high-intensity sweeteners in the low energy test loads may elicit unique responses (Swithers and Davidson 2008), but no differences in sweetness or liking were noted by participants, and other studies challenge these findings (Monsivais, Perrigue et al. 2007; Soenen and Westerterp-Plantenga 2007).
1.6 Conclusion
Lean participants were able to compensate for energy in solid form, as illustrated by greater challenge meal intake after the LS preload than the HS preload. Contrary to the hypothesis, lean participants were also able to delay the next eating occasion after the HB preload as compared to the LB preload. Obese participants, as hypothesized, did not compensate for energy in beverage form, but energy in solid form was also not precisely detected. Total daily energy intake was increased by the HB and HS loads in all participants, suggesting that precise compensation at the challenge meal may not continue to the next eating occasions. Repeated consumption of the test loads did not result in improvements in dietary compensation, in contrast to the initial hypothesis. Future work should continue to focus on repeated exposures as a means of improving dietary compensation to beverages by altering cognitive, sensory, and physiological feedback, but a longer intervention would be justified.
Highlights.
Participants did not improve dietary compensation after the intervention phase.
Lean participants could compensate for energy from solid foods at challenge meals.
Obese participants could not compensate for energy from solid foods or beverages.
Total daily energy intake was increased by high-energy beverages and solids.
Lean and obese participants do not respond to solid and beverage energy equally.
Acknowledgments
The authors wish to thank Dr. Bruce Craig with his assistance in analyzing the study data.
This research was supported by a grant from the US National Institutes of Health, Award 5R01 DK079913.
Abbreviations
- HB
High-Energy Beverage
- HS
High-Energy Solid
- LS
Low-Energy Solid
- LB
Low-Energy Beverage
Footnotes
Publisher's Disclaimer: This is a PDF file of an unedited manuscript that has been accepted for publication. As a service to our customers we are providing this early version of the manuscript. The manuscript will undergo copyediting, typesetting, and review of the resulting proof before it is published in its final citable form. Please note that during the production process errors may be discovered which could affect the content, and all legal disclaimers that apply to the journal pertain.
References
- Popkin BM. Patterns of beverage use across the lifecycle. Phys & Behav. 2010;100:4–9. doi: 10.1016/j.physbeh.2009.12.022. [DOI] [PMC free article] [PubMed] [Google Scholar]
- DiMeglio DP, Mattes RD. Liquid versus solid carbohydrate: effects on food intake and body weight. Int J Obes Relat Metab Disord. 2000;24:794–800. doi: 10.1038/sj.ijo.0801229. [DOI] [PubMed] [Google Scholar]
- Mattes RD, Campbell WW. Effects of food form and timing of ingestion on appetite and energy intake in lean young adults and in young adults with obesity. J Am Diet Assoc. 2009;109:430–437. doi: 10.1016/j.jada.2008.11.031. [DOI] [PMC free article] [PubMed] [Google Scholar]
- Mourao DM, Bressan J, Campbell WW, Mattes RD. Effects of food form on appetite and energy intake in lean and obese young adults. Int J Obes (Lond) 2007;31:1688–1695. doi: 10.1038/sj.ijo.0803667. [DOI] [PubMed] [Google Scholar]
- Pan A, Hu FB. Effects of carbohydrates on satiety: differences between liquid and solid food. Current Op Clin Nutr Metab Care. 2011;14:385–390. doi: 10.1097/MCO.0b013e328346df36. [DOI] [PubMed] [Google Scholar]
- Wolf A, Bray GA, Popkin BM. A short history of beverages and how our body treats them. Obes Rev. 2008;9:151–164. doi: 10.1111/j.1467-789X.2007.00389.x. [DOI] [PubMed] [Google Scholar]
- Mattes RD. Beverages and positive energy balance: the menace is the medium. Int J Obes. 2006a;30:S60–S65. [Google Scholar]
- Mattes RD. Fluid calories and energy balance: the good, the bad, and the uncertain. Phys & Behav. 2006b;89:66–70. doi: 10.1016/j.physbeh.2006.01.023. [DOI] [PubMed] [Google Scholar]
- Cassady BA, Considine RV, Mattes RD. Beverage consumption, appetite, and energy intake: what did you expect? Amer J Clin Nutr. 2012;95:587–593. doi: 10.3945/ajcn.111.025437. [DOI] [PMC free article] [PubMed] [Google Scholar]
- Ebbeling CB, Sinclair KB, Pereira MA, Garcia-Lago E, Feldman HA, Ludwig DS. Compensation for energy intake from fast food among overweight and lean adolescents. JAMA. 2004;291:2828–2833. doi: 10.1001/jama.291.23.2828. [DOI] [PubMed] [Google Scholar]
- Campbell RG, Hashim SA, Van Itallie TB. Studies of food-intake regulation in man. Responses to variations in nutritive density in lean and obese subjects. N Engl J Med. 1971;285:1402–1407. doi: 10.1056/NEJM197112162852504. [DOI] [PubMed] [Google Scholar]
- Houchins JA, Burgess JR, Campbell WW, et al. Beverage vs. Solid Fruits and Vegetables: Effects on Energy Intake and Body Weight. Obesity. 2012;20:1844–1850. doi: 10.1038/oby.2011.192. [DOI] [PubMed] [Google Scholar]
- Ebbeling CB, Feldman HA, Osganian SK, Chomitz VR, Ellenbogen SJ, Ludwig DS. Effects of decreasing sugar-sweetened beverage consumption on body weight in adolescents: a randomized, controlled pilot study. Pediatrics. 2006;117:673–680. doi: 10.1542/peds.2005-0983. [DOI] [PubMed] [Google Scholar]
- Sichieri R, Paula Trotte A, de Souza RA, Veiga GV. School randomised trial on prevention of excessive weight gain by discouraging students from drinking sodas. Public Health Nutr. 2009;12:197–202. doi: 10.1017/S1368980008002644. [DOI] [PubMed] [Google Scholar]
- Mattes RD. Soup and satiety. Phys & Behav. 2005;83:739–747. doi: 10.1016/j.physbeh.2004.09.021. [DOI] [PubMed] [Google Scholar]
- Wooley SC. Physiologic versus cognitive factors in short term food regulation in the obese and nonobese. Psychosom Med. 1972;34:62–68. doi: 10.1097/00006842-197201000-00007. [DOI] [PubMed] [Google Scholar]
- Welch RW. Satiety: have we neglected dietary non-nutrients? Proc Nutr Soc. 2011;70:145–154. doi: 10.1017/S0029665110004763. [DOI] [PubMed] [Google Scholar]
- Mela DJ. Food choice and intake: the human factor. Proceedings of the Nutrition Society. 1999;58:513–521. doi: 10.1017/s0029665199000683. [DOI] [PubMed] [Google Scholar]
- Tournier A, Louis-Sylvestre J. Effect of the Physical State of a Food on Subsequent Intake in Human-Subjects. Appetite. 1991;16:17–24. doi: 10.1016/0195-6663(91)90107-4. [DOI] [PubMed] [Google Scholar]
- Hogenkamp PS, Mars M, Stafleu A, de Graaf C. Repeated consumption of a large volume of liquid and semi-solid foods increases ad libitum intake, but does not change expected satiety. Appetite. 2012;59:419–424. doi: 10.1016/j.appet.2012.06.008. [DOI] [PubMed] [Google Scholar]
- de Wijk RA, Zijlstra N, Mars M, de Graaf C, Prinz JF. The effects of food viscosity on bite size, bite effort and food intake. Physiol Behav. 2008;95:527–532. doi: 10.1016/j.physbeh.2008.07.026. [DOI] [PubMed] [Google Scholar]
- Zijlstra N, Mars M, de Wijk RA, Westerterp-Plantenga MS, de Graaf C. The effect of viscosity on ad libitum food intake. Int J Obes (Lond) 2008;32:676–683. doi: 10.1038/sj.ijo.0803776. [DOI] [PubMed] [Google Scholar]
- Mars M, Hogenkamp PS, Gosses AM, Stafleu A, De Graaf C. Effect of viscosity on learned satiation. Phys & Behav. 2009;98:60–66. doi: 10.1016/j.physbeh.2009.04.018. [DOI] [PubMed] [Google Scholar]
- Juvonen KR, Purhonen AK, Salmenkallio-Marttila M, et al. Viscosity of Oat Bran-Enriched Beverages Influences Gastrointestinal Hormonal Responses in Healthy Humans. Journal of Nutrition. 2009;139:461–466. doi: 10.3945/jn.108.099945. [DOI] [PubMed] [Google Scholar]
- Hoad CL, Rayment P, Spiller RC, et al. In vivo imaging of intragastric gelation and its effect on satiety in humans. J Nutr. 2004;134:2293–2300. doi: 10.1093/jn/134.9.2293. [DOI] [PubMed] [Google Scholar]
- Marciani L, Gowland PA, Spiller RC, et al. Effect of meal viscosity and nutrients on satiety, intragastric dilution, and emptying assessed by MRI. Am J Physiol Gastrointest Liver Physiol. 2001;280:G1227–1233. doi: 10.1152/ajpgi.2001.280.6.G1227. [DOI] [PubMed] [Google Scholar]
- Schutz HG, Cardello AV. A labeled affective magnitude (LAM) scale for assessing food liking/disliking. J Sens Studies. 2001;16:117–159. [Google Scholar]
- Garner DM, Garfinkel PE. Eating Attitudes Test - Index of the Symptoms of Anorexia-Nervosa. Psych Med. 1979;9:273–279. doi: 10.1017/s0033291700030762. [DOI] [PubMed] [Google Scholar]
- Cepeda-Benito A, Gleaves DH, Williams TL, Erath SA. The development and validation of the state and trait food-cravings questionnaires. Behav Therapy. 2000;31:151–173. doi: 10.1016/s0005-7967(99)00141-2. [DOI] [PubMed] [Google Scholar]
- Cohen S, Kamarck T, Mermelstein R. A Global Measure of Perceived Stress. J Health Soc Behav. 1983;24:385–396. [PubMed] [Google Scholar]
- Zung WWK. A Self-Rating Depression Scale. Archives of Gen Psych. 1965;12:63–70. doi: 10.1001/archpsyc.1965.01720310065008. [DOI] [PubMed] [Google Scholar]
- Eysenck SBG, Eysenck HJ, Barrett P. A Revised Version of the Psychoticism Scale. Personality Indiv Diff. 1985;6:21–29. [Google Scholar]
- Raudenbush B, Vanderklaauw NJ, Frank RA. The Contribution of Psychological and Sensory Factors to Food Preference Patterns as Measured by the Food Attitudes Survey (Fas) Appetite. 1995;25:1–15. doi: 10.1006/appe.1995.0037. [DOI] [PubMed] [Google Scholar]
- Stephenson MT, Hoyle RH, Palmgreen P, Slater MD. Brief measures of sensation seeking for screening and large-scale surveys. Drug Alcohol Depend. 2003;72:279–286. doi: 10.1016/j.drugalcdep.2003.08.003. [DOI] [PubMed] [Google Scholar]
- Stunkard AJ, Messick S. The three-factor eating questionnaire to measure dietary restraint, disinhibition and hunger. J Psychosom Res. 1985;29:71–83. doi: 10.1016/0022-3999(85)90010-8. [DOI] [PubMed] [Google Scholar]
- Cappelleri JC, Bushmakin AG, Gerber RA, et al. Evaluating the Power of Food Scale in obese subjects and a general sample of individuals: development and measurement properties. Int J Obes. 2009;33:913–922. doi: 10.1038/ijo.2009.107. [DOI] [PubMed] [Google Scholar]
- Johansson G, Westerterp KR. Assessment of the physical activity level with two questions: validation with doubly labeled water. Int J Obes. 2008;32:1031–1033. doi: 10.1038/ijo.2008.42. [DOI] [PubMed] [Google Scholar]
- Flint A, Raben A, Blundell JE, Astrup A. Reproducibility, power and validity of visual analogue scales in assessment of appetite sensations in single test meal studies. Int J Obes Relat Metab Disord. 2000;24:38–48. doi: 10.1038/sj.ijo.0801083. [DOI] [PubMed] [Google Scholar]
- Hill AJ, Blundell JE. Nutrients and Behavior - Research Strategies for the Investigation of Taste Characteristics, Food Preferences, Hunger Sensations and Eating Patterns in Man. J Psych Res. 1983;17:203–212. doi: 10.1016/0022-3956(82)90023-1. [DOI] [PubMed] [Google Scholar]
- Stubbs RJ, Hughes DA, Johnstone AM, et al. Description and evaluation of a Newton-based electronic appetite rating system for temporal tracking of appetite in human subjects. Phys & Behav. 2001;72:615–619. doi: 10.1016/s0031-9384(00)00440-6. [DOI] [PubMed] [Google Scholar]
- Wooley OW, Wooley SC, Dunham RB. Can calories be perceived and do they affect hunger in obese and nonobese humans? J Comp Physiol Psychol. 1972;80:250–258. doi: 10.1037/h0033069. [DOI] [PubMed] [Google Scholar]
- Brunstrom JM, Brown S, Hinton EC, Rogers PJ, Fay SH. ‘Expected satiety’ changes hunger and fullness in the inter-meal interval. Appetite. 2011;56:310–315. doi: 10.1016/j.appet.2011.01.002. [DOI] [PubMed] [Google Scholar]
- Crum AJ, Corbin WR, Brownell KD, Salovey P. Mind over milkshakes: mindsets, not just nutrients, determine ghrelin response. Health Psychol. 2011;30:424–429. doi: 10.1037/a0023467. discussion 430-421. [DOI] [PubMed] [Google Scholar]
- Tieken SM, Leidy HJ, Stull AJ, Mattes RD, Schuster RA, Campbell WW. Effects of solid versus liquid meal-replacement products of similar energy content on hunger, satiety, and appetite-regulating hormones in older adults. Horm Metab Res. 2007;39:389–394. doi: 10.1055/s-2007-976545. [DOI] [PMC free article] [PubMed] [Google Scholar]
- Bolhuis DP, Lakemond CMM, de Wijk RA, Luning PA, de Graaf C. Both Longer Oral Sensory Exposure to and Higher Intensity of Saltiness Decrease Ad Libitum Food Intake in Healthy Normal-Weight Men. Journal of Nutrition. 2011;141:2242–2248. doi: 10.3945/jn.111.143867. [DOI] [PubMed] [Google Scholar]
- Zijlstra N, de Wijk RA, Mars M, Stafleu A, de Graaf C. Effect of bite size and oral processing time of a semisolid food on satiation. Am J Clin Nutr. 2009;90:269–275. doi: 10.3945/ajcn.2009.27694. [DOI] [PubMed] [Google Scholar]
- de Graaf C. Why liquid energy results in overconsumption. Proceedings Nutr Soc. 2011;70:162–170. doi: 10.1017/S0029665111000012. [DOI] [PubMed] [Google Scholar]
- Sorensen LB, Moller P, Flint A, Martens M, Raben A. Effect of sensory perception of foods on appetite and food intake: a review of studies on humans. Int J Obes Relat Metab Disord. 2003;27:1152–1166. doi: 10.1038/sj.ijo.0802391. [DOI] [PubMed] [Google Scholar]
- Viskaal-van Dongen M, Kok FJ, de Graaf C. Eating rate of commonly consumed foods promotes food and energy intake. Appetite. 2011;56:25–31. doi: 10.1016/j.appet.2010.11.141. [DOI] [PubMed] [Google Scholar]
- Hogenkamp PS, Mars M, Stafleu A, de Graaf C. Intake during repeated exposure to low-and high-energy-dense yogurts by different means of consumption. Am J Clin Nutr. 2010;91:841–847. doi: 10.3945/ajcn.2009.28360. [DOI] [PubMed] [Google Scholar]
- Mattes RD. Physiologic responses to sensory stimulation by food: nutritional implications. J Am Diet Assoc. 1997;97:406–413. doi: 10.1016/S0002-8223(97)00101-6. [DOI] [PubMed] [Google Scholar]
- Peters HPF, Koppert RJ, Boers HM, et al. Dose-Dependent Suppression of Hunger by a Specific Alginate in a Low-Viscosity Drink Formulation. Obesity. 2011;19:1171–1176. doi: 10.1038/oby.2011.63. [DOI] [PubMed] [Google Scholar]
- Mattes RD, Rothacker D. Beverage viscosity is inversely related to postprandial hunger in humans. Physiol Behav. 2001;74:551–557. doi: 10.1016/s0031-9384(01)00597-2. [DOI] [PubMed] [Google Scholar]
- Powley TL, Phillips RJ. Gastric satiation is volumetric, intestinal satiation is nutritive. Physiology & Behavior. 2004;82:69–74. doi: 10.1016/j.physbeh.2004.04.037. [DOI] [PubMed] [Google Scholar]
- Phillips RJ, Powley TL. Gastric volume rather than nutrient content inhibits food intake. Am J Physiol. 1996;271:R766–769. doi: 10.1152/ajpregu.1996.271.3.R766. [DOI] [PubMed] [Google Scholar]
- Park MI, Camilleri M. Gastric motor and sensory functions in obesity. Obes Res. 2005;13:491–500. doi: 10.1038/oby.2005.51. [DOI] [PubMed] [Google Scholar]
- Torres SJ, Nowson CA. Relationship between stress, eating behavior, and obesity. Nutrition. 2007;23:887–894. doi: 10.1016/j.nut.2007.08.008. [DOI] [PubMed] [Google Scholar]
- Desai MN, Miller WC, Staples B, Bravender T. Risk factors associated with overweight and obesity in college students. J Amer Coll Health. 2008;57:109–114. doi: 10.3200/JACH.57.1.109-114. [DOI] [PubMed] [Google Scholar]
- Rolls BJ. The relationship between dietary energy density and energy intake. Physiology & Behavior. 2009;97:609–615. doi: 10.1016/j.physbeh.2009.03.011. [DOI] [PMC free article] [PubMed] [Google Scholar]
- Rolls BJ, Bell EA, Castellanos VH, Chow M, Pelkman CL, Thorwart ML. Energy density but not fat content of foods affected energy intake in lean and obese women. American Journal of Clinical Nutrition. 1999;69:863–871. doi: 10.1093/ajcn/69.5.863. [DOI] [PubMed] [Google Scholar]
- Leahy KE, Birch LL, Rolls BJ. Reducing the energy density of multiple meals decreases the energy intake of preschool-age children. American Journal of Clinical Nutrition. 2008;88:1459–1468. doi: 10.3945/ajcn.2008.26522. [DOI] [PubMed] [Google Scholar]
- Almiron-Roig E, Drewnowski A. Hunger, thirst, and energy intakes following consumption of caloric beverages. Phys & Behav. 2003;79:767–773. doi: 10.1016/s0031-9384(03)00212-9. [DOI] [PubMed] [Google Scholar]
- Bell EA, Roe LS, Rolls BJ. Sensory-specific satiety is affected more by volume than by energy content of a liquid food. Phys & Behav. 2003;78:593–600. doi: 10.1016/s0031-9384(03)00055-6. [DOI] [PubMed] [Google Scholar]
- Tepper BJ, Mattes RD, Farkas BK. Learned flavor cues influence food intake in humans. Journal of Sensory Studies. 1991;6:89–100. [Google Scholar]
- Louis-Sylvestre J, Tournier A, Verger P, Chabert M, Delorme B, Hossenlopp J. Learned caloric adjustment of human intake. Appetite. 1989;12:95–103. doi: 10.1016/0195-6663(89)90099-8. [DOI] [PubMed] [Google Scholar]
- Bertino M, Beauchamp GK, Engelman K. Increasing dietary salt alters salt taste preference. Physiol Behav. 1986;38:203–213. doi: 10.1016/0031-9384(86)90155-1. [DOI] [PubMed] [Google Scholar]
- Mattes RD. Fat Preference and Adherence to a Reduced-Fat Diet. American Journal of Clinical Nutrition. 1993;57:373–381. doi: 10.1093/ajcn/57.3.373. [DOI] [PubMed] [Google Scholar]
- Swithers SE, Davidson TL. A role for sweet taste: Calorie predictive relations in energy regulation by rats. Behav Neuro. 2008;122:161–173. doi: 10.1037/0735-7044.122.1.161. [DOI] [PubMed] [Google Scholar]
- Soenen S, Westerterp-Plantenga MS. No differences in satiety or energy intake after high-fructose corn syrup, sucrose, or milk preloads. American Journal of Clinical Nutrition. 2007;86:1586–1594. doi: 10.1093/ajcn/86.5.1586. [DOI] [PubMed] [Google Scholar]
- Monsivais P, Perrigue MM, Drewnowski A. Sugars and satiety: does the type of sweetener make a difference? Am J Clin Nutr. 2007;86:116–123. doi: 10.1093/ajcn/86.1.116. [DOI] [PubMed] [Google Scholar]