

Abstract
The aim of the present study was to evaluate the in vitro anti-cancer and anti-oxidant potential of methanol extract of Blumea eriantha as well as its phytochemical characterization. The in vitro cytotoxic and antiproliferative activities of B. eriantha methanolic extract of leaves were evaluated using MTT assay on HeLa and B16F10 cell lines, and wound scratch and colony formation assays on B16F10 cell lines. The expressions of p53 and Bcl-2 genes were also determined by reverse transcriptase-polymerase chain reaction to establish apoptosis. Isolation and identification of chemical constituents were carried out by various chromatographic and spectroscopic analytical techniques including HPTLC and LC-MS. The methanol extract of the leaves of B. eriantha showed potent in vitro antioxidant and anticancer properties. Moreover, the extract showed significant loss of wound healing, thus suggesting that it could prevent a possible metastasis. Hence, B. eriantha could be explored as a potential anticancer plant with antimetastatic properties.
Keywords: Apoptosis, Blumea eriantha, Cancer, Chromatography, Cytotoxicity, LC-MS
Introduction
Phytochemicals are known to reduce the risk of chronic diseases such as cancer, cardiovascular diseases, diabetes, Alzheimer’s disease, and various inflammatory disorders (Liu 2003; Shahidi et al. 2008). More than 5,000 phytochemicals have been screened and identified so far, but a large number still remain unknown and are needed to be identified before their desirable benefits are conclusively established. Human beings are constantly exposed to various oxidizing agents which generate oxidative stress and leads to redox imbalance causing damage to proteins, DNA, and lipids (Marxen et al. 2007). Researches have established that synthetic molecules are associated with toxicity and hence natural antioxidants such as polyphenolic compounds from plant origin are preferable. These molecules can donate electrons to reactive oxygen species and neutralize them (Sharma et al. 2009; Stanojević et al. 2009). Plant phenols are reported to have significant antioxidant, antitumor, antiviral and antibiotic activities (Apak et al. 2007). Several compounds extracted from plant sources such as camptothecin, vincristine, vinblastine, taxol and podophyllotoxin have been successfully identified as effective anticancer agents (Azizi et al. 2009; Pezzuto 1997; Srivastava et al. 2005).
Studies conducted on different species of Blumea, mainly Blumea mollis (Srikanth et al. 2012) and Blumea balsamifera (Saewan et al. 2011), have exhibited cytotoxic activity against cancer cells. The plant in the present study, Blumea eriantha DC is a small annual herb, up to 1 m in height, possessing camphor like smell and is commonly found in tropical countries. Juice of this herb is used as a ‘carminative’. The essential oil extracted from the leaves and stem show potent antibacterial, antifungal and insecticidal properties (Khare 2007; Singh et al. 2011). This plant has been traditionally used as a diuretic and also for the treatment of cholera and diarrhea (Khare 2007; Singh and Parthasarathy 2012). However, there have been no studies on the in vitro anticancer properties of Blumea eriantha so far.
In the present study, we have investigated the antioxidant potency and cytotoxic activities of B. eriantha DC. leaf extract on cancer cell lines. Additionally, a preliminary screening of the chemical constituents was carried out using various chromatographic and spectroscopic techniques including HPTLC and LC-MS.
Materials and methods
Chemicals
All solvents and chemicals were of analytical grade and obtained from local suppliers. Ascorbic acid, aluminum chloride, 1, 1-diphenyl-2-picrylhydrazyl (DPPH), ferric chloride, Folin-Ciocalteu reagent, potassium acetate, sodium carbonate, 2,4,6-tripyridyl-s- triazine (TPTZ), trichloroacetic acid, 3-(4,5-Dimethythiazol-2-yl)-2, 5-diphenyl tetrazolium bromide (MTT) and Dulbecco’s modified Eagle’s minimum essential medium (DMEM) were purchased from Sigma Chemical Co., USA. 10 % fetal bovine serum (FBS) was procured from Gibco. Glacial acetic acid (HPLC grade) and methanol (HPLC grade) were purchased from Merck.
Plant material
B. eriantha DC. (Asteraceae) plants were collected from Kolhapur, Maharashtra, India. The identity of the plant was authenticated by Dr. Manoj Lekhak, a taxonomist from Department of Botany, Shivaji University, Kolhapur, India. A voucher specimen of the plant (MG1 and MG2) has been prepared and deposited at the herbarium in the Botany department, Shivaji University, Kolhapur, India. Leaves of B. eriantha are lower obovate, short petiolated, upper elliptic- ovate to oblanceolate with dense silky hairy on both the surfaces (Singh et al. 2011).
Extraction and isolation
The fresh leaves were collected, cleaned with water and air dried at the room temperature in a well ventilated and sterilized room. The dried leaves were powdered using a grinder. Leaf powder (1 g) was extracted with 25 ml of methanol, ethanol and distilled water separately for 6 h using Soxhlet apparatus. Extracts were centrifuged at 15,000 rpm for 10 min; the supernatants were recovered and filtered using Whatman No.1 paper. The extracts were evaporated to dryness under reduced pressure by a rotatory evaporator (Rotavapor). These extracts were used for the antioxidant assays. However, the cytotoxicity assays on HeLa and B16F10 cell lines were done using the methanolic extract.
Antioxidant assays
DPPH radical scavenging activity
Antioxidant activity of the extracts was evaluated by 1,1-diphenyl-2-picrylhydrazyl (DPPH) assay (Lee et al. 2003; Chen et al. 2005). The stock reagent solution was prepared by dissolving 24 mg of DPPH in 100 ml methanol. The working solution was obtained by mixing 10 ml of stock solution with 45 ml methanol. The different concentrations of the extracts were allowed to react with 3 ml of DPPH solution. The mixture was shaken and allowed to stand at the room temperature for 30 min in the dark. The absorbance was measured at 517 nm using a spectrophotometer. A control sample, having no extract was also included and the results were expressed as radical scavenging activity (% RSA).
 |
Where, A = absorbance at 517 nm.
The results were compared with a standard curve of ascorbic acid.
Ferric ion reducing antioxidant power assay (FRAP assay)
The FRAP assay was performed with some modifications (Benzie and Strain 1996). The FRAP reagent was produced by mixing 300 mM acetate buffer (pH 3.6), 10 mM 2,4,6-tripyridyl-s-triazine (TPTZ) in 40 mM HCL and 20 mM FeCl3· 6H2O in 10:1:1 ratio prior to use and heated to 37 °C in water bath for 10 min. The extracts of various concentrations were allowed to react with 2.7 ml of the FRAP reagent. The final volume of the reaction mixture was made up to 3 ml with distilled water. The reaction mixture was kept in the dark for 30 min. The absorbance was measured at 593 nm using a spectrophotometer (Svilaas et al. 2004).
Determination of total phenolic content
Folin-Ciocalteu reagent was used for the determination of total phenolic content. The extracts were mixed with Folin-Ciocalteu reagent and aqueous sodium carbonate. The mixtures were kept for 90 min at room temperature and absorbance was measured at 765 nm using a spectrophotometer (Connor et al. 2002; Singleton and Rossi 1965). This was compared to the standard curve of Gallic acid concentrations and expressed as mg of Gallic acid equivalents per g (mg GAE g−1) (Sengul et al. 2009).
Analysis of total flavonoids content (TFC)
The extracts were mixed with methanol, to which 10 % aluminum chloride, 1 M potassium acetate and distilled water were added. The solution was vortexed, allowed to stand for 30 min at room temperature. The absorbance of reaction mixture was measured at 415 nm using a spectrophotometer (Chang et al. 2002; Hsu 2006; Huang et al. 2005). The total flavonoids content was quantified according to the standard curve prepared for rutin and the concentration of flavonoids was reported as mg of rutin equivalents per g (mg RE g−1).
In vitro anticancer assays
Cell culture
HeLa and B16F10 melanoma cell lines were obtained from National Centre for Cell Science (Pune, India). HeLa cells and B16F10 melanoma cells were cultured in DMEM (Dulbecco’s modified Eagle’s medium) supplemented with 10 % heat inactivated fetal bovine serum, 100 (U) units/ml penicillin and 100 μg/ml streptomycin. The cells were incubated in an incubator with 5 % CO2 at 37 °C.
Cytotoxicity assay of methanolic extract using MTT on HeLa and B16F10 cell lines
Ninety-six well plates were seeded with HeLa cells and B16F10 cells with a seeding density of 2 × 10³ cells per well and 3 × 10³ cells per well respectively and allowed to adhere for 24 h before treatment. After 24 h. incubation period, the plant extract was dissolved in 0.1 % DMSO and was serially diluted with DMEM supplemented with 10 % FBS and was added to the cells. Vehicle control wells contained 0.1 % DMSO + DMEM+ 10 % FBS. Negative control contained only DMEM+ 10 % FBS. Doxorubicin (10 μg/ml), a conventional cytotoxic agent, was used as standard positive control. After 48 h, 20 μl of 5 mg/ml MTT was added to all the wells. The plates were incubated for 4 h after which 100 μl of DMSO was added to all the wells. The absorbance was measured at 570 nm using a spectrophotometer (Mosmann 1983).
Wound scratch assay
B16F10 cells were seeded in 6 well plates with a seeding density of 0.4 × 10⁶ cells per well and allowed to adhere at 37 °C with 5 % CO2 for 24 h. 2 sets of plates were used for the experiment. The scratch wound was introduced by scraping the monolayer in a perpendicular direction with a 200 μl pipette tip in all the plates. The cells were washed very gently with PBS. In the first set of plates, the extract was added corresponding to the IC50 value i.e. 841.84 μg/ml. The second set of plates contained only medium (DMEM supplemented with 10 % FBS) and served as control. The plates were placed in incubator at 37 °C with 5 % CO2 for 48 h. Pictures of fixed positions in the wound were taken with a digital camera mounted on an inverted microscope at the time of wounding and 48 h after addition of the extract. The wound area was then determined, after outlining the wound and measuring the area using Image J imaging software developed by NIH (Abramoff et al. 2004). The width was measured at 5 points along the scratch area and then an average was determined. The percentages of wound closure were calculated as: [(Mean width of wound at the time of wounding- mean width of wound after 48 h)/ Mean width of wound at the time of wounding] × 100 (Liang et al. 2007).
Colony formation assay
To study the effect of the extract on colony formation, subconfluent B16F10 cells were trypsinized and plated at a density of 750 cells/plate in 35 mm plates (2 sets). The plates were placed in an incubator with 5 % CO2 at 37 °C and allowed to adhere for 24 h before treatment. After 24 h, the extract equivalent to the IC50 value i.e. 841.84 μg/ml was added to 1 set of plates and the other set of plates without the extract served as a negative control. The cells were then incubated for 7 days and colonies were allowed to form. After 7 days, the plates were washed with PBS, fixed in methanol for 5 min, stained with 0.01 % crystal violet for 30 min and the number of colonies was determined by direct counting under a microscope (Franken et al. 2006).
RNA extraction and semi quantitative RT-PCR analysis
B16F10 cells were plated in a 6 well plate with a seeding density of 0.4 × 10⁶ cells per well. The plates were placed in an incubator with 5 % CO2 at 37 °C for 24 h for the cells to adhere. After 24 h, each plate was treated separately with the plant extract (equivalent to the IC50 value i.e. 841.84 μg/ml), doxorubicin (50 μg/ml) as a positive control and DMEM with 10 % FBS as a negative control. Then, after 48 h, RNA isolation was done from all the 3 sets of plates using the Trizol reagent (Invitrogen) according to the manufacturer’s instructions. cDNA was synthesized from 2 μg of total isolated RNA by incubation for 1 h at 42 °C with 1 μl of reverse transcriptase, 2 μl oligo(dT) primer, 2 μl RNase inhibitor, 2 μl of dNTPs and 4 μl (5×) reaction buffer. Then, 2 μl of the reaction mixture was subjected to PCR for amplification of p53 and Bcl-2 cDNAs using gene specific primers (p53 Forward: 5′-C T G A G G T T G G C T C T G A C T G T A C C A C C A T C C-3′; p53 Reverse: 5′-C T C A T T C A G C T C T C G G A A C A T C T C G A A G C G-3′ and Bcl-2 Forward: 5′-G T T C G G T G G G G T C A T G T G T G T G G A G A-3′; Bcl-2 Reverse: 5′-G C T G A T T C G A C G T T T T G C C T G A A G A C-3′). As an internal control, the house keeping gene β-Actin (β-Actin Forward: 5′-A C G G G G T C A C C C A C A C T G T G C-3′; β-Actin Reverse: 5′-C T A G A A G C A T T T G C G G T G G A C G A T G-3′) was co-amplified in each reaction. The PCR reactions was carried out in a final volume of 50 μl containing 10× PCR buffer and 0.5 μl Taq-polymerase, 10 mM of each dNTP and 10 μM of each primer. The template was denatured for 2 min at 94 °C, followed by amplification cycles at 94 °C for 1 min, (69 °C for p53, 64 °C for Bcl-2 and 57 °C for β-actin) for 1 min and 72 °C for 1.20 min, and terminated with an additional extension step for 8 min at 72 °C. The PCR products were loaded on 1.2 % agarose gel, stained with ethidium bromide and subjected to gel electrophoresis. In negative control, DEPC water was used in place of template cDNA (Azizi et al. 2009).
Separation of compounds by HPTLC
Sample preparation
The extract (1.553 g DW) was dissolved methanol (5 ml) and used as test solution for HPTLC analysis.
Sample application
Two microliter of test solution was loaded as 8 mm band length in the 10 cm × 20 cm LiChropher Silica gel 60F254S plate using 100 μl Hamilton syringe and CAMAG LINOMAT 5 instrument which was programmed through WIN CATS software. Several such tracks were loaded to elute the bands.
Spot development
The sample loaded plate was kept and developed in TLC twin trough developing chamber (after saturated with Solvent vapor) with mobile phase, Toluene-Chloroform-Ethanol (4: 4: 1).
Photo-documentation
The developed plate was dried by hot air to evaporate solvents from the plate. The plate was kept in the Photo-documentation chamber (CAMAG REPROSTAR 3) and the images were captured at white light, UV 254 nm and UV 366 nm.
Scanning
The plate was fixed in a scanner stage (CAMAG TLC SCANNER 3) and scanning was done at UV light of 254 nm. The Peak table, Peak display and chromatogram were noted (Sampathkumar and Ramakrishnan 2011).
Elution
Nine bands were scraped off from the plates, eluted with methanol and used for further assays.
Cytotoxicity assay of eluted bands using MTT on B16F10 cell lines
A 96 well plate was seeded with B16F10 cells with a seeding density of 3 × 10³ cells per well. After 24 h incubation, the eluted bands were serially diluted and added to the cells. MTT assay was performed as described above.
Sample analysis by LC-MS
LC-MS analysis was conducted using Agilent 6540 UHD QTOF LC-MS coupled to the 1,290 Infinity UHPLC (Agilent Technologies Inc., Bangalore, India). Zorbax SB-Aq, 3.0 × 100 mm; 3.5 μM column (Agilent 1,290 Infinity Binary pump, well plate autosampler, thermostatted column compartment) with a flow rate of 0.6 ml/min was used. MS with both positive and negative modes was used (Agilent 6540 UHD QTOF LC/MS/MS). Conditions for LC/MS/MS in both negative and positive ion mode included a capillary voltage of 3,500 V, nozzle voltage of 1,000 V, a nebulizing pressure of 30 psi, a drying gas flow of 10 L/min, and at 250 °C. Mass range was 50–1,700 m/z. MassHunter Molecular Feature Extractor (MFE) tool was used to extract the list of compounds present in the samples. The data (both positive and negative modes) was exported into Agilent Mass Profiler Professional (MPP) software to filter any background masses from system compared with blank injection. The compounds filtered through MPP which were specific for the individual sample were searched against the METLIN Personal Compound Database (PCD) with a tolerance level of 10 ppm (Ian et al. 2005).
Statistical analysis
In this study, all the observations were taken in triplicate. The mean values and standard deviations were calculated from the data obtained. Values representing the concentration of investigated extracts that cause 50 % of inhibition (IC50) were determined by using the software GraFit, by Erithacus Software limited, version 7.0.2. and Microsoft excel add on ed50v10. Statistical analyses were performed using Graph pad software. Statistical analysis between treatment and control (wound scratch and colony formation assays) was determined using unpaired two-tailed Student’s t-test. P-values < 0.05 were considered significantly different from the control group. Statistical comparisons between the responses to doses of a test agent and control (MTT assay) were made using one way analysis of variance (ANOVA). When ANOVA demonstrated a significant difference between groups, a Tukey’s test was performed to identify the doses that have induced a response relative to no treatment control.
Results and discussion
Antioxidant effect of the extract using DPPH radical scavenging activity and ferric ion reducing antioxidant power assay
The DPPH assay comprises the use of a stable free radical, 1,1-diphenyl-2- picrylhydrazyl. This is a simple, rapid and convenient method for screening of many samples for radical scavenging activity. In its oxidized form, the DPPH radical has an absorbance maximum centered at about 520 nm and is blue in color (Marxen et al. 2007). It becomes colorless or pale yellow when neutralized which can be measured spectrophotometrically (Marxen et al. 2007). The DPPH free radical scavenging activity (RSA) of the different extracts has been depicted in Fig. 1. The % RSA was maximum in methanolic (97.90 ± 0.24 %) followed by ethanolic (97.84 ± 0.79 %) and aqueous (89.67093 ± 1.45 %) extracts respectively.
Fig. 1.

DPPH radical scavenging activity of leaf extract of B. eriantha in different solvent systems, data expressed in mean ± SD, n = 3
FRAP is a simple, automated method for assessing the antioxidant activity of compounds. At low pH, when a ferric-tripyridyltriazine (Fe III-TPTZ) complex is reduced to the ferrous (Fe II) form, by antioxidants, an intense blue color with an absorption maximum at 593 nm develops (Benzie and Strain 1996). Thus, the antioxidant activity of a sample can be measured. The FRAP assay revealed that the methanolic extract had the maximum reducing capacity followed by the ethanolic extract and aqueous extracts (Fig. 2).
Fig. 2.

FRAP assay of leaf extract of B. eriantha in different solvent systems, data expressed in mean ± SD, n = 3
Estimation of total phenolic and total flavonoid contents
Phenols and polyphenolic compounds are widely found in plant sources, and have been shown to possess significant antioxidant activities (Ghasemi et al. 2009). The Folin-Ciocalteu reagent is sensitive to reducing compounds including polyphenols, thereby producing a blue color upon reaction, which can be measured using a spectrophotometer. Thus total phenolic content can be determined (Mongkolsilp et al. 2004). The total phenolic content in the different solvent systems is shown in Table 1. The total phenolic content was maximum in methanolic (1.345 mg GAE g ¯1), followed by ethanolic (1.092 mg GAE g¯1) and aqueous (0.935 mg GAE g¯1) extracts respectively.
Table 1.
Total phenolic and flavonoid contents of the leaf extract of B. eriantha in different solvent systems
| Total phenol content (mg GAE/g) | Total flavonoid content (mg RE/g) | |
|---|---|---|
| Methanol | 1.345 ± 0.083 | 7.729 ± 0.037 |
| Ethanol | 1.092 ± 0.022 | 5.164 ± 0.120 |
| Aqueous | 0.935 ± 0.104 | 2.029 ± 0.005 |
Data shown as mean± SD, n = 3
Flavonoids are a group of polyphenolic compounds naturally occurring in plants. Studies have established that flavonoids have biological properties which can lower the risk of coronary heart disease, neurodegenerative diseases, osteoporosis, and lung cancer (Lampila et al. 2009; Yao et al. 2004). The total flavonoid content in the different solvent systems is presented in Table 1. The absorbance obtained spectrophotometrically was compared to the standard curve of rutin concentrations and expressed as mg of rutin equivalents per g (mg RE g¯1). The total flavonoid content was maximum in methanolic (7.729 mg RE g ¯1), followed by ethanolic (5.164 mg RE g¯1) and aqueous (2.029 mg RE g¯1) extracts respectively.
Cytotoxic effect of the extract on HeLa cells and B16F10 cells
The MTT assay is a colorimetric assay which measures changes in color to measure the activity of enzymes that reduce MTT to formazan, giving a purple color. Yellow MTT (3-(4, 5-dimethylthiazol-2-yl) - 2, 5-diphenyltetrazolium bromide, a tetrazole) reduces to purple formazan in living cells (Nisa et al. 2011). It is used to determine cytotoxicity of potential medicinal agents.
The cytotoxicity of the extract on HeLa cells and B16F10 cells expressed as % inhibition of the cells with different concentrations of the extract is shown in Figs. 3 and 4. The IC50 value of the extract on HeLa cells was 782.25 μg/ml and on B16F10 cells it was 841.84 μg/ml. The apoptotic cells can be seen in Fig. 5. Studies have been done on other species of Blumea, to determine their anticancer properties. A study done on methanolic extract of Blumea mollis (MTT assay) has reported that the IC50 value on SK-MEL-28 cell lines was 6.31 mg/ml and 4.45 mg/ml on NCI-H- 23 cell lines (Srikanth et al. 2012). It is evident from the results, that the methanolic extract of Blumea eriantha has more potent cytotoxic effect as compared to Blumea mollis.
Fig. 3.

MTT assay on HeLa cell line showing cytotoxicity of the serially diluted methanolic leaf extracts of B. eriantha. % inhibition of cells increases with increasing concentration of the extract. IC50 value is 782.25 μg/ml
Fig. 4.

MTT assay on B16F10 cell line showing cytotoxicity of the serially diluted methanolic leaf extracts of B. eriantha. IC50 value is 841.84 μg/ml
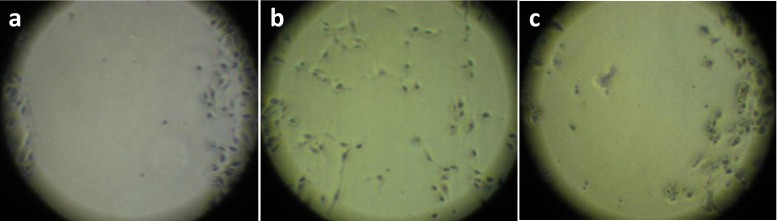
Fig. 5.

MTT assay on B16F10 cells using methanolic leaf extracts of B. eriantha. a Control well with no cell death b well with extract concentration of 1 mg/ml showing a few crystals (viable cells) (c and d) wells with extract concentration of 2 mg/ml and 4 mg/ml respectively showing apoptotic cells
Inhibition of cancer cell migration
Wound scratch assay or cell migration inhibition assay is a relatively simple and economical in vitro assay which establishes arrest in the cell proliferation and migration. It also mimics to some extent the migration of the cells in vivo (Rodriguez et al. 2005). Cell migration is initiated upon a scratch wound, which is followed by growth of cells at the edges of the wound in a direction perpendicular to the scratch wound. The extract of interest was added and images were captured after 24 h or 48 h interval. The migration of the cells was compared with those in control wells. The percentage of wound closure in control plates was approximately 34.41 % and in the plates in which the extract was added it was 1.5 %. The cells at the edges of the wound in extract treated plates exhibited apoptotic changes (Fig. 6).
Fig. 6.
Wound scratch assay on B16F10 cells using methanolic leaf extracts of B. eriantha. a scratch wound at time of scratching, t = 0 b control plate 48 h after wounding, 34.41 % wound closure c test plate with 841.84 μl/ml (IC50 value) of extract 48 h after wounding, 1.5 % wound closure
Inhibition of colony formation
Clonogenic assay or colony formation assay is an in vitro cell survival assay based on the ability of a single cell to grow into a colony. Effectiveness of cytotoxic agents can be determined using this assay (Franken et al. 2006). The mean number of colonies in the treated plates were compared with the mean number of colonies in the untreated plates (colony count= T/C × 100). A compound was considered active if it reduced the colony formation to less than 30 % of the control group value (T/C ≤ 30 %) (Drees et al. 1997). The colonies in the treated plates were 0 % as compared to the control group which is less than 30 %. This suggests that the extract inhibits colony formation. The number of colonies after 7 days have been depicted in Table 2.
Table 2.
Colony formation assay on B16F10 cells: Number of colonies after 7 days in control group and test group with 841.84 μl/ml (IC50 value) of methanolic leaf extract of B. eriantha
| Treatment | Number of cells seeded | Number of colonies (after 7 days) |
|---|---|---|
| Negative control | 750 | 16 ± 1.52 |
| Test plate with extract | 750 | 0 ± 0 |
Data shown as mean± SD, n = 3
Colonies in test group statistically significantly reduced as per Student’s paired t test.
Confirmation of apoptosis by semiquantitative RT-PCR analysis
Reverse Transcription-Polymerase Chain Reaction (RT-PCR) is a highly sensitive and specific method which can quantify specific RNA transcripts and detect expression level variation under different experimental conditions (Marone et al. 2001). The mRNA expression levels of p53 and Bcl-2 were carried out using semi-quantitative RT-PCR. The PCR products were analyzed using Image J software developed by NIH. The ratio between the sample RNA to be determined and the housekeeping gene β actin was calculated to normalize for initial variations in sample concentration and as control for reaction efficiency. The level of proapoptotic gene p53 is upregulated and antiapoptotic gene Bcl-2 is downregulated after addition of the extract as is evident from Fig. 7. The fold change ratio of sample: medium for p53 and Bcl-2 was 1.22 and 0.064 respectively.
Fig. 7.

Expression of housekeeping gene β actin, apoptotic gene p53 and antiapoptotic gene Bcl-2 in B16F10 cells treated with methanolic leaf extract of B. eriantha for 48 h. p53 level is upregulated and Bcl-2 is downregulated compared to negative control and doxorubicin. Representative data from three individual analyses have been shown here
Separation and elution of compounds using HPTLC
High performance thin layer chromatography (HPTLC) is an inexpensive method for separation, qualitative identification or semi quantitative analysis of samples (Patel et al. 2012). HPTLC revealed several peaks as recorded in Table 3. The corresponding HPTLC chromatogram is presented in Fig. 8. The Rf values are in the range of 0.05 to 0.92. From the HPTLC plates, 9 bands were scraped, eluted with methanol and each band was tested for cytotoxicity by MTT assay. LC-MS was conducted on each band.
Table 3.
HPTLC profile of the methanolic leaf extract of B. eriantha
| Peak | Start position | Start height | Max position | Max height | Max % | End position | End height | Area | Area % |
|---|---|---|---|---|---|---|---|---|---|
| 1 | 0.05 Rf | 2.3 AU | 0.05 Rf | 28.8 AU | 1.19 % | 0.06 Rf | 23.7 AU | 251.0 AU | 0.48 % |
| 2 | 0.06 Rf | 24.7 AU | 0.07 Rf | 36.6 AU | 1.52 % | 0.09 Rf | 1.5 AU | 419.9 AU | 0.81 % |
| 3 | 0.09 Rf | 1.3 AU | 0.11 Rf | 49.3 AU | 2.04 % | 0.12 Rf | 0.8 AU | 573.9 AU | 1.10 % |
| 4 | 0.13 Rf | 0.2 AU | 0.15 Rf | 59.8 AU | 2.48 % | 0.16 Rf | 12.3 AU | 701.7 AU | 1.35 % |
| 5 | 0.16 Rf | 13.0 AU | 0.17 Rf | 36.5 AU | 1.51 % | 0.18 Rf | 30.2 AU | 403.1 AU | 0.77 % |
| 6 | 0.18 Rf | 31.2 AU | 0.19 Rf | 55.2 AU | 2.29 % | 0.20 Rf | 40.1 AU | 588.9 AU | 1.13 % |
| 7 | 0.20 Rf | 40.1 AU | 0.22 Rf | 106.2 AU | 4.40 % | 0.24 Rf | 75.0 AU | 2429.9 AU | 4.66 % |
| 8 | 0.26 Rf | 83.2 AU | 0.28 Rf | 154.5 AU | 6.40 % | 0.29 Rf | 115.4 AU | 3496.9 AU | 6.71 % |
| 9 | 0.29 Rf | 115.4 AU | 0.32 Rf | 243.4 AU | 10.09 % | 0.34 Rf | 121.8 AU | 5304.1 AU | 10.17 % |
| 10 | 0.34 Rf | 121.9 AU | 0.37 Rf | 567.1 AU | 23.50 % | 0.43 Rf | 4.7 AU | 15176.9 AU | 29.10 % |
| 11 | 0.43 Rf | 5.1 AU | 0.46 Rf | 232.2 AU | 9.62 % | 0.47 Rf | 138.7 AU | 4158.6 AU | 7.97 % |
| 12 | 0.48 Rf | 139.5 AU | 0.48 Rf | 148.1 AU | 6.14 % | 0.50 Rf | 117.4 AU | 2040.1 AU | 3.91 % |
| 13 | 0.50 Rf | 118.6 AU | 0.51 Rf | 134.7 AU | 5.58 % | 0.54 Rf | 13.2 AU | 2437.6 AU | 4.67 % |
| 14 | 0.54 Rf | 13.2 AU | 0.58 Rf | 59.7 AU | 2.48 % | 0.59 Rf | 54.9 AU | 1344.1 AU | 2.58 % |
| 15 | 0.59 Rf | 55.6 AU | 0.63 Rf | 335.1 AU | 13.89 % | 0.67 Rf | 3.4 AU | 8504.4 AU | 16.31 % |
| 16 | 0.67 Rf | 3.4 AU | 0.71 Rf | 58.8 AU | 2.44 % | 0.73 Rf | 0.0 AU | 1210.7 AU | 2.32 % |
| 17 | 0.80 Rf | 7.0 AU | 0.84 Rf | 83.2 AU | 3.45 % | 0.89 Rf | 3.0 AU | 2449.7 AU | 4.70 % |
| 18 | 0.89 Rf | 3.3 AU | 0.92 Rf | 23.9 AU | 0.99 % | 0.95 Rf | 5.2 AU | 659.0 AU | 1.26 % |
Fig. 8.

HPTLC chromatogram of methanolic leaf extract of Blumea eriantha showing different peaks of phytoconstituents
Cytotoxic effect of the eluted bands on B16F10 cancer cell line
MTT assay was performed on 9 bands eluted after HPTLC. All the bands exhibited positive cytotoxicity. The IC50 values of the bands have been explained in Table 4. Bands 5 and 6 exhibited a more potent cytotoxic effect with IC50 values of 87.18 μg/ml and 76.31 μg/ml respectively. A study done by Saewan et al., on methanolic extract of Blumea balsamifera in which 3 flavonoids were isolated which had cytotoxic effect on KB cells with IC50 value of 17.09, 47.72 and 17.83 μg/ml, however, there was no effect on MCF7 cells (Saewan et al. 2011). In this study, bands 3 and 6 have comparable effects as that of the flavonoids isolated from Blumea balsamifera.
Table 4.
Cytotoxicity assay (MTT assay) done on B16F10 cells using 9 bands of methanolic leaf extract of B. eriantha eluted by HPTLC
| HPTLC bands | Band 1 | Band 2 | Band 3 | Band 4 | Band 5 | Band 6 | Band 7 | Band 8 | Band 9 |
|---|---|---|---|---|---|---|---|---|---|
| IC50 value (μg/ml) | 539.70 | 168.97 | 817.64 | 125.58 | 87.18 | 76.31 | 138.10 | 201.55 | 336.56 |
IC50 values of the bands suggest that band 5 and 6 with IC50 values of 87.18 μg/ml and 76.31 μg/ml respectively are more potent
Characterization of compounds by LC-MS
In recent decade, liquid chromatography coupled with mass spectrometry (LC–MS) has become the most selective technique for rapid screening and characterization of known and unknown constituents from plant extracts (Chen et al. 2011). Very good selectivity can be obtained due to the high power of mass separation of LC-MS (Hostettman et al. 1997). Preliminary screening of the eluted bands was done by LC-MS analysis to identify the compounds which could be responsible for the cytotoxic effect on the cancer cells. This led to the separation and identification of the constituents (Table 5), some of which have been reported to have cytotoxic activities. Bands 3 and 6 eluted from the HPTLC plate showed the most potent cytotoxic activities. Band 3 (Rf 0.29) had 7-Methylxanthine, 5-Methoxytryptophan, CAY10603, Quassimarin and band 6 (Rf 0.50) had Chrysosplenol C, Buthionine sulfoximine as its constituents which are known to have anticancer properties. The presence of these compounds could be responsible for a more potent cytotoxic effect on cancer cells.
Table 5.
Compounds present in methanolic leaf extract of B. eriantha identified by LS-MS reported to have cytotoxic activity against cancer cells
| Compound | CAS number | R t min | Mass | Area | Height | Annotations | References |
|---|---|---|---|---|---|---|---|
| Liatrin | 34175-79-6 | 11.522 | 418.1609 | 244,918 | 43,059 | Antileukemic sesquiterpene lactone. | (Patel et al. 2010; Morris et al. 1973) |
| Cis-Zeatin | 32771-64-5 | 0.839 | 219.1129 | 1,288,617 | 474,484 | Phytohormone having cytotoxic activities. | (Voller et al. 2010) |
| Buthionine sulfoximine | 5072-26-4 | 2.424 | 222.1031 | 4,275,638 | 853,681 | Inhibitor of glutathione synthesis. Growth-inhibitory activity in different tumor cell lines. Highest cytotoxic activity against melanoma-derived cell lines and in vivo antitumor activity in B16 melanoma-bearing mice. |
(Joseph et al. 1992) |
| 12-hydroxyjasmonic acid | 140631-27-2 | 6.974 | 226.1225 | 2,631,035 | 694,551 | Prevents proliferation and induces death of malignant cells. | (Flescher 2005) |
| Chrysosplenol C - (3,7,3′-trimethoxy-5,6,4′-trihydroxyflavone) | 23370-16-3 | 360.0864 | 9.874 | 9,025 | 4,543 | Moderate cytotoxicity against breast cancer and human small cell lung cancer cell lines. | (Huang et al. 2005; Kanlayavattanakul et al. 2003) |
| CAY10621- [2,2-dimethyl-4S-(1-oxo-2-hexadecyn-1-yl)-1,1-dimethylethyl ester-3-oxazolidinecarboxylic acid] | 120005-55-2 | 435.3354 | 14.427 | 133,838 | 44,229 | Selective inhibitor of sphingosine kinase 1, thus inhibiting tumor growth. | (Shida et al. 2008 ; Wong et al. 2009) |
| 7-Methylxanthine | 552-62-5 | 166.0492 | 0.704 | 4,520,234 | 1,453,114 | Tumorigenesis and teratogenesis greatly inhibited by 7-methylxanthine. | (Nomura 1983) |
| 5-Methoxytryptophan | 2504-22-5 | 234.1021 | 3.814 | 3,486,773 | 531,473 | Anticancer properties by blocking cancer cell cyclooxgenase-2 overexpression. Suppresses A549 migration and invasion, reduced tumor growth and cancer metastasis in a murine xenograft tumor model. |
(Cheng et al. 2012) |
| CAY10603- (N-[4-[3-[[[7-(hydroxyamino)-7-oxoheptyl]amino]carbonyl]-5-isoxazolyl]phenyl]-1,1-dimethylethyl ester) | 1045792-66-2 | 446.2169 | 5.81 | 958,396 | 301,508 | Potent inhibitor of several pancreatic cell lines by inhibiting histone deacetylase 6. | (Kozikowski et al. 2008; Patrick et al. 2011) |
| Quassimarin | 59938-97-5 | 522.2124 | 6.558 | 2,013,565 | 911,869 | Significantly active in the suppression of the growth of a panel of human tumor cell lines (KB, A-549, HCT-8, CAKI-1, MCF-7, and SK-MEL-2). Antileukemic properties and antitumor activity in mice. |
(Kupchan and Streelman 1976; Xu et al. 2000) |
| AG-494- (E)-2-Cyano-3-(3,4-dihydroxyphenyl)-N-phenyl-2-propenamide. | 133550-35-3 | 280.0849 | 12.021 | 368,012 | 64,482 | Inhibits the growth of A549 and DU145 cancer cell lines by blocking Cdk2 (cyclin dependent kinase 2) activation, induces growth arrest of immortalized cells at G1-S and early S and is very effective in arresting the growth of EGFR (epidermal growth factor receptor) overexpressor cells. | (Agnieszka et al. 2012; Ben-Bassat et al. 1999; Kleinberger-Doron et al. 1998; Osherov and Levitzki 1997) |
| 2-Naphthylalanine | 58438-03-2 | 215.0926 | 1.18 | 21,533 | 8,867 | Potently inhibited the proliferation of Jurkat cells. | (Sasaki et al. 2008) |
| Graphinone | 19683-98-8 | 296.1632 | 12.633 | 300,697 | 114,776 | Sesquiterpene having cytotoxic activities. | (Harborne et al. 1999; Martin 2010) |
| Etanidazole | 22668-01-5 | 214.0712 | 0.599 | 1,468,382 | 682,831 | Nitroimidazole drug used for its radiosensitizing properties, by decreasing glutathione concentration and inhibiting glutathione S-transferase. Administration of etanidazole causes the tissues to become more sensitive to the ionizing radiation used in cancer treatment. |
(Abe et al. 2011; Stone et al. 1991; Yang et al. 2012) |
Conclusion
The present work demonstrates presence of high phenolics and flavonoids in B. eriantha DC. leaf methanol extract as well as indicated free radical scavenging activity towards DPPH and FRAP. Additionally, this plant as evident from our studies has cytotoxic activity in HeLa and B16F10 cancer cell lines along with potential anti metastatic effect and cell death by apoptosis. These favorable characteristics of this plant open further avenues for exploring the prospective of Blumea for effective treatment against cancer. Furthermore, remarkable progress in molecular biology and analytical instrumentation will help to extract the metabolite of interest from Blumea eriantha for its wider applications more precisely and accurately. The list of plants having anti cancer properties is increasing in which Blumea will be a plant of prime position in the near future.
Cancer is a dreaded disease and leading cause of death worldwide. Researchers are trying to establish effective treatments for the containment of this dreaded disease.
Blumea eriantha is an easily available natural material and isolation of anticancer compounds from this plant would prove to be a valuable source for the treatment of cancer.
Acknowledgments
We would like to thank Dr. Umesh Jagtap, Department of Biotechnology, Shivaji University, Kolhapur, India for his support.
Abbreviations
- DMEM
Dulbecco’s modified Eagle’s medium
- DPPH
1,1-diphenyl-2- picrylhydrazyl
- FRAP
Ferric ion reducing antioxidant power assay
- HPTLC
High performance thin layer chromatography
- LC-MS
Liquid chromatography–mass spectrometry
- MTT
(3-(4,5-Dimethylthiazol-2-yl)-2,5-diphenyltetrazolium bromide
- PBS
Phosphate buffered saline
- TFC
Total flavonoid content
- TPC
Total phenolic content
Contributor Information
Mohini Gore, Phone: +91+22+39286175, Email: mohinig@gmail.com.
N. S. Desai, Phone: +91+22+39286175, Email: neetindesai@gmail.com
References
- Abe C, Uto Y, Nakae T, Shinmoto Y, Sano K, Nakata H, Teraoka M, Endo Y, Maezawa H, Masunaga S, Nakata E, Hori H. Evaluation of the in vivo radiosensitizing activity of etanidazole using tumor-bearing chick embryo. J Radiat Res. 2011;52:208–214. doi: 10.1269/jrr.10122. [DOI] [PubMed] [Google Scholar]
- Abramoff MD, Magelhaes PJ, Ram SJ. Image processing with Image J. Biophoton Int. 2004;11:36–42. [Google Scholar]
- Agnieszka B, Kinga R, Anna A, Joanna L, Janusz L, Andrzej K. The effect of tyrphostins AG494 and AG1478 on the autocrine growth regulation of A549 and DU145 cells. Folia Histochem Cytobiol. 2012;50:186–195. doi: 10.5603/FHC.2012.0028. [DOI] [PubMed] [Google Scholar]
- Apak R, Güçlü K, Demirata B, Özyürek M, Çelik SE, Bektaşoğlu B, Berker KI, Özyurt D. Comparative evaluation of various total antioxidant capacity assays applied to phenolic compounds with the CUPRAC assay. Molecules. 2007;12:1496–1547. doi: 10.3390/12071496. [DOI] [PMC free article] [PubMed] [Google Scholar]
- Azizi E, Abdolmohammadi MH, Fouladdel S, Shafiee A, Amin G, Ghaffari SM. Evaluation of p53 and Bcl-2 genes and proteins expression in human breast cancer T47D cells treated with extracts of Astrodaucus persicus (Boiss.) Drude in comparison to Tamoxifen. DARU J Pharm Sci. 2009;17:181–186. [Google Scholar]
- Ben-Bassat H, Rosenbaum-Mitrani S, Hartzstark Z, Levitzki R, Chaouat M, Shlomai Z, Klein BY, Kleinberger-Doron N, Gazit A, Tsvieli R, Levitzki A. Tyrphostins that suppress the growth of human papilloma virus 16- immortalized human keratinocytes. J Pharmacol Exp Ther. 1999;290:1442–1457. [PubMed] [Google Scholar]
- Benzie IFF, Strain JJ. The ferric reducing ability of plasma (FRAP) as a measure of “antioxidant power”: the FRAP assay. Anal Biochem. 1996;239:70–76. doi: 10.1006/abio.1996.0292. [DOI] [PubMed] [Google Scholar]
- Chang C, Yang M, Wen H, Chen J. Estimation of total flavonoids content in propolis by two complementary colorimetric methods. J Food Drug Anal. 2002;10:178–182. [Google Scholar]
- Chen YC, Sugiyama Y, Abe N, Niwa RK, Nozawa R, Hirota A. DPPH radical scavenging compounds from Dou-Chi, a soyabean fermented food. Biosci Biotechnol Biochem. 2005;69:999–1006. doi: 10.1271/bbb.69.999. [DOI] [PubMed] [Google Scholar]
- Chen XF, Wu HT, Tan GG, Zhu ZY, Chai YF. Liquid chromatography coupled with time-of-flight and ion trap mass spectrometry for qualitative analysis of herbal medicines. J Pharm Anal. 2011;1:235–245. doi: 10.1016/j.jpha.2011.09.008. [DOI] [PMC free article] [PubMed] [Google Scholar]
- Cheng HH, Kuo CC, Yan JL, Chen HL, Lin WC, Wang KH, Tsai KK, Guven H, E, Wu KK (2012) Control of cyclooxygenase-2 expression and tumorigenesis by endogenous 5-methoxytryptophan. Proc Natl Acad Sci 109:13231–13236 [DOI] [PMC free article] [PubMed]
- Connor AM, Luby JJ, Tong CBS. Variation and heritability estimates for antioxidant activity, total phenolic content, and anthocyanin content in blueberry progenies. J Am Soc Hortic Sci. 2002;127:82–88. [Google Scholar]
- Drees M, Dengler WA, Roth T, Labonte H, Mayo J, Malspeis L, Grever M, Sausville EA, Fiebig HH. Flavopiridol (L86-8275): selective antitumor activity in vitro and activity in vivo for prostate carcinoma cells. Clin Cancer Res. 1997;3:273–279. [PubMed] [Google Scholar]
- Flescher E. Jasmonates—a new family of anti-cancer agents. Anticancer Drugs. 2005;16:911–916. doi: 10.1097/01.cad.0000176501.63680.80. [DOI] [PubMed] [Google Scholar]
- Franken NA, Rodermond HM, Stap J, Haveman JV, Bree C. Clonogenic assay of cells in vitro. Nat Protoc. 2006;1:2315–2319. doi: 10.1038/nprot.2006.339. [DOI] [PubMed] [Google Scholar]
- Ghasemi K, Ghasem Y, Ebrahimzadeh MA. Antioxidant activity, phenol and flavonoid contents of 13 citrus species peels and tissues. Pak J Pharm Sci. 2009;22:277–281. [PubMed] [Google Scholar]
- Harborne JJB, Baxte H, Moss GP. Phytochemical dictionary: a handbook of bioactive compounds from plants. 2. Wallington: Taylor & Francis; 1999. p. 641. [Google Scholar]
- Hostettman K, Wolfender JL, Rodriguez S. Rapid detection and subsequent isolation of bioactive constituents of crude plant extracts. Planta Med. 1997;63:2–10. doi: 10.1055/s-2006-957592. [DOI] [PubMed] [Google Scholar]
- Hsu CY. Antioxidant activity of extract from Polygonum aviculare L. L. Biol Res. 2006;39:281–288. doi: 10.4067/S0716-97602006000200010. [DOI] [PubMed] [Google Scholar]
- Huang DJ, Chen HJ, Lin CD, Lin YH. Antioxidant and antiproliferative activities of water spinach (Ipomoea aquatica Forsk) constituents. Bot Bull Acad Sin. 2005;46:99–106. [Google Scholar]
- Huong DT, Luong DV, Thao TT, Sung TV. A new flavone and cytotoxic activity of flavonoid constituents isolated from Miliusa balansae (Annonaceae) Pharmazie. 2005;60:627–629. [PubMed] [Google Scholar]
- Ian S, Evaloni P, Helen J, John L, Luis P, Pablo SV, Tony D, John A. Analysis of piperaceae germplasm by HPLC and LCMS: a method for isolating and identifying unsaturated amides from Piper spp extracts. J Agric Food Chem. 2005;53:1907–1913. doi: 10.1021/jf048305a. [DOI] [PubMed] [Google Scholar]
- Joseph PA, FitzGerald GB, Wick MM. Melanoma cytotoxicity of buthionine sulfoximine (BSO) alone and in combination with 3,4-dihydroxybenzylamine and melphalan. J Investig Dermatol. 1992;99:289–293. doi: 10.1111/1523-1747.ep12616629. [DOI] [PubMed] [Google Scholar]
- Kanlayavattanakul M, Ruangrungsi N, Watanabe T, Ishikawa T. Chemical constituents of Pterocaulon redolens. Heterocycles. 2003;61:183–187. doi: 10.3987/COM-03-S16. [DOI] [Google Scholar]
- Khare CP. Indian medicinal plants: an illustrated dictionary. 1. Berlin: Springer; 2007. p. 95. [Google Scholar]
- Kleinberger-Doron N, Shelah N, Capone R, Gazit A, Levitzki A. Inhibition of Cdk2 activation by selected tyrphostins causes cell cycle arrest at late G1 and S phase. Exp Cell Res. 1998;241:340–351. doi: 10.1006/excr.1998.4061. [DOI] [PubMed] [Google Scholar]
- Kozikowski AP, Tapadar S, Luchini DN, Kim KH, Billadeau DD. Use of the nitrile oxide cycloaddition (NOC) reaction for molecular probe generation: a new class of enzyme selective histone deacetylase inhibitors (HDACIs) showing picomolar activity at HDAC6. J Med Chem. 2008;51:4370–4373. doi: 10.1021/jm8002894. [DOI] [PMC free article] [PubMed] [Google Scholar]
- Kupchan SM, Streelman DR. Quassimarin, a new antileukemic quassinoid from Quassia amara. J Org Chem. 1976;41:3481–3482. doi: 10.1021/jo00883a038. [DOI] [PubMed] [Google Scholar]
- Lampila P, Lieshout M, Gremmen B, Lahteenmaki L. Consumer attitudes towards enhanced flavonoid content in fruit. Food Res Int. 2009;42:122–129. doi: 10.1016/j.foodres.2008.09.002. [DOI] [Google Scholar]
- Lee HC, Kim JH, Jeong SM, Kim DR, Ha JU, Nam KC. Effect of far infrared radiation on the antioxidant activity of rice hulls. J Agric Food Chem. 2003;51:4400–4403. doi: 10.1021/jf0300285. [DOI] [PubMed] [Google Scholar]
- Liang CC, Park AY, Guan JL. In vitro scratch assay: a convenient and inexpensive method for analysis of cell migration in vitro. Nat Protoc. 2007;2:329–333. doi: 10.1038/nprot.2007.30. [DOI] [PubMed] [Google Scholar]
- Liu RH. Health benefits of fruit and vegetables are from additive and synergistic combinations of phytochemicals. Am J Clin Nutr. 2003;78:517S–520S. doi: 10.1093/ajcn/78.3.517S. [DOI] [PubMed] [Google Scholar]
- Marone M, Mozzetti S, Ritis DD, Pierelli L, Scambia G. Semiquantitative RT-PCR analysis to assess the expression levels of multiple transcripts from the same sample. Biol Proced Online. 2001;3:19–25. doi: 10.1251/bpo20. [DOI] [PMC free article] [PubMed] [Google Scholar]
- Martin H. The mycota: a comprehensive treatise on fungi as experimental systems for basic and applied research- industrial applications. 2. Berlin: Springer Verlag; 2010. p. 176. [Google Scholar]
- Marxen K, Vanselow KH, Lippemeier S, Hintze R, Ruser A, Hansen UP. Determination of DPPH radical oxidation caused by methanolic extracts of some microalgal species by linear regression analysis of spectrophotometric measurements. Sensors. 2007;7:2080–2095. doi: 10.3390/s7102080. [DOI] [PMC free article] [PubMed] [Google Scholar]
- Mongkolsilp S, Pongbupakit I, Lee NS, Sitthithaworn W. Radical scavenging activity and total phenolic content of medicinal plants used in primary health care. J Pharm Sci. 2004;9:32–35. [Google Scholar]
- Morris KS, Davies VH, Fujita T, Cox MR, Restivo RJ, Bryan RF. Isolation and structural elucidation of liatrin, a novel antileukemic sesquiterpene lactone from Liatris chapmanii. J Org Chem. 1973;38:1853–1858. doi: 10.1021/jo00950a017. [DOI] [PubMed] [Google Scholar]
- Mosmann T. Rapid colorimetric assay for cellular growth and survival: application to proliferation and cytotoxicity assays. J Immunol Methods. 1983;65:55–63. doi: 10.1016/0022-1759(83)90303-4. [DOI] [PubMed] [Google Scholar]
- Nisa S, Bibi Y, Waheed A, Zia M, Sarwar S, Ahmed S, Chaudhary MF. Evaluation of anticancer activity of debregeasia salicifolia extract against estrogen receptor positive cell line. Afr J Biotechnol. 2011;10:990–995. [Google Scholar]
- Nomura T. Comparative inhibiting effects of methylxanthines on urethan-induced tumors, malformations, and presumed somatic mutations in mice. Cancer Res. 1983;43:1342–1346. [PubMed] [Google Scholar]
- Osherov N, Levitzki A. Tyrphostin AG 494 blocks Cdk2 activation. FEBS Lett. 1997;410:187–190. doi: 10.1016/S0014-5793(97)00580-2. [DOI] [PubMed] [Google Scholar]
- Patel B, Das S, Prakash R, Yasir M. Natural bioactive compound with anticancer potential. Int J Adv Pharm Sci. 2010;1:32–41. doi: 10.5138/ijaps.2010.0976.1055.01003. [DOI] [Google Scholar]
- Patel DK, Patel K, Dhanabal SP. Phytochemical standardization of Aloe vera extract by HPLTC techniques. J Acute Dis. 2012;1:47–50. doi: 10.1016/S2221-6189(13)60011-6. [DOI] [Google Scholar]
- Patrick B, Paul H, Baharia M (2011) Method for determining the efficiency of a cancer treatment WO2011067346 A1
- Pezzuto JM. Plant-derived anticancer agents. Biochem Pharmacol. 1997;53:121–133. doi: 10.1016/S0006-2952(96)00654-5. [DOI] [PubMed] [Google Scholar]
- Rodriguez LG, Wu X, Guan JL. Wound healing assay. Methods Mol Biol. 2005;294:23–29. doi: 10.1385/1-59259-860-9:023. [DOI] [PubMed] [Google Scholar]
- Saewan N, Koysomboon S, Chantrapromma K. Anti-tyrosinase and anti- cancer activities of flavonoids from Blumea balsamifera DC. J Med Plants Res. 2011;5:1018–1025. [Google Scholar]
- Sampathkumar S, Ramakrishnan N. Chromatographic finger print analysis of Naringi crenulata by HPTLC technique. Asian Pac J Trop Biomed. 2011;1:S195–S198. doi: 10.1016/S2221-1691(11)60155-X. [DOI] [PMC free article] [PubMed] [Google Scholar]
- Sasaki Y, Minamizawa M, Ambo A, Sugawara S, Ogawa Y, Nitta K. Cell- penetrating peptide-conjugated XIAP-inhibitory cyclic hexapeptides enter into Jurkat cells and inhibit cell proliferation. FEBS Lett. 2008;275:6011–6021. doi: 10.1111/j.1742-4658.2008.06730.x. [DOI] [PubMed] [Google Scholar]
- Sengul M, Yildiz H, Gungor N, Cetin B, Eser Z, Ercisli S. Total phenolic content, antioxidant and antimicrobial activities of some medicinal plants. Pak J Pharm Sci. 2009;22:102–106. [PubMed] [Google Scholar]
- Shahidi F, McDonald J, Chandrasekara A, Zhong Y. Phytochemicals of foods, beverages and fruit vinegars: chemistry and health effects. Asia Pac J Clin Nutr. 2008;17:380–382. [PubMed] [Google Scholar]
- Sharma RK, Chatterji S, Rai DK, Mehta S, Rai PK, Singh RK, Watal G, Sharma B. Antioxidant activities and phenolic contents of the aqueous extracts of some Indian medicinal plants. J Med Plants Res. 2009;3:944–948. [Google Scholar]
- Shida D, Takabe K, Kapitonov D, Milstien S. Targeting SphK1 as a new strategy against cancer. Curr Drug Targets. 2008;9:662–673. doi: 10.2174/138945008785132402. [DOI] [PMC free article] [PubMed] [Google Scholar]
- Singh UP, Parthasarathy R. Comparative antidiarrhoeal activity of ethanolic extract of root of Blumea lacera var lacera and Blumea eriantha DC on experimental animals. J Pharm Biomed Sci. 2012;17:1–4. [Google Scholar]
- Singh UP, Singh AK, Partha Sarathy R. Effect of methanolic extracts of Blumea Eriantha DC leaves on protein metabolism and marker enzymes in streptozotocin- induced hyperglycemic animals. Int J Pharm Sci. 2011;4:235–238. [Google Scholar]
- Singleton VL, Rossi JA. Colorimetry of total phenolics with phosphomolybdic-phosphotungstic acid reagents. Am J Enol Vitic. 1965;16:144–158. [Google Scholar]
- Srikanth P, Karthik PS, Sirisha M, Sashikanth Chitti Evaluation of antioxidant and anticancer properties of methanolic extracts of abutilon indicum and blumea mollis. J Pharm Res. 2012;5:2373–2376. [Google Scholar]
- Srivastava V, Negi AS, Kumar JK, Gupta MM, Khanuja SPS. Plant-based anticancer molecules: a chemical and biological profile of some important leads. Bioorg Med Chem. 2005;5:5892–5908. doi: 10.1016/j.bmc.2005.05.066. [DOI] [PubMed] [Google Scholar]
- Stanojević L, Stanković M, Nikolić V, Nikolić L, Ristić D, Brunet JC, Tumbas V. Antioxidant activity and total phenolic and flavonoid contents of hieracium pilosella L. extracts. Sensors. 2009;9:5702–5714. doi: 10.3390/s90705702. [DOI] [PMC free article] [PubMed] [Google Scholar]
- Stone HB, Hirst VK, Cribbs R, Luu YH, Brown JM. A comparison of radiosensitization by etanidazole and pimonidazole in mouse tumors. Int J Radiat Oncol Biol Phys. 1991;20:987–995. doi: 10.1016/0360-3016(91)90195-A. [DOI] [PubMed] [Google Scholar]
- Svilaas A, Sakhi AK, Andersen LN, Svilaas T, Ström EC, Jacobs DR, Jr, Ose L, Blomhoff R. Intakes of antioxidants in coffee, wine, and vegetables are correlated with plasma carotenoids in humans. J Nutr. 2004;134:562–567. doi: 10.1093/jn/134.3.562. [DOI] [PubMed] [Google Scholar]
- Voller J, Zatloukal M, Lenobel R, Dolezal K, Béres T, Krystof V, Spichal L, Niemann P, Dzubák P, Hajdúch M, Strnad M. Anticancer activity of natural cytokinins: a structure-activity relationship study. Phytochemistry. 2010;71:1350–1359. doi: 10.1016/j.phytochem.2010.04.018. [DOI] [PubMed] [Google Scholar]
- Wong L, Tan SL, Lam Y, Melendez AJ. Synthesis and evaluation of sphingosine analogues as inhibitors of sphingosine kinases. J Med Chem. 2009;52:3618–3626. doi: 10.1021/jm900121d. [DOI] [PubMed] [Google Scholar]
- Xu Z, Chang FR, Wang HK, Kashiwada Y, McPhail AT, Bastow KF, Tachibana Y, Cosentino M, Lee KH. Anti-HIV agents 45(1) and antitumor agents 205. (2) two new sesquiterpenes, leitneridanins A and B, and the cytotoxic and anti-HIV principles from Leitneria floridana. J Nat Prod. 2000;63:1712–1715. doi: 10.1021/np000260u. [DOI] [PubMed] [Google Scholar]
- Yang B, Kortesniemi M, Liu P, Karonen M, Salminen JP. Analysis of hydrolyzable tannins and other phenolic compounds in emblic leaf flower (Phyllanthus emblica L.) fruits by high performance liquid chromatography- electrospray ionization mass spectrometry. J Agric Food Chem. 2012;60:8672–8683. doi: 10.1021/jf302925v. [DOI] [PubMed] [Google Scholar]
- Yao LH, Jiang YM, Shi J, Tomas-Barberan FA, Dutta N, Singanusong R, Chen SS. Flavonoids in food and their health benefits. Plant Foods Hum Nutr. 2004;59:113–122. doi: 10.1007/s11130-004-0049-7. [DOI] [PubMed] [Google Scholar]