

Abstract
Genome-wide association studies (GWASs) of follicular lymphoma (FL) have previously identified human leukocyte antigen (HLA) gene variants. To identify additional FL susceptibility loci, we conducted a large-scale two-stage GWAS in 4,523 case subjects and 13,344 control subjects of European ancestry. Five non-HLA loci were associated with FL risk: 11q23.3 (rs4938573, p = 5.79 × 10⁻²⁰) near CXCR5; 11q24.3 (rs4937362, p = 6.76 × 10⁻¹¹) near ETS1; 3q28 (rs6444305, p = 1.10 × 10⁻¹⁰) in LPP; 18q21.33 (rs17749561, p = 8.28 × 10⁻¹⁰) near BCL2; and 8q24.21 (rs13254990, p = 1.06 × 10⁻⁸) near PVT1. In an analysis of the HLA region, we identified four linked HLA-DRβ1 multiallelic amino acids at positions 11, 13, 28, and 30 that were associated with FL risk (pomnibus = 4.20 × 10−67 to 2.67 × 10−70). Additional independent signals included rs17203612 in HLA class II (odds ratio [ORper-allele] = 1.44; p = 4.59 × 10⁻¹⁶) and rs3130437 in HLA class I (ORper-allele = 1.23; p = 8.23 × 10⁻⁹). Our findings further expand the number of loci associated with FL and provide evidence that multiple common variants outside the HLA region make a significant contribution to FL risk.
Main Text
Follicular lymphoma (FL [MIM 613024]) is a common B cell malignancy characterized by a variable indolent clinical course that can take decades to manifest and, in some cases, can be followed by transformation to aggressive diffuse large B cell lymphoma (DLBCL).1,2 The previous genome-wide association studies (GWASs) of relatively small sample sizes have revealed FL susceptibility loci in the human leukocyte antigen (HLA) class I and class II regions on 6p21.32-33.3–7 To identify new FL susceptibility loci, we genotyped 2,301 FL case subjects and 2,854 control subjects of European descent from 22 studies (NCI FL GWAS) as part of a larger initiative using the Illumina OmniExpress Beadchip (Table S1; Figure S1 available online). All studies obtained informed consent from participants and approval from the respective Institutional Review Boards for this study. Cases were ascertained from cancer registries, clinics, or hospitals or through self-report verified by medical and pathology reports (Table S1). The phenotype information for all cases was reviewed centrally at the International Lymphoma Epidemiology Consortium (InterLymph) Data Coordinating Center, and cases were classified according to the proposed scheme by the InterLymph Pathology Working Group based on the World Health Organization (WHO) classification (2008) (Table S1). Genotypes were called using Illumina GenomeStudio software, and quality-control duplicates showed >99% concordance. All initial data analyses and management were conducted using the Genotyping Library and Utilities (GLU), and extensive quality-control metrics were applied to the data. Specifically, monomorphic SNPs and SNPs with call rates <93% were removed, and samples with call rates ≤93%, mean heterozygosity <0.25 or >0.33 based on the autosomal SNPs, or gender discordance (>5% heterozygosity on the X chromosome for males and <20% heterozygosity on the X chromosome for females) were excluded. Unexpected duplicates (>99.9% concordance) and first-degree relatives on the basis of identity-by-descent sharing with Pi-hat >0.40 were removed. Ancestry was assessed using the GLU struct.admix module, and participants with <80% European ancestry were also excluded (Figure S2). After these quality-control steps, 94% of the participants and 611,844 SNPs remained for analysis (Tables S2 and S3). Genotype data previously generated on the Illumina Omni2.5 BeadChip8 from an additional 3,536 control subjects from 3 of the 22 studies (ATBC, CPSII, and PLCO) were also included, resulting in a total of 2,142 FL case subjects and 6,221 control subjects for analysis (NCI FL GWAS; Table S4).
To evaluate population substructure, a principal components analysis was conducted using the GLU struct.pca module. Plots of the top principal components are shown in Figure S3. Association testing was conducted assuming a log-additive genetic model adjusted for age, sex, and significant principal components. A quantile-quantile plot of the association results revealed an enrichment of SNPs with small p values even after removal of all SNPs in the HLA region, which has been previously reported to be associated with FL (lambda = 1.018, Figure S4). In addition to the HLA region, one locus on 11q23.3 reached genome-wide statistical significance (p < 5 × 10⁻⁸) (Figure S5).
To increase power to detect associations in stage 1, we added data on 586 FL case subjects and 1,537 control subjects from two independent previously published GWASs (UCSF24 and SCALE3) to the newly genotyped NCI FL GWAS (Tables S1 and S4; Figure S1). Because different genotyping platforms were used (Table S2), we imputed all three GWASs (NCI, UCSF2, SCALE) using the 1000 Genomes Project (1kGP) v.3 (March 2012 release) reference panel9 and IMPUTE2.10 The genotype data underwent rigorous quality control filters before imputation (Table S2), and association testing was conducted separately for each study using SNPTEST v.2 adjusted for age, sex, and significant principal components.
Association results from the NCI FL GWAS and the two previously genotyped GWASs (totaling 2,728 case subjects, 7,758 control subjects in stage 1) were analyzed in a meta-analysis using a fixed-effects inverse-variance method based on the β estimates and standard errors from each study. Only SNPs with information scores >0.3 were included in the meta-analysis. In the stage 1 meta-analysis, we identified three non-HLA loci (11q23.3, 11q24.3, and 3q13.33) that reached genome-wide significance (p < 5 × 10⁻⁸). To confirm these loci and discover additional loci, 11 non-HLA SNPs with p < 5 × 10⁻⁶ from the stage 1 meta-analysis were chosen for replication in stage 2. Only SNPs with a MAF > 1% were considered for replication, and no SNPs were taken forward for replication in regions where they appeared to be singletons or obvious artifacts. Stage 2 replication was undertaken in a new set of 1,795 FL case subjects and 5,586 control subjects, which included 119 case subjects and 349 control subjects from another GWAS (UCSF1/NHS) genotyped on the OmniExpress microarray and imputed using IMPUTE210 and the 1kGP data,9 and 1,676 cases and 5,237 controls with de novo genotyping (Tables S1, S2, and S4). All 11 SNPs were either directly genotyped or had a high imputation information score (average information score = 0.92). Genotyping of these 11 SNPs by TaqMan (Applied Biosystems) in 470 subjects from the NCI GWAS yielded >88.9% concordance with the imputed dosages (median concordance = 99.6%), indicating that imputation accuracy was high. Association testing was conducted for each study using either GLU (de novo genotyping) or SNPTEST (UCSF1/NHS), adjusting for relevant factors.
Results from the stage 1 and 2 studies were then meta-analyzed using a fixed effects model. In the combined meta-analysis, we found five non-HLA loci that achieved genome-wide significance (p < 5 × 10⁻⁸) at 11q23.3 (rs4938573, p = 5.79 × 10⁻²⁰), 11q24.3 (rs4937362, p = 6.76 × 10⁻¹¹), 3q28 (rs6444305, p = 1.10 × 10⁻¹⁰), 18q21.33 (rs17749561, p = 8.28 × 10⁻¹⁰), and 8q24.21 (rs13254990, p = 1.06 × 10⁻⁸); and three suggestive loci (p < 5 × 10⁻⁷) at 17q25.3 (rs3751913, p = 2.24 × 10⁻⁷), 3q13.33 (rs2681416, p = 2.33 × 10⁻⁷), and 18q12.3 (rs11082438, p = 4.01 × 10⁻⁷) (Table 1). Two of the five loci that reached genome-wide significance in the stage 1 and 2 meta-analysis (11q23.3 and 11q24.3) were genome-wide significant in the stage 1 meta-analysis and were robustly replicated in stage 2 (p = 3.17 × 10⁻¹⁰ and p = 0.0002, respectively). The remaining three loci achieved genome-wide significance after inclusion of the stage 2 data and therefore would benefit from further validation in other independent samples.
Table 1.
Association Results for Loci and SNPs Associated with Risk of Follicular Lymphoma
| Chr | Nearest Gene(s) | SNP | Positiona | Risk Alleleb | Other Allele | RAFc | Stage | OR | (95% CI) | p | Phetd | I2e |
|---|---|---|---|---|---|---|---|---|---|---|---|---|
| Known Locus | ||||||||||||
| 6p21.32 |
HLA region |
rs12195582 (rs115374828) |
32444544 |
T |
C |
0.465 | NCI | 1.88 | (1.74–2.02) | 3.26 × 10−58 | – | – |
| 0.498 | previous GWAS | 1.55 | (1.33–1.80) | 1.10 × 10⁻⁸ | ||||||||
| 0.435 | replication | 1.75 | (1.60–1.90) | 1.17 × 10−37 | ||||||||
| – | combined | 1.78 | (1.69–1.88) | 5.36 × 10−100 | 2.75 × 10⁻¹ | 19.56 | ||||||
| Genome-wide Significant Loci | ||||||||||||
| 11q23.3 | CXCR5 | rs4938573 | 118741842 | C | T | 0.204 | NCI | 1.30 | (1.19–1.43) | 5.97 × 10⁻⁹ | – | – |
| 0.193 | previous GWAS | 1.37 | (1.14–1.64) | 0.0008 | ||||||||
| 0.188 | replication | 1.39 | (1.25–1.54) | 3.17 × 10⁻¹⁰ | ||||||||
| – | combined | 1.34 | (1.26–1.43) | 5.79 × 10⁻²⁰ | 7.69 × 10⁻¹ | 0.00 | ||||||
| 11q24.3 | ETS1 | rs4937362 | 128492739 | T | C | 0.456 | NCI | 1.16 | (1.08–1.25) | 7.01 × 10⁻⁵ | – | – |
| 0.465 | previous GWAS | 1.33 | (1.16–1.54) | 5.90 × 10⁻⁵ | ||||||||
| 0.467 | replication | 1.17 | (1.08–1.28) | 0.0002 | ||||||||
| – | combined | 1.19 | (1.13–1.25) | 6.76 × 10⁻¹¹ | 7.52 × 10⁻¹ | 0.00 | ||||||
| 3q28 | LPP | rs6444305 | 188299902 | G | A | 0.276 | NCI | 1.16 | (1.08–1.27) | 0.0002 | – | – |
| 0.269 | previous GWAS | 1.30 | (1.06–1.59) | 0.01 | ||||||||
| 0.281 | replication | 1.25 | (1.14–1.37) | 2.21 × 10⁻⁶ | ||||||||
| – | combined | 1.21 | (1.14–1.28) | 1.10 × 10⁻¹⁰ | 4.42 × 10⁻¹ | 0.00 | ||||||
| 18q21.33 | BCL2 | rs17749561 | 60783211 | G | A | 0.910 | NCI | 1.43 | (1.25–1.61) | 2.18 × 10⁻⁷ | – | – |
| 0.908 | previous GWAS | 1.23 | (0.96–1.57) | 1.10 × 10⁻¹ | ||||||||
| 0.905 | replication | 1.28 | (1.10–1.49) | 0.002 | ||||||||
| – | combined | 1.34 | (1.22–1.47) | 8.28 × 10⁻¹⁰ | 5.43 × 10⁻² | 49.37 | ||||||
| 8q24.21 |
PVT1 |
rs13254990 |
129076451 |
T |
C |
0.315 | NCI | 1.20 | (1.11–1.30) | 8.39 × 10⁻⁶ | – | – |
| 0.307 | previous GWAS | 1.15 | (0.98–1.34) | 0.08 | ||||||||
| 0.315 | replication | 1.16 | (1.06–1.27) | 0.001 | ||||||||
| – | combined | 1.18 | (1.11–1.24) | 1.06 × 10⁻⁸ | 6.99 × 10⁻¹ | 0.00 | ||||||
| Suggestive Loci | ||||||||||||
| 17q25.3 | C17orf62 | rs3751913 | 80405552 | C | T | 0.121 | NCI | 1.25 | (1.11–1.39) | 0.0001 | – | – |
| 0.126 | previous GWAS | 1.42 | (1.16–1.75) | 0.0008 | ||||||||
| 0.121 | replication | 1.14 | (1.01–1.29) | 0.04 | ||||||||
| – | combined | 1.23 | (1.14–1.33) | 2.24 × 10⁻⁷ | 2.59 × 10⁻¹ | 21.50 | ||||||
| 3q13.33 | CD86 | rs2681416 | 121817613 | A | G | 0.311 | NCI | 1.24 | (1.15–1.35) | 6.73 × 10⁻⁸ | – | – |
| 0.305 | previous GWAS | 1.15 | (0.99–1.34) | 0.06 | ||||||||
| 0.329 | replication | 1.06 | (0.97–1.15) | 0.23 | ||||||||
| – | combined | 1.16 | (1.09–1.22) | 2.33 × 10⁻⁷ | 5.54 × 10⁻⁴ | 72.83 | ||||||
| 18q12.3 | SLC14A2 | rs11082438 | 42865210 | G | T | 0.936 | NCI | 1.39 | (1.18–1.61) | 4.65 × 10⁻⁵ | – | – |
| 0.941 | previous GWAS | 1.46 | (1.07–1.99) | 0.02 | ||||||||
| 0.935 | replication | 1.22 | (1.02–1.46) | 0.03 | ||||||||
| – | combined | 1.33 | (1.19–1.48) | 4.01 × 10⁻⁷ | 9.26 × 10⁻¹ | 0.00 | ||||||
Position according to human reference NCBI37/hg19.
Allele associated with an increased risk of FL.
Risk allele frequency in controls.
Cochran’s Q test heterogeneity p value.
I2 heterogeneity index.
rs4938573 at 11q23.3 maps 12.6 kb upstream of the chemokine (c-x-c motif) receptor 5 gene (CXCR5 [MIM 601613]) (Figure 1). The 11q24.3 locus marked by rs4937362 (p = 6.76 × 10⁻¹¹) is approximately 35 kb upstream of v-ets avian erythroblastosis virus E26 oncogene homolog 1 (ETS1 [MIM 164720]) (Figure 2). The 3q28 locus marked by rs6444305 maps to a region that overlaps the LIM domain containing preferred translocation partner in lipoma (LPP [MIM 600700]) and is 836.4 kb upstream of BCL6 (MIM 109565) (Figure 3). rs17749561 in 18q21.33 is located 7.4 kb downstream of the antiapoptotic oncogene, B cell CLL/lymphoma 2 (BCL2 [MIM 151430]) (Figure 4); and rs13254990 at 8q24.21 maps near the oncogene, plasmacytoma variant translocation 1 gene (PVT1 [MIM 165140]) (Figure 5). Characteristics of these loci are presented in Table S5. The suggestive SNP rs3751913 is in chromosome 17 opening reading frame 62 (C17orf62); rs2681416 is in CD86 molecule (CD86) (MIM 601020); and rs11082438 is in solute carrier 14A2 (SLC14A2 [MIM 601611]) (Table 1, Figure S6). Using the Cochran’s Q test and by estimating the I2 heterogeneity index, no substantial heterogeneity was observed among the studies for any SNP (pheterogeneity ≥ 0.05) except for the suggestive locus, rs2681416 at 3q13.33 (Table 1). Although the p value for heterogeneity for rs13254990 was borderline significant, all of the effect estimates for the individual studies were above 1.0.
Figure 1.
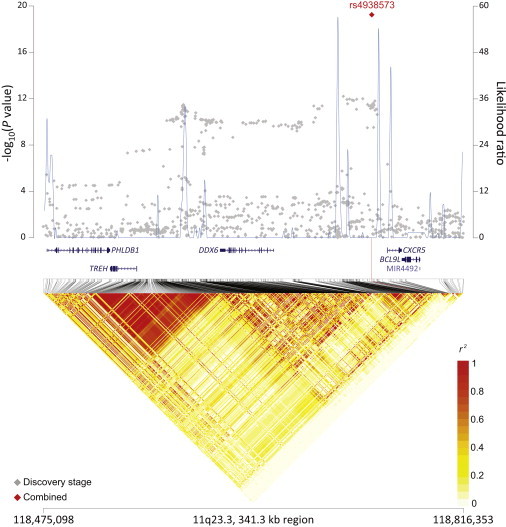
Regional Plots of the FL-Associated Locus rs4938573 in 11q23.3
Figure shows the association results from the NCI FL GWAS and stages 1 and 2 combined (red diamond), recombination hotspots, and LD plots.
Figure 2.
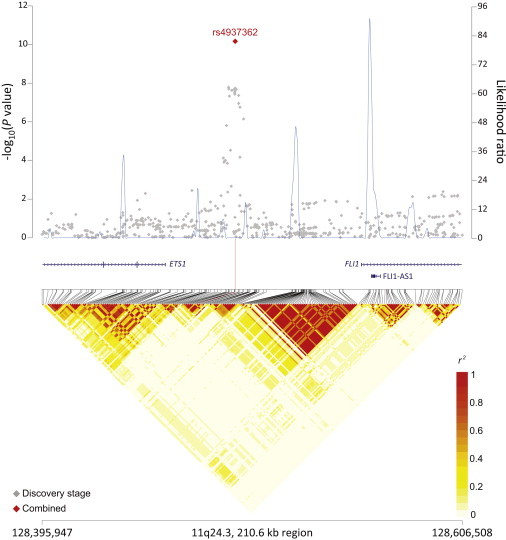
Regional Plots of the FL-Associated Locus rs4937362 in 11q24.3
Figure shows the association results from the NCI NHL GWAS and stages 1 and 2 combined (red diamond), recombination hotspots, and LD plots.
Figure 3.
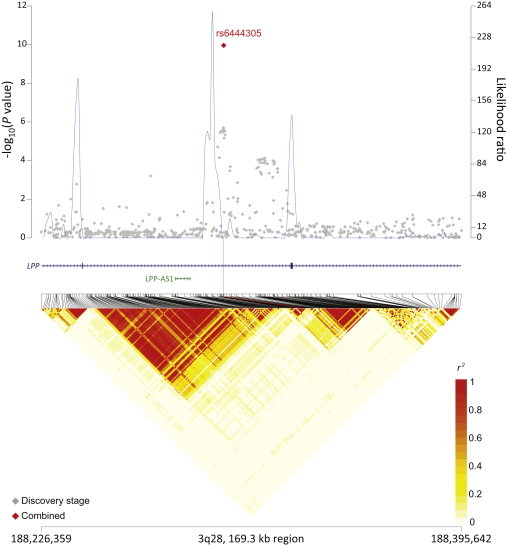
Regional Plots of the Associated Locus rs6444305 in 3q28
Figure shows the association results from the NCI FL GWAS and stages 1 and 2 combined (red diamond), recombination hotspots, and LD plots.
Figure 4.
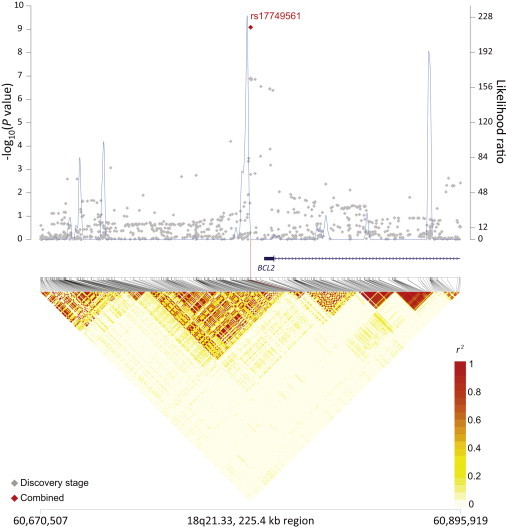
Regional Plots of the Associated Locus rs17749561 in 18q21.33
Figure shows the association results from the NCI FL GWAS and stages 1 and 2 combined (red diamond), recombination hotspots, and LD plots.
Figure 5.
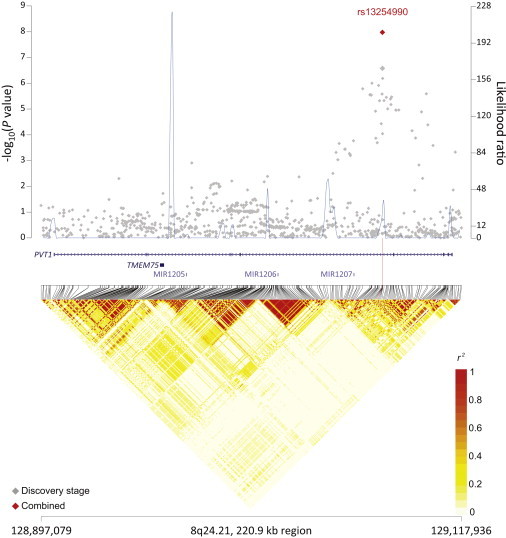
Regional Plots of the Associated Locus rs13254990 in 8q24.21
Figure shows the association results from the NCI FL GWAS and stages 1 and 2 combined (red diamond), recombination hotspots, and LD plots.
To explore potential functional roles for associated SNPs and their surrogates (r2 > .80) and to assess the B cell-specific chromatin dynamics of regions overlapping with the associated SNPs, we conducted HaploReg11 and ChroMoS analyses.12,13 Here we found that three loci, 11q23.3, 3q13.33, and 8q24.21, were annotated as overlapping enhancers in the lymphoblastoid cell line GM12878,14 suggesting that our GWAS signals map to variants that overlap within regions of active chromatin state in B cells (Table S6; Figure S7). However, an expression quantitative trait loci (eQTL) analysis using publicly available RNA sequencing data on lymphoblastoid cell lines (available from the Gene Expression Omnibus [GEO] repository under accession number GSE16921) yielded no notable (FDR < 0.05) associations of the selected SNPs with gene expression levels. Additional analysis using microarray data (GEO accession number GSE8052) did not reveal any significant eQTL associations for the genome-wide significant loci, although the suggestive SNP, rs3751913, was associated with C17orf62 expression (data not shown). Thus, further work is needed to identify and characterize the biological basis of these FL susceptibility alleles.
Consistent with previous smaller reports, the strongest effects on FL risk were observed in the HLA region at 6p21.32-33, where 8,104 SNPs achieved genome-wide significance (p < 5 × 10⁻⁸) in the stage 1 meta-analysis (Figure S8). One top SNP, rs12195582, was carried forward for replication in stage 2 and reached a combined p = 5.36 × 10−100 in stages 1+2 (Table 1). To further refine the association of HLA variants with FL risk and determine whether specific coding variants within HLA genes contributed to the diverse association signals, we imputed classical HLA alleles and amino acids (AAs) at seven loci (HLA-A [MIM 142800], HLA-B [MIM 142830], HLA-C [MIM 142840], HLA-DQA1 [MIM 146880], HLA-DQB1 [MIM 604305], HLA-DRB1 [MIM 142857], and HLA-DPB1 [MIM 142858]) on the four GWAS data sets from stages 1+2 (NCI, USCF2, SCALE, UCSF1/NHS) using SNP2HLA15 and a reference panel from the Type 1 Diabetes Genetics Consortium (T1DGC) consisting of genotype data from 5,225 individuals of European descent that were typed for classical HLA alleles. The imputation accuracy of HLA types was high (>95.23%) when compared to HLA sequencing data on a subset of NCI and UCSF2 samples scanned as part of this study.16,17 Due to the limited number of SNPs (7,253) in the T1DGC reference set, imputation of HLA SNPs was conducted with IMPUTE2 and the 1kGP reference set. A total of 68,488 SNPs, 201 classical HLA alleles (two- and four-digit resolution), and 1,038 AA markers including 103 AA positions that were “multiallelic” with three to six different residues present at each position, were successfully imputed (information score > 0.3 for SNPs or r2 > 0.3 for alleles and AAs) and available for downstream analysis. Association testing was conducted using PLINK,18 where multiallelic markers were analyzed as binary markers (e.g., allele present or absent). A meta-analysis was conducted where we tested SNPs, HLA alleles, and AAs across the HLA region for association to FL. Among the imputed AAs and HLA alleles tested, the top associated signal mapped to a DRβ1 AA at position 28 that carries three possible amino acids: Glu, Asp, and His. Asp was associated with low (OR = 0.53; p = 6.1 Χ 10−72) and Glu with high (OR = 1.86; p = 7.99 × 10−69) FL risk (Table S7). Global omnibus tests of position 28 (2.49 × 10−67 ≤ p ≤ 3.84 × 10−67) and other nearby DRβ1 AA positions at 11, 13, and 30 yielded statistically similar associations with FL risk (Table S9). These results support the previously reported association between FL and DRβ1 position 13 in a small study of Europeans.19 However, due to the high LD between positions 11, 13, 28, and 30, we were unable to determine the significance of one position at the exclusion of the other through reciprocal conditional analyses. The most significant imputed two- or four-digit HLA allele in our analysis was DRB1∗01 (OR = 1.85; p = 2.57 × 10−42) (Table S7), encoded by Glu28, Cys30, Phe13, and Leu11 (Table S9). An association with FL risk was found for HLA-DRB1∗07:01 that is also encoded by residues at 11, 13, 28, and 30 (p = 1.59 × 10⁻²⁰) (Table S9). Positions 11, 13, 28, and 30 reside in the middle of the HLA-DR heterodimer molecule in the peptide binding cleft (Figure S9) that specifically impact binding pockets 4, 6, and 7. These are key peptide binding anchors in DRβ120 that influence binding preferences of alleles,21 suggesting an important role for DRβ1 peptide presentation in follicular lymphomagenesis.
To identify independent HLA variants controlling for DRβ1 28 (used as a surrogate for the 11, 13, 28, and 30 group), we included all genotyped and imputed HLA SNPs, AAs, and alleles in a forward stepwise analysis. The most significant variant after controlling for DRβ1 28 was rs17203612 (p = 4.59 × 10⁻¹⁶), an intergenic SNP 39.2 kb and 99.7 kb downstream of HLA-DRA (MIM 142860) and HLA-DRB1, respectively (Figure 6; Table S10). A conditional analysis on DRβ1 28 and rs17203612 revealed that the next most statistically significant variant was rs3130437 (p = 8.23 × 10⁻⁹) located 15.6 kb downstream of HLA-C in HLA class I (Figure 6; Table S10). After controlling for DRβ1 28, rs17203612, and rs3130437, no additional signals with p < 5 × 10⁻⁸ were observed (Figure 6). Of note, we did see a residual signal (p = 8.18 × 10⁻⁶) at the functionally relevant DPβ1 Glu84 position,22 a reported risk locus for Hodgkin lymphoma.23 A conditional analysis of DRβ1 28, rs17203612, and rs3130437 eliminated the majority of residual effects for the previously reported HLA SNPs and alleles associated with FL (Table S11).
Figure 6.
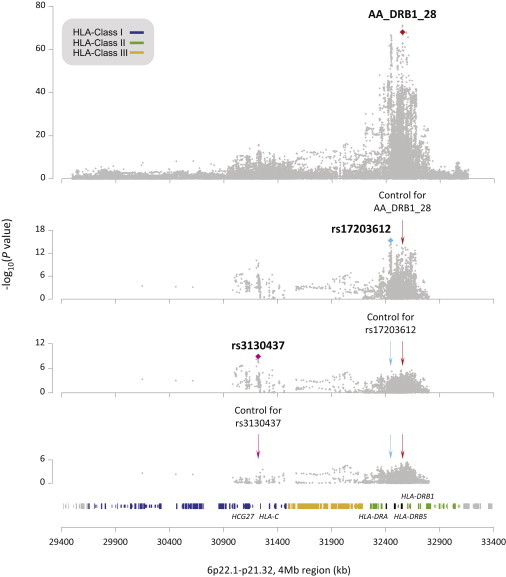
Sequential Conditioned Association Analysis in the HLA Region at 6p22.1-21.32: 29,400–33,400 kb
Each gray diamond represents the p value from the meta-analysis of the four GWASs. Among all the AAs and HLA alleles tested, the top associated signal mapped to the AA DRβ1 at position 28 (top). After conditioning on DRβ1 28, rs17203612 in the HLA class II region was the marker with the highest association (second from top). Further analysis conditioning on both signals revealed rs3130437 in HLA class I as the most significant associated marker (second from bottom). No additional genome-wide significant signals were observed after controlling for the effects of DRβ1 28, rs17203612, and rs3130437 (bottom). Plots derived using genome assembly hg19.
We conducted a series of preliminary bioinformatics analyses to explore the potential functional relevance of rs17203612 and rs3130437 using publicly available RNA sequencing expression and methylation data and found significant (FDR < 0.05) gene expression and methylation differences associated with rs17203612- and rs3130437-linked SNPs (Tables S12 and S13). Specifically, we found significant gene expression changes associated with rs12194148, a proxy for rs17203612, in class II (HLA-DRB5 [MIM 604776], HLA-DRB6, HLA-DRB1, HLA-DQB1, HLA-DQB2 [MIM 615161], HLA-DQA1, HLA-DQA2 [MIM 613503], BTNL2 [MIM 606000], C6orf25); and with rs3130439, a proxy for rs3130437, in HLA class I (PSORS1C2, PSORS1C3, DPCR1 [MIM 613928]) (Table S12). Of note, ten of the rs17203612-linked SNPs that showed correlation with higher HLA-DQB1 expression also showed correlation with lower HLA-DQB1 methylation levels (Table S12) that further supports the potential role of HLA class II FL-associated SNPs in HLA-DQB1 regulation.24,25 Additional eQTL analyses using microarray data also suggested potential eQTL associations with HLA-C, TCF19 (MIM 600912), and HLA-B expression (Table S14). However, we did not observe significant enrichment of particular regulatory markers within these associated regions, although overlap with some regulatory signals was observed (Table S15).
In summary, our study identified five non-HLA susceptibility alleles that were robustly associated with FL risk. Moreover, our work highlights the important role of HLA structural variants and regulatory SNPs in the etiology of FL, advances the catalog of HLA and non-HLA genetic variants associated with FL risk, and provides further evidence for a role of DRβ1 peptide presentation in FL. Functional studies will be required to elucidate the biological basis of these loci and to determine their role in follicular lymphomagenesis.
Acknowledgments
The overall FL GWAS project was supported by the intramural program of the Division of Cancer Epidemiology and Genetics, National Cancer Institute, NIH. A full list of Supplemental Acknowledgements is provided online.
Supplemental Data
Web Resources
The URLs for data presented herein are as follows:
1000 Genomes, http://browser.1000genomes.org
Gene Expression Omnibus (GEO), http://www.ncbi.nlm.nih.gov/geo/
glu-genetics, https://code.google.com/p/glu-genetics/
HaploReg, http://www.broadinstitute.org/mammals/haploreg/haploreg.php
IMPUTE2, http://mathgen.stats.ox.ac.uk/impute/impute_v2.html
Online Mendelian Inheritance in Man (OMIM), http://www.omim.org/
snptest, https://mathgen.stats.ox.ac.uk/genetics_software/snptest/old/snptest.html
References
- 1.Link B.K., Maurer M.J., Nowakowski G.S., Ansell S.M., Macon W.R., Syrbu S.I., Slager S.L., Thompson C.A., Inwards D.J., Johnston P.B. Rates and outcomes of follicular lymphoma transformation in the immunochemotherapy era: a report from the University of Iowa/MayoClinic Specialized Program of Research Excellence Molecular Epidemiology Resource. J. Clin. Oncol. 2013;31:3272–3278. doi: 10.1200/JCO.2012.48.3990. [DOI] [PMC free article] [PubMed] [Google Scholar]
- 2.Tan D., Horning S.J., Hoppe R.T., Levy R., Rosenberg S.A., Sigal B.M., Warnke R.A., Natkunam Y., Han S.S., Yuen A. Improvements in observed and relative survival in follicular grade 1-2 lymphoma during 4 decades: the Stanford University experience. Blood. 2013;122:981–987. doi: 10.1182/blood-2013-03-491514. [DOI] [PMC free article] [PubMed] [Google Scholar]
- 3.Smedby K.E., Foo J.N., Skibola C.F., Darabi H., Conde L., Hjalgrim H., Kumar V., Chang E.T., Rothman N., Cerhan J.R. GWAS of follicular lymphoma reveals allelic heterogeneity at 6p21.32 and suggests shared genetic susceptibility with diffuse large B-cell lymphoma. PLoS Genet. 2011;7:e1001378. doi: 10.1371/journal.pgen.1001378. [DOI] [PMC free article] [PubMed] [Google Scholar]
- 4.Conde L., Halperin E., Akers N.K., Brown K.M., Smedby K.E., Rothman N., Nieters A., Slager S.L., Brooks-Wilson A., Agana L. Genome-wide association study of follicular lymphoma identifies a risk locus at 6p21.32. Nat. Genet. 2010;42:661–664. doi: 10.1038/ng.626. [DOI] [PMC free article] [PubMed] [Google Scholar]
- 5.Skibola C.F., Bracci P.M., Halperin E., Conde L., Craig D.W., Agana L., Iyadurai K., Becker N., Brooks-Wilson A., Curry J.D. Genetic variants at 6p21.33 are associated with susceptibility to follicular lymphoma. Nat. Genet. 2009;41:873–875. doi: 10.1038/ng.419. [DOI] [PMC free article] [PubMed] [Google Scholar]
- 6.Vijai J., Kirchhoff T., Schrader K.A., Brown J., Dutra-Clarke A.V., Manschreck C., Hansen N., Rau-Murthy R., Sarrel K., Przybylo J. Susceptibility loci associated with specific and shared subtypes of lymphoid malignancies. PLoS Genet. 2013;9:e1003220. doi: 10.1371/journal.pgen.1003220. [DOI] [PMC free article] [PubMed] [Google Scholar]
- 7.Skibola C.F., Conde L., Foo J.N., Riby J., Humphreys K., Sillé F.C., Darabi H., Sanchez S., Hjalgrim H., Liu J. A meta-analysis of genome-wide association studies of follicular lymphoma. BMC Genomics. 2012;13:516. doi: 10.1186/1471-2164-13-516. [DOI] [PMC free article] [PubMed] [Google Scholar]
- 8.Wang Z., Jacobs K.B., Yeager M., Hutchinson A., Sampson J., Chatterjee N., Albanes D., Berndt S.I., Chung C.C., Diver W.R. Improved imputation of common and uncommon SNPs with a new reference set. Nat. Genet. 2012;44:6–7. doi: 10.1038/ng.1044. [DOI] [PMC free article] [PubMed] [Google Scholar]
- 9.Abecasis G.R., Altshuler D., Auton A., Brooks L.D., Durbin R.M., Gibbs R.A., Hurles M.E., McVean G.A., 1000 Genomes Project Consortium A map of human genome variation from population-scale sequencing. Nature. 2010;467:1061–1073. doi: 10.1038/nature09534. [DOI] [PMC free article] [PubMed] [Google Scholar]
- 10.Howie B.N., Donnelly P., Marchini J. A flexible and accurate genotype imputation method for the next generation of genome-wide association studies. PLoS Genet. 2009;5:e1000529. doi: 10.1371/journal.pgen.1000529. [DOI] [PMC free article] [PubMed] [Google Scholar]
- 11.Ward L.D., Kellis M. HaploReg: a resource for exploring chromatin states, conservation, and regulatory motif alterations within sets of genetically linked variants. Nucleic Acids Res. 2012;40(Database issue):D930–D934. doi: 10.1093/nar/gkr917. [DOI] [PMC free article] [PubMed] [Google Scholar]
- 12.Barenboim M., Manke T. ChroMoS: an integrated web tool for SNP classification, prioritization and functional interpretation. Bioinformatics. 2013;29:2197–2198. doi: 10.1093/bioinformatics/btt356. [DOI] [PMC free article] [PubMed] [Google Scholar]
- 13.Ernst J., Kheradpour P., Mikkelsen T.S., Shoresh N., Ward L.D., Epstein C.B., Zhang X., Wang L., Issner R., Coyne M. Mapping and analysis of chromatin state dynamics in nine human cell types. Nature. 2011;473:43–49. doi: 10.1038/nature09906. [DOI] [PMC free article] [PubMed] [Google Scholar]
- 14.Consortium E.P., Bernstein B.E., Birney E., Dunham I., Green E.D., Gunter C., Snyder M., ENCODE Project Consortium An integrated encyclopedia of DNA elements in the human genome. Nature. 2012;489:57–74. doi: 10.1038/nature11247. [DOI] [PMC free article] [PubMed] [Google Scholar]
- 15.Jia X., Han B., Onengut-Gumuscu S., Chen W.M., Concannon P.J., Rich S.S., Raychaudhuri S., de Bakker P.I. Imputing amino acid polymorphisms in human leukocyte antigens. PLoS ONE. 2013;8:e64683. doi: 10.1371/journal.pone.0064683. [DOI] [PMC free article] [PubMed] [Google Scholar]
- 16.Wang S.S., Abdou A.M., Morton L.M., Thomas R., Cerhan J.R., Gao X., Cozen W., Rothman N., Davis S., Severson R.K. Human leukocyte antigen class I and II alleles in non-Hodgkin lymphoma etiology. Blood. 2010;115:4820–4823. doi: 10.1182/blood-2010-01-266775. [DOI] [PMC free article] [PubMed] [Google Scholar]
- 17.Skibola C.F., Akers N.K., Conde L., Ladner M., Hawbecker S.K., Cohen F., Ribas F., Erlich H.A., Goodridge D., Trachtenberg E.A. Multi-locus HLA class I and II allele and haplotype associations with follicular lymphoma. Tissue Antigens. 2012;79:279–286. doi: 10.1111/j.1399-0039.2012.01845.x. [DOI] [PMC free article] [PubMed] [Google Scholar]
- 18.Purcell S., Neale B., Todd-Brown K., Thomas L., Ferreira M.A., Bender D., Maller J., Sklar P., de Bakker P.I., Daly M.J., Sham P.C. PLINK: a tool set for whole-genome association and population-based linkage analyses. Am. J. Hum. Genet. 2007;81:559–575. doi: 10.1086/519795. [DOI] [PMC free article] [PubMed] [Google Scholar]
- 19.Foo J.N., Smedby K.E., Akers N.K., Berglund M., Irwan I.D., Jia X., Li Y., Conde L., Darabi H., Bracci P.M. Coding variants at hexa-allelic amino acid 13 of HLA-DRB1 explain independent SNP associations with follicular lymphoma risk. Am. J. Hum. Genet. 2013;93:167–172. doi: 10.1016/j.ajhg.2013.05.020. [DOI] [PMC free article] [PubMed] [Google Scholar]
- 20.Stern L.J., Brown J.H., Jardetzky T.S., Gorga J.C., Urban R.G., Strominger J.L., Wiley D.C. Crystal structure of the human class II MHC protein HLA-DR1 complexed with an influenza virus peptide. Nature. 1994;368:215–221. doi: 10.1038/368215a0. [DOI] [PubMed] [Google Scholar]
- 21.Rapin N., Hoof I., Lund O., Nielsen M. The MHC motif viewer: a visualization tool for MHC binding motifs. Curr. Protoc. Immunol. Unit. 2010;18:17. doi: 10.1002/0471142735.im1817s88. [DOI] [PubMed] [Google Scholar]
- 22.Díaz G., Amicosante M., Jaraquemada D., Butler R.H., Guillén M.V., Sánchez M., Nombela C., Arroyo J. Functional analysis of HLA-DP polymorphism: a crucial role for DPbeta residues 9, 11, 35, 55, 56, 69 and 84-87 in T cell allorecognition and peptide binding. Int. Immunol. 2003;15:565–576. doi: 10.1093/intimm/dxg057. [DOI] [PubMed] [Google Scholar]
- 23.Taylor G.M., Gokhale D.A., Crowther D., Woll P.J., Harris M., Ryder D., Ayres M., Radford J.A. Further investigation of the role of HLA-DPB1 in adult Hodgkin’s disease (HD) suggests an influence on susceptibility to different HD subtypes. Br. J. Cancer. 1999;80:1405–1411. doi: 10.1038/sj.bjc.6690536. [DOI] [PMC free article] [PubMed] [Google Scholar]
- 24.Conde L., Bracci P.M., Richardson R., Montgomery S.B., Skibola C.F. Integrating GWAS and expression data for functional characterization of disease-associated SNPs: an application to follicular lymphoma. Am. J. Hum. Genet. 2013;92:126–130. doi: 10.1016/j.ajhg.2012.11.009. [DOI] [PMC free article] [PubMed] [Google Scholar]
- 25.Sillé F.C., Conde L., Zhang J., Akers N.K., Sanchez S., Maltbaek J., Riby J.E., Smith M.T., Skibola C.F. Follicular lymphoma-protective HLA class II variants correlate with increased HLA-DQB1 protein expression. Genes Immun. 2014;15:133–136. doi: 10.1038/gene.2013.64. [DOI] [PMC free article] [PubMed] [Google Scholar]
Associated Data
This section collects any data citations, data availability statements, or supplementary materials included in this article.