

Summary
Abnormal dendritic complexity is a shared feature of many neurodevelopmental disorders associated with neurological defects. Here, we found that the actin-crosslinking protein filamin A (FLNA) is overexpressed in tuberous sclerosis complex (TSC) mice, a PI3K-mTOR model of neurodevelopmental disease that is associated with abnormal dendritic complexity. Both under-and overexpression of FLNA in wild-type neurons led to more complex dendritic arbors in vivo, suggesting that an optimal level of FLNA expression is required for normal dendritogenesis. In Tsc1null neurons, knocking down FLNA in vivo prevented dendritic abnormalities. Surprisingly, FLNA overexpression in Tsc1null neurons was dependent on MEK1/2 but not mTOR activity despite both pathways being hyperactive. In addition, increasing MEK-ERK1/2 activity led to dendritic abnormalities via FLNA and decreasing MEK-ERK1/2 signaling in Tsc1null neurons rescued dendritic defects. These data demonstrate that altered FLNA expression increases dendritic complexity and contributes to pathologic dendritic patterning in TSC in an mTOR-independent, ERK1/2-dependent manner.
Introduction
Dendritic arborization determines the synaptic connectivity and input integration that are necessary for proper network function. As such, alterations in dendritic morphology affect network activity and stability (Hausser et al., 2000; Jan and Jan, 2010; Sjostrom et al., 2008). Anomalies in dendritic morphology are observed in and contribute to the pathology of many neurodevelopmental and neurodegenerative disorders (Dierssen and Ramakers, 2006; Jan and Jan, 2010; Nestor and Hoffman, 2012). In particular, abnormal dendritic complexity is a shared feature of neurodevelopmental disorders associated with cognitive and social impairments, and altered TSC-mTOR signaling (Crino et al., 2006; Feliciano et al., 2013a; Kwiatkowski and Manning, 2005; Kwon et al., 2006). Tuberous sclerosis complex (TSC) is one such neurodevelopmental disorder. However, the molecules responsible for increased dendritic arborization in TSC remain elusive.
TSC is due to mutations in either TSC1 or TSC2, whose protein products form a functional complex. The major function of the TSC complex is to repress the activity of Ras homolog enriched in brain (Rheb), the canonical activator of mTOR complex 1 (mTORC1). Thus, loss of Tsc1 in neurons results in hyperactive mTORC1 and morphological changes such as increased soma size and dendritic hypertrophy (Feliciano et al., 2011; 2012; 2013a; Meikle et al., 2007; Neuman and Henske, 2011). To identify dysregulated genes that may contribute to dendritic overgrowth in TSC, we performed a PCR array from conditional Tsc1 knockout mouse tissue and found that the filamin A (Flna) transcript was significantly elevated. Although FLNA has no documented role in dendritic morphogenesis, its well-studied role in cytoskeletal reorganization prompted us to ask whether FLNA might also regulate dendritogenesis and contribute to pathologic dendritic arborization in TSC.
FLNA is a scaffolding protein with actin cross-linking capacity that couples extracellular signaling to the cellular cytoskeleton (Nakamura et al., 2011). As a result, FLNA regulates diverse aspects of cell development, including filopodia formation in non-neuronal cells (Ohta et al., 1999), growth cone progression in drosophila (Zheng et al., 2011), proliferation of cortical neural progenitors (Carabalona et al., 2012; Lian et al., 2012), and migration of diverse cell types (Baldassarre et al., 2009; Cunningham et al., 1992; Fox et al., 1998; Xu et al., 2010) including developing cortical neurons (Nagano et al., 2004; Sarkisian et al., 2006, 2008). Consistent with a role in neurodevelopment, human FLNA loss-of-function mutations result in the brain disorder X-linked periventricular nodular heterotopia (Eksioglu et al., 1996; Fox et al., 1998). Despite documented roles for FLNA in cell morphogenesis, neurite extension, and neural growth cone dynamics (Letourneau and Shattuck, 1989), it remains unknown whether FLNA also regulates dendritic morphogenesis.
Here, we set out to address whether FLNA contributes to normal dendritic patterning and pathological dendritic arborization in TSC using combined genetic, pharmacologic, and physiological approaches. We first verified our array data by confirming that FLNA levels are elevated in Tsc1null neurons. We then established a physiological role for FLNA in normal dendritic morphogenesis. Next, we found that normalizing FLNA levels in Tsc1null neurons prevented abnormal dendritic morphology. We then sought to identify the molecular mechanism responsible for elevated FLNA levels in TSC. Although hyperactive mTORC1 signaling is known to increase protein translation and our initial observation was that Flna transcription is increased in Tsc1null neurons, we were still surprised to find that FLNA expression was resistant to mTOR blockers. Therefore we examined ERK1/2 because Flna transcription is predicted to be ERK1/2-dependent (D’Addario et al., 2002; 2006; Tan and Khachigian, 2009) and ERK1/2 is hyperactive in TSC individuals and mouse models of TSC (Magri et al., 2011; Maldonado et al., 2003). We found that a MEK-ERK1/2-dependent increase in FLNA levels contributes to pathological dendritic complexity in TSC. In addition, blocking MEK-ERK1/2 activity in Tsc1null neurons after dendritic defects have been established is sufficient to rescue the dendritic phenotype. Collectively, our findings identify FLNA as a novel player in dendritic morphogenesis and uncover an mTORC1-independent, ERK1/2-dependent increase in FLNA downstream of TSC1/TSC2 signaling that contributes to dendritic anomalies in Tsc1null neurons. Because mTORC1 inhibition can partially rescue dendritic pathology without rescuing FLNA levels, we propose that elevated MEK-ERK1/2-FLNA and hyperactive mTORC1 independently contribute to dendritic anomalies in TSC.
Results
Identification of elevated Flna mRNA in Tsc1null neurons
To identify genes whose altered expression might contribute to morphological dysfunction in disorders of the TSC-mTORC1 signaling pathway, we used a quantitative (q) RT-PCR array to assess the levels of 84 neurogenesis genes in Tsc1null neuron-containing olfactory bulbs (OB). To generate Tsc1null neurons in the OB, we exploited the fact that neural stem cells located in the subventricular zone (SVZ) along the lateral ventricle generate OB neurons postnatally and that are easily electroporated neonatally (Boutin et al., 2008; Lacar et al., 2010; Platel et al., 2010). We electroporated a Cre recombinase-encoding plasmid (Cre) at postnatal day (P) 0 into SVZ neural stem cells of Tsc1fl/mut mice (fl, floxed, mut: mutant, loss-of-function mutation) crossed with tdTomato reporter mice (R26RtdTomato/Tsc1fl/mut mice abbreviated RTsc1fl/mut mice) (Figure 1A and B, and Table S1 for a list of plasmids). In these mice, Cre electroporation led to tdTomato expression and excision of the floxed Tsc1 allele in both neural stem cells and their progeny as we previously reported (Feliciano et al., 2012) (data not shown). We used Tsc1fl/mut mice to match the genetics of TSC individuals who are heterozygous for one of the TSC alleles (TSC1 or TSC2) but harbor neurons that lose the second TSC allele during development (Au et al., 2004; Feliciano et al., 2013a; Kwiatkowski and Short, 1994). As a control, we used the contralateral OB that does not contain electroporated cells.
Figure 1. Flna mRNA is increased in Tsc1null neurons.
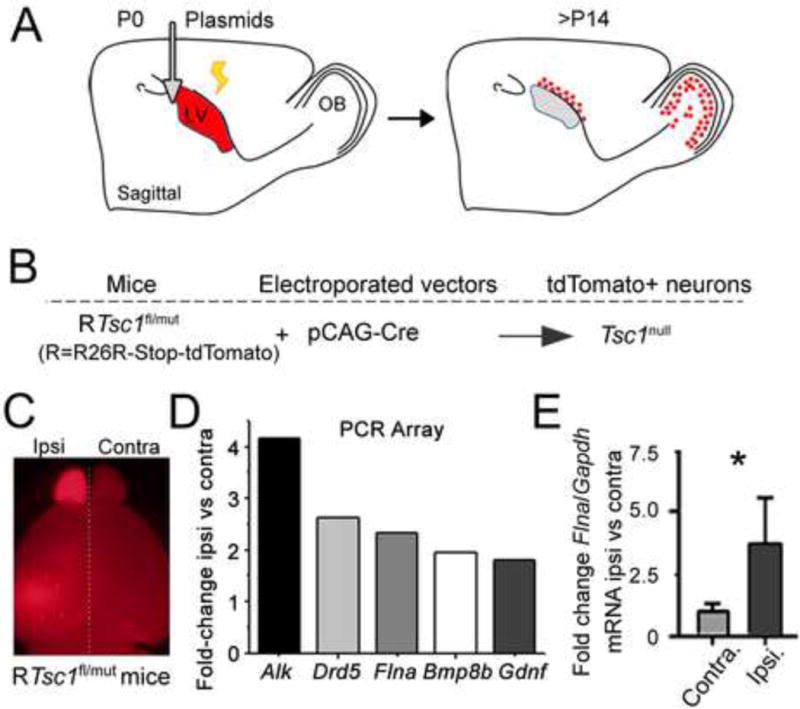
(A) Diagram illustrating electroporation in P0 neonates. Most transfected newborn neurons reach their final location in the olfactory bulb (OB) by P14. (B) Diagram of the experimental protocol. Electroporation of a Cre-encoding vector in RTsc1fl/mut mice results in tdTomato expression and deletion of the Tsc1 floxed allele. (C) Images of the ipsilateral (ipsi) brain containing Tsc1null neurons in the olfactory bulb (OB) and contralateral brain (contra) devoid of electroporated neurons from RTsc1fl/mut mice. (D) Fold-change (>1.5) of five transcripts in P14 ipsilateral (electroporated) versus contralateral (unelectroporated) OB from RTsc1fl/mut mice electroporated with a Cre-encoding plasmid. (E) qRT-PCR of normalized Flna/Gapdh fold-change from the ipsilateral OB containing Tsc1null neurons (black) and from the contralateral OB (grey, N=3 OB each, P21, P<0.05).
We performed a qRT-PCR array on mRNA from electroporated (ipsilateral) P14 OBs and from contralateral (control) OBs (N=2 per condition, Figure 1C). Of the 84 genes in the array, we found that the mRNA of 5 genes (Alk, Drd5, Flna, Bmp8b, and Gdnf) were upregulated by >1.5-fold in both Tsc1null samples compared to control samples while several mRNA were downregulated (Figure 1D and Table S2). We focused on the actin cross-linking protein FLNA due to its proposed role in neurite morphogenesis. We confirmed the increase in Flna gene expression by qRT-PCR of Flna mRNA from the OB containing Tsc1null neurons and the contralateral unelectroporated Tsc1fl/mut OB (Figure 1E). Using Gapdh as a control, we found that Flna mRNA levels were ~4-fold higher in the OB containing Tsc1null neurons compared to the control OB (N=3, P<0.05, Student’s t-test, Figure 1E).
Tsc1 deletion and hyperactive Rheb increase FLNA protein expression
To determine whether increased Flna mRNA led to increased FLNA protein expression, we immunoblotted for FLNA in three different systems: conditional Tsc1 knockout mice, cell culture, and tissue from human TSC patients. Conditional Tsc1 knockout mice were generated by crossing the RTsc1fl/mut and RTsc1fl/wt mice with Emx1Cre mice (crossed mice abbreviated). EMX1 is expressed by embryonic day (E) 9.5 in a subpopulation of dorsal telencephalic radial glia that generate cortical pyramidal neurons, astrocytes, and OB neurons (Gorski et al., 2002). Thus, crossing RTsc1fl/mut with Emx1Cre generates a conditional Tsc1 knockout (RTsc1cKO), in which Emx1-dependent Cre expression results in Tsc1 loss of heterozygosity (Tsc1null) in cortical astrocytes, cortical neurons, and OB neurons. For controls, we used conditional Tsc1 heterozygote (RTsc1cHet) littermates, in which Emx1-driven Cre expression generates Tsc1 heterozygous cells (Tsc1het). As previously reported, Cre recombination led to tdTomato expression and enlarged cortices in RTsc1cKO mice compared to RTsc1cHet littermates (Carson et al., 2012; Magri et al., 2011) (Figure 2A).
Figure 2. Tsc1 deletion in vivo and Rheb hyperactivation in vitro increased FLNA protein expression.
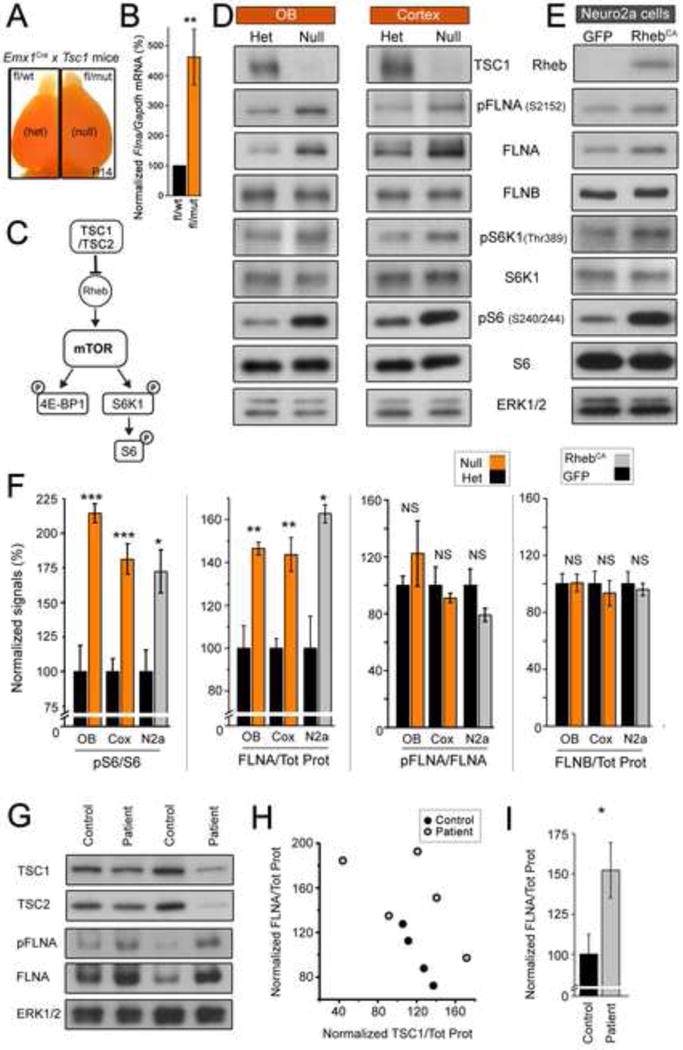
(A) Fluorescent (tdTomato) images of P14 RTsc1cHet and RTsc1cKO mice (for R26R/Emx1Cre/Tsc1fl/wt or Tsc1fl/mut). (B) qRT-PCR Flna/Gapdh transcript levels in the cortex of RTsc1cHet and RTsc1cKO mice. (C) Diagram illustrating TSC-mTORC1 pathway. (D and E) Immunoblots for FLNA, pFLNA, FLNB, and various proteins in the TSC-mTORC1 pathway and their phosphorylated forms from P7 cortex or P14 OB (D, red) of RTsc1cHet and RTsc1cKO mice and from Neuro2a (N2a) cells (E, grey). (F) Normalized % changes for pS6/S6, FLNA/total protein (Tot Prot), and pFLNA/FLNA. (G) Immunoblots from human cortical tissue from control and TSC patients. Control and TSC samples were alternated and probed on the same membrane without specific order. (H) Plot of FLNA/Tot Prot vs TSC1/Tot Prot from control (black) and TSC patients (grey). (I) Normalized % changes for FLNA/Tot Prot. Statistical analysis: Student’s t-test in (B and I) and One Way ANOVA in (F). ***, p<0.001; **, p<0.01; *, p<0.05; NS, not significant. See also Figure S1 and Table S1 and S2.
We first verified that Flna transcript levels are elevated in RTsc1cKO using qRT-PCR. Flna mRNA was significantly increased in P7 RTsc1cKO compared to RTsc1cHet cortices (by 360%, N=4 mice, Student’s t-test, Figure 2B). Second, we verified that Tsc1 deletion increases mTORC1 activity and tested whether FLNA protein levels were increased in RTsc1cKO mice. We immunoblotted tissue from P7 cortex (N=4) and P14 OB (N=5) and assessed mTORC1 by p70 S6 kinase 1 phosphorylation (pS6K1), a direct target of mTORC1, and phosphorylated ribosomal protein S6 (pS6), a target of S6K1. Using ERK1/2 or amido black (i.e. total protein) as a loading control we found that both the cortex and OB of RTsc1cKO mice display significant increases in mTORC1 activity and FLNA expression without alterations in relative FLNA phosphorylation (one-way ANOVA with Tukey post-test throughout the manuscript unless mentioned otherwise, P value in figure legend, Figure 2C, D and F). FLNA belongs to a family of actin-binding proteins, of which only one other member, FLNB, is expressed in the central nervous system (Takafuta et al., 1998). FLNB levels were not altered in cortices or OBs of RTsc1cKO mice (Figure 2D and F).
Next, we used an in vitro system to rule out that increased FLNA is a nonspecific consequence of seizure activity that occurs in RTsc1cKO mice (Magri et al., 2011). Neuro2a cells were transfected with either a plasmid encoding constitutively active Rheb (RhebCA), a downstream target of the TSC complex that activates the mTORC1 pathway, or a control plasmid encoding GFP (Figure 2C) (Lafourcade et al., 2013; Maehama et al., 2008). Immunoblots performed 48 hours post-transfection revealed that RhebCA transfection leads to a significant increase in mTORC1 activity as indicated by increased levels of pS6K1 and pS6 (n=3 each, Figure 2E and F, and Figure S1). RhebCA transfection also led to a significant increase in FLNA levels without affecting its degree of phosphorylation and did not alter FLNB levels (Figure 2E and F). As such, disruptions of the TSC pathway can lead to elevated FLNA levels in the absence of seizures.
Finally, we obtained prefrontal cortical tissue from human male patients with TSC and age-matched male individuals without any known pathology (Table S3). TSC patients displayed variability in the levels of TSC1 or TSC2 levels (Figure 2G and H). Such variability among TSC patients could be accounted for by differences in several parameters including (but not limited to) the ages of the patients, the degree of seizure activity and drug treatment, the type of mutation, and the degree of gliosis. Despite the variability, 4 out of 5 TSC patients displayed FLNA levels above that of control patients (Figure 2G and H) and contributed to a significant net increase in FLNA levels compared to control patients (P<0.001, Student’s t-test, Figure 2I). Collectively, these data show that FLNA gene expression and protein levels are increased in cells with decreased TSC function in mouse models and humans thus warranting us to examine the role of FLNA in dendritic development and alterations in TSC.
An optimal FLNA level is required for proper dendritic morphogenesis
To investigate whether FLNA is a physiologic regulator of dendritic morphogenesis in vivo we employed neonatal electroporation to manipulate FLNA levels in developing neurons (Figure 1A for diagram). FLNA and control plasmids were electroporated into wild type SVZ cells of P0 wild-type mice using the method outlined in Figure 1A. During division, electroporated neural progenitors pass their exogenous plasmids on to neuroblasts, which migrate to and integrate into the OB. By 2 weeks, these neuroblasts differentiate into GABAergic interneurons with both an apical and basal dendrite. We assessed the complexity and length of the basal dendrites of transfected neurons in vivo at 14 and 28 days post-electroporation by sholl analysis of coronal sections from littermate mice (Figure 3A).
Figure 3. Too much or too little FLNA increases dendritic complexity of newborn neurons.
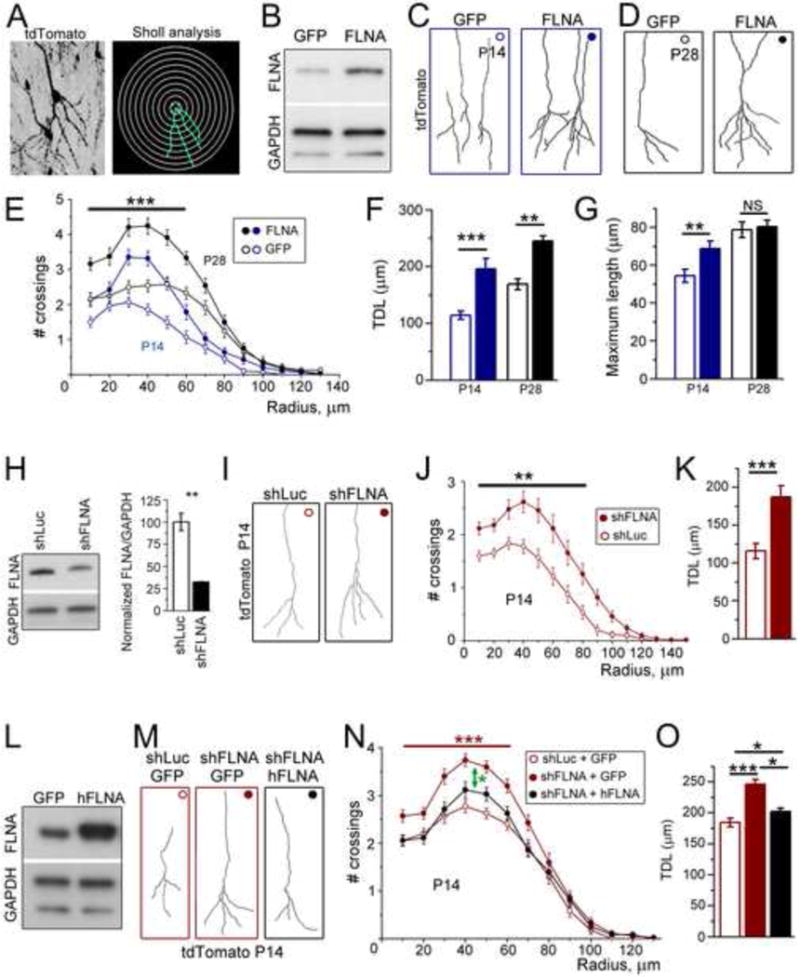
(A) Image and reconstruction of the basal dendrite of an OB granule cell expressing tdTomato with superimposed concentric circles for sholl analysis. (B) Immunoblots for FLNA and GAPDH from Neuro2a cells transfected with pCAG-GFP or pCAG-FLNA. (C and D) Reconstructions of OB tdTomato+ neurons expressing GFP or FLNA plasmid at P14 (C) and P28 (D). (E) # crossings as a function of distance for the basal dendrites of tdTomato+ neurons at P14 (blue) and P28 (black) and transfected with pCAG-GFP (open) or pCAG-FLNA (filled). The differences marked with the bar and *** is between the two plasmid conditions at each age. (F and G) Total dendritic length (F) and maximum length (G) corresponding for the age and conditions shown in (E). (H) Left panel: Immunoblots for FLNA and GAPDH from Neuro2a cells transfected with shRNA against luciferase (shLuc) or FLNA (shFLNA). Right panel: Quantification of the blots. (I) Reconstructions of P14 OB tdTomato+ neurons expressing shLuc or shFLNA. (J) # crossings as a function of distance for the basal dendrites of tdTomato+ neurons at P14 transfected with shLuc (open) or shFLNA (filled). (K) Total dendritic length of shLuc and shFLNA-expressing neurons. (L) Immunoblots for FLNA and GAPDH from Neuro2a cells transfected with GFP or human FLNA (hFLNA). (M) Reconstructions of P14 OB tdTomato+ neurons expressing shLuc + GFP, shFLNA + GFP (both red), or shFLNA + hFLNA (black). (N) # crossings as a function of distance for the basal dendrites of P14 tdTomato+ neurons. The green arrow indicates statistical analysis between the two top curves. The red bar and *** indicate statistical analysis between the red curves. (O) Total dendritic length of neurons transfected with the vectors indicated in the legend. Statistical analyses: Student’s t-test (H and K), one way ANOVA (F, G, and O) and 2-way repeated measures ANOVA with post hoc Bonferroni’s test for sholl data. ***: p<0.001; **: p<0.01; * p<0.05. Immunoblots in each panel are from the same membrane. See also Figure S2 and Table S3 and S4.
To evaluate the effect of FLNA overexpression, we used a plasmid encoding FLNA followed by GFP driven by an internal ribosomal entry site (pCAG-FLNA) and a plasmid encoding GFP alone (pCAG-GFP) as a control. pCAG-FLNA was validated by transfecting Neuro2a cells (Figure 3B). To determine whether pCAG-FLNA was sufficient to increase FLNA levels in neurons, we electroporated pCAG-FLNA or pCAG-GFP in vivo into SVZ cells at P0 and cultured transfected OB neurons 7 days post-electroporation. Transfected neurons were visualized by co-transfecting with a plasmid encoding tdTomato (pCAG-tdTomato) in addition to pCAG-FLNA or pCAG-GFP because the GFP fluorescence in pCAG-FLNA vector was faint. Because electroporation only transfects a subset of cells, the cultures contained a mix of tdTomato+/FLNA+ neurons or tdTomato+/GFP+ neurons with non-transfected neurons (Figure S2). tdTomato-expressing neurons transfected with the pCAG-FLNA displayed increased FLNA immunostaining compared to surrounding tdTomato-negative cells (Figure S2A).
Having validated the pCAG-FLNA plasmid, we tested whether neuronal FLNA overexpression alters dendritic development in vivo. Sholl analysis revealed that FLNA overexpression significantly alters the basal dendrite by increasing dendritic complexity, total dendritic length, and the length of the longest dendrite (i.e., maximum length) at P14 (2-way repeated measures ANOVA with post hoc Bonferroni’s test, n=28 neurons, N=4 mice each, Figure 3C–G). At P28, FLNA-overexpressing neurons displayed a persistent increase in dendritic complexity and a concomitant increase in total dendritic length, however the maximum length was similar to controls (n=24 neurons, N=4 each, Figure 3C–G).
We next evaluated the consequence of decreasing FLNA levels on dendritic development. To do so we utilized a GFP-expressing plasmid that also encodes a short hairpin RNA (shRNA) directed against either FLNA (shFLNA) or luciferase (shLuc, control). In Neuro2a cells, shFLNA significantly decreased FLNA protein levels relative to shLuc (n=3, Figure 3H). Similarly, newborn neurons cultured 7 days after in vivo co-electroporation of shFLNA and pCAG-tdTomato displayed decreased FLNA expression compared to surrounding non-transfected neurons (Figure S2B). Unexpectedly, shFLNA-electroporated neurons also displayed increased dendritic complexity at P14 in vivo compared to shLuc-transfected neurons (n=50 neurons each, N=8 each, Figure 3I and J). The increased dendritic complexity was accompanied by significantly increased total and maximum dendritic length (Figure 3K). This effect was unlikely to be due to an off-target effect of shFLNA because it was prevented by co-transfection with an shFLNA-resistant human FLNA-encoding plasmid (n=35 each, N=6 each, Figure 3L–O).
Collectively, these data show that both elevated and decreased FLNA expression result in increased dendritic complexity of wild-type newborn neurons. This suggests that an optimal level of FLNA is required for proper dendritic morphogenesis.
Decreasing FLNA levels prevents increased dendritic complexity in Tsc1null neurons
FLNA overexpression is sufficient to increase dendritic complexity in wild type neurons and Tsc1null neurons exhibit more complex dendritic arborization in the context of elevated FLNA expression. Therefore, we examined whether decreasing FLNA levels in Tsc1null neurons is sufficient to prevent dendritic overgrowth. In order to do so, we co-expressed shFLNA and a Cre encoding plasmid in RTsc1fl/mut and RTsc1fl/wt neurons. First, we ensured that shFLNA normalized FLNA levels in Tsc1null neurons by nucleofecting RTsc1fl/mut and RTsc1fl/wt neurons with Cre and shFLNA or shLuc (Figure 4A). Using this approach, >70% of the neurons were transfected as visually assessed using the co-expression of tdTomato (data not shown). After 7 days in vitro to allow for loss of TSC1 (Feliciano et al., 2011), we immunoblotted for pS6, S6, FLNA, and ERK1/2 levels. As expected, Tsc1null neurons displayed significantly increased FLNA and pS6 levels (Figure 4B and C, N=3 each). Importantly, shFLNA decreased FLNA levels in Tsc1null neurons from 215% to 130% of that of Tsc1het (Figure 4B and C).
Figure 4. Knockdown of FLNA prevents increased dendritic complexity in newborn Tsc1null neurons.
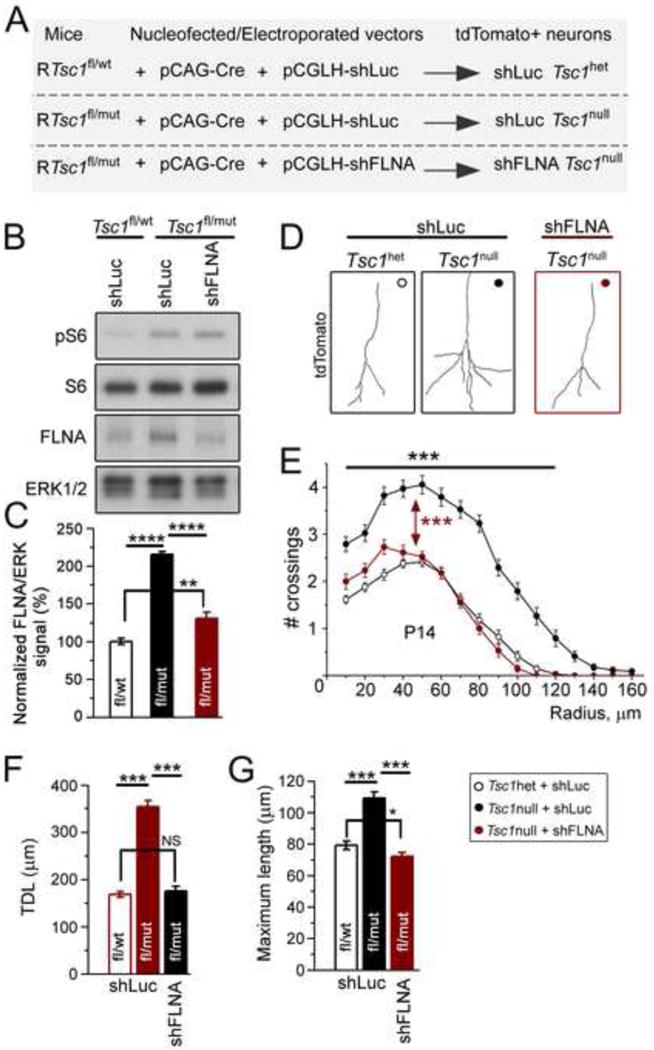
(A) Diagram detailing the mice and vectors used for electroporation. Electroporation of a Cre encoding vector in dissociated neurons (in B) or neural progenitor cells in vivo (in D to G) from RTsc1fl/wt or RTsc1fl/mut mice results in tdTomato expression (R26R-tdTomato mice) and Tsc1 excision. (B and C) Western blots (B) for pS6, S6, FLNA, and ERK1/2 and bar graphs of FLNA/ERKs signals (C) from cortical neurons under conditions shown above the blots. Neurons were isolated at P0 from RTsc1fl/wt and RTsc1fl/mut mice and nucleofected with Cre and either shLuc or shFLNA. (D) Reconstructions of the basal dendrites of P14 Tsc1het and Tsc1null neurons transfected with shLuc or shFLNA (red). (E) Sholl analysis for neurons whose examples are shown in D. The statistical analysis (***) refers to Tsc1het compared to Tsc1null (both with shLuc) and Tsc1null + shLuc compared to Tsc1null + shFLNA. (F and G) Total dendritic length (TDL, E) and maximum length (F) of Tsc1het and Tsc1null neurons with or without shFLNA. ****: p<0.0001; ***: p<0.001. See also Figure S3 and Table S1 and S4.
We then asked whether decreasing FLNA using shFLNA is sufficient to prevent dendritic dysmorphogenesis of Tsc1null neurons in vivo. Tsc1null neurons were generated in the OB of Tsc1fl/mut mice by neonatal electroporation of a Cre-encoding plasmid. At P14 and P28, the dendritic trees of shFLNA-expressing Tsc1null neurons were compared to those of Tsc1null and Tsc1het neurons transfected with the control shLuc plasmid. As previously reported (Feliciano et al., 2012), Tsc1null neurons in the OB displayed increased dendritic complexity compared to Tsc1het neurons (n=34 neurons each, N=4 mice each, Figure 4D and E). Analysis at P14 showed that knocking down FLNA in Tsc1null neurons significantly reduced their dendritic complexity and total dendritic length, normalizing them to those of Tsc1het neurons (n=34 neurons each, N=4 each, Figure 4D–G). At P28, Tsc1null neurons transfected with shFLNA also displayed a significant decrease in dendritic complexity and total dendritic length, however they were not normalized when compared to Tsc1het dendrites (n=32 neurons each, N=4 each, Figure S3A and B). This is likely due to the progressive dilution of the shFLNA plasmid in later born Tsc1null neurons subsequent to multiple rounds of neural progenitor division (Lacar et al., 2010). We also found that knocking down FLNA in Tsc1het neurons likewise reduced their dendritic complexity and total dendritic length (n=34 neurons each, N=4, Figure S3C–E).
Reducing FLNA-levels in Tsc1null neurons normalizes synaptic event frequency
Abnormal dendritic patterning should alter network integration and synaptic activity. In order to evaluate the physiological consequences of altered dendritic complexity we obtained patch clamp recordings of neurons between P21–P25. We found that Tsc1het and Tsc1null neurons with shLuc or shFLNA displayed current-induced action potentials (Figure 5A). Tsc1null neurons (with shLuc) displayed significantly hyperpolarized resting membrane potentials (−76 versus −68 mV in Tsc1het neurons) and decreased input resistance (187 versus 414 MΩ in Tsc1het neurons, i.e. increased cell conductance) compared to Tsc1het neurons (n=6 Tsc1het and 6 Tsc1null neurons, Figure 5B and C). In addition, Tsc1null neurons displayed a significantly increased frequency of miniature synaptic currents (in the presence of 1 μM tetrodotoxin) compared to Tsc1het neurons (1.7 Hz vs 0.9 Hz in Tsc1het neurons, Figure 5D and E). This finding is consistent with an increased total dendritic length providing more area for synaptic contacts. Importantly, knocking down FLNA normalized the frequency of synaptic inputs consistent with its normalization of dendritic morphology and length. However, it did not prevent the changes in resting membrane potentials or cell conductance (n=7 Tsc1null neurons with shFLNA, Figure 5B, C, and E).
Figure 5. Knockdown of FLNA normalizes synaptic frequency in newborn Tsc1null neurons.
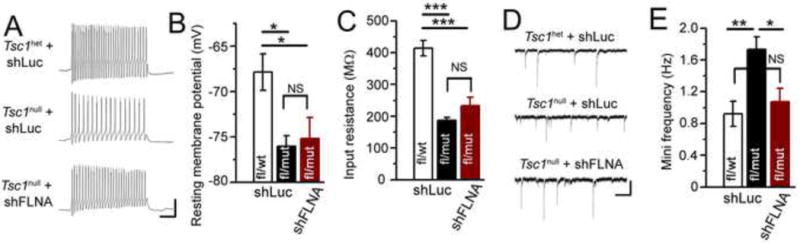
(A) Representative examples of current-induced action potentials in tdTomato+ granule neurons in acute OB slices. (B) Mean resting membrane potentials from neurons whose examples of action potentials are shown in A. (C) Mean input resistance from Tsc1het (n=6) and Tsc1null neurons with shLuc (n=5) or shFLNA neurons (n=7). (D) Representative examples of miniature synaptic currents recorded in the presence of tetrodotoxin. (E) Frequency of miniature synaptic currents of tdTomato+ neurons. Statistic: One way ANOVA with ***: p<0.001; **: p<0.01; * p<0.05. Scale bars: 40 mV/100 ms (A) and 40 pA/600 ms (C).
Collectively, these data suggest that FLNA contributes to an increase in dendritic complexity and total length, and an associated increase in synaptic input density in Tsc1null neurons. Normalizing FLNA levels in Tsc1null neurons is sufficient to prevent these dendritic and synaptic anomalies.
Hyperactive MEK1/2, not mTORC1, is responsible for increased FLNA downstream of TSC-Rheb
Because the mTORC1 pathway is the canonical pathway increased in TSC, we examined whether elevated FLNA levels following TSC1 loss are mTORC1-dependent. RTsc1cKO mice were treated with the mTORC1 blocker, rapamycin at a dose of 0.5 mg/kg rapamycin (4 injections every other day from P7 to P14). Rapamycin significantly reduced mTORC1 activity in OB tissue containing Tsc1null cells as indicated by reduced pS6 levels, however rapamycin had no effect on FLNA levels (N=3 each, Figure 6A and B). FLNA levels were similarly unchanged in rapamycin-treated and RTsc1cHet mice despite significantly reduced pS6.
Figure 6. FLNA overexpression is sensitive to MEK-ERK1/2 blockade but insensitive to mTOR blockade.
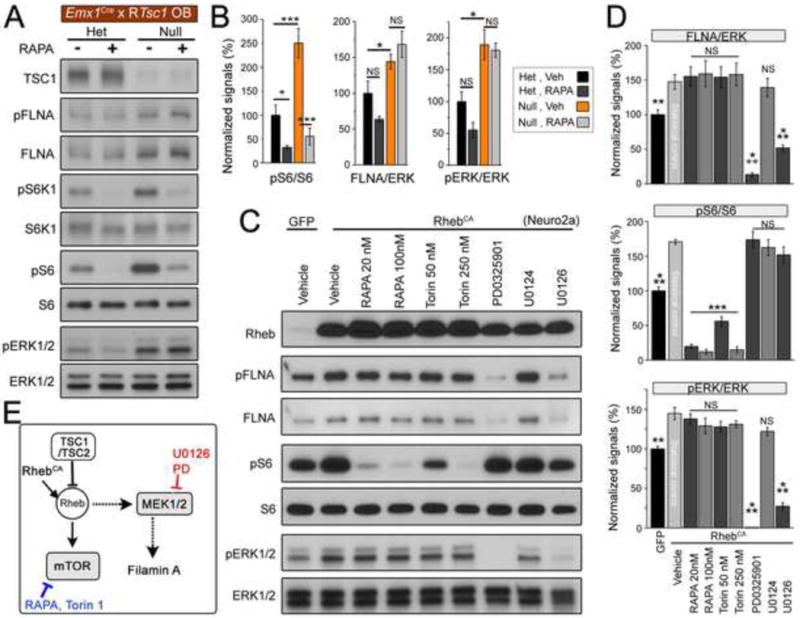
(A) Immunoblots for FLNA, S6K1, S6, ERK1/2, and their respective phosphorylated forms from P14 OB of RTsc1cHet and RTsc1cKO mice (N=3 each). (B) Normalized % changes for pS6/S6, FLNA/ERK1/2, and pERK1/2/ERK1/2 in RTsc1cHet (black) and RTsc1cKO mice (red) with or without rapamycin treatment in vivo. (C) Immunoblots for FLNA, S6, ERK1/2, and their phosphorylated forms in GFP (control) and RhebCA-transfected Neuro2a cells treated with vehicle, mTOR (rapamycin and Torin 1) blockers, or MEK-ERK1/2 blockers, PD0325901 (PD, 2 μM) and U0126 (20 μM, n=3 sets of Neuro2a cells). U0124 (20 μM) is the inactive form of U0126. (D) Normalized % changes for pS6/S6, FLNA/ERK, and pERK/ERK in GFP and RhebCA-transfected cells. (E) A simplified model of TSC-mTOR-MEK-FLNA and the sites of actions of drugs and plasmids used for data acquisition. Dotted lines indicate that the mechanisms linking Rheb to MEK1/2 and FLNA remain unknown. ***: p<0.001; **: p<0.01; * p<0.05. See also Figure S4 and Tables S1 and S4.
Because in vivo treatments can be associated with variable drug titers, we replicated our in vivo mTOR inhibitor findings in an in vitro system. Once again, Neuro2a cells transfected with RhebCA displayed increased FLNA expression (Figure 6C and D and see Figure 2). In these cells, elevated pS6 was significantly reduced by the mTORC1 inhibitor rapamycin and the mTOR kinase inhibitor Torin 1 (Figure 6C and D). We tested Torin 1 because it inhibits mTOR kinase activity directly, thereby inhibiting both mTORC1 and mTORC2. Torin 1 inhibits mTOR activity more uniformly whereby rapamycin preferentially blocks mTOR activity toward S6K1 (Choo et al., 2008; Thoreen et al., 2009). Despite reducing mTOR activity, neither rapamycin nor Torin 1 significantly reduced FLNA levels in RhebCA-transfected Neuro2a cells (Figure 6C and D). These data suggest that both Tsc1 deletion and Rheb hyperactivity increase FLNA expression in an mTOR-insensitive manner.
Although the mTORC1 pathway is the best-studied pathway in TSC, the MEK-ERK1/2 pathway is another critical regulator of cell growth and development that has been shown to be hyperactive in TSC (Chevere-Torres et al., 2012; Magri et al., 2011; Maldonado et al., 2003). In addition, FLNA transcription is predicted to be under the regulation of the MEK-ERK1/2 pathway (D’Addario et al., 2002; 2006; Tan and Khachigian, 2009). We therefore tested whether elevated FLNA in RTsc1cKO mice is due to hyperactive MEK-ERK1/2 pathway activity. Consistent with previous findings, we found that ERK1/2 activity is significantly increased in RTsc1cKO mice (Magri et al., 2011 and validated here, N=3 mice, Figure 6A and B). In vitro, RhebCA also increased MEK1-ERK1/2 activity as assessed with pERK1/2 (Figure 6C and D). Therefore we hypothesized that hyperactive MEK-ERK1/2 pathway activity, not mTORC1 activity, is responsible for elevated FLNA downstream of Tsc1 deletion and RhebCA overexpression.
To test this, we first treated RhebCA-transfected Neuro2a cells with two MEK1 inhibitors, PD0325901 and U0126. Control cells were treated with either vehicle or U0124, the inactive form of U0126. The concentration of MEK1 inhibitors used in these experiments was determined by testing a range of concentrations and immunoblotting for pERK1/2 (n=3, Figure S4). Consistent with our hypothesis, both U0126 and PD0325901 significantly reduced MEK-ERK1/2 pathway activity as well as FLNA levels (Figure 6C and D). Critically, neither MEK1 inhibitor altered mTORC1 activity as demonstrated by persistently elevated pS6 levels (Figure 6C and D). Thus, MEK1 inhibition is sufficient to reduce FLNA levels in the context of elevated mTORC1 signaling.
Collectively, these data suggest that although mTOR and MEK-ERK1/2 activities are increased in parallel subsequent to Tsc1 deletion or Rheb hyperactivation, elevated FLNA expression is due to elevated MEK-ERK1/2 and not mTOR activity (model in Figure 6E). We next sought to establish a causal relationship between MEK-ERK1/2-FLNA and the dendritic abnormalities in the context of TSC.
Hyperactive MEK-ERK1/2 signaling increases dendritic complexity via FLNA in Tsc1null neurons
First, we assessed whether increasing MEK-ERK1/2 activity in wild type neurons is sufficient to recapitulate the dendritic abnormalities seen in Tsc1null neurons; and if so, whether MEK-ERK1/2 dendritic defects require up-regulation of FLNA expression (Figure 7A for diagram of vectors used). To increase ERK1/2 activity, we obtained a constitutively active MEK1 (MEK1CA, ΔN-S222D mutant, Mansour et al., 1994). In Neuro2a cells, MEK1CA led to increased MEK-ERK1/2 activity and FLNA expression (Figure 7B). In cultured wild type cortical neurons, MEK1CA expression led to a significant increase in MEK-ERK1/2 activity and FLNA transcription, which was measured using a luciferase reporter under a mouse Flna reporter (n=6 sets of culture, Figure 7C and D, increase in MEK-ERK!/2 activity not shown). We therefore assessed the effect of hyperactive MEK1/2 activity on dendritogenesis in vivo by electroporating the MEK1CA-encoding plasmid into neonatal progenitor cells as described in Figure 1. MEK1CA expression in vivo led to a significant increase in the dendritic complexity and total dendritic length of newborn neurons at both P14 (n=39 neurons per condition, N=4 mice, Figure 7E–G) and P28 (N=4, data not shown). Importantly, knocking down FLNA in wild type neurons expressing MEK1CA was sufficient to normalize dendritic morphology (Figure 7E–G). These data suggest that the MEK-ERK1/2 pathway can regulate dendritic patterning via FLNA.
Figure 7. Increased MEK-ERK1/2 activity in Tsc1null neurons promotes dendritic abnormalities through FLNA.
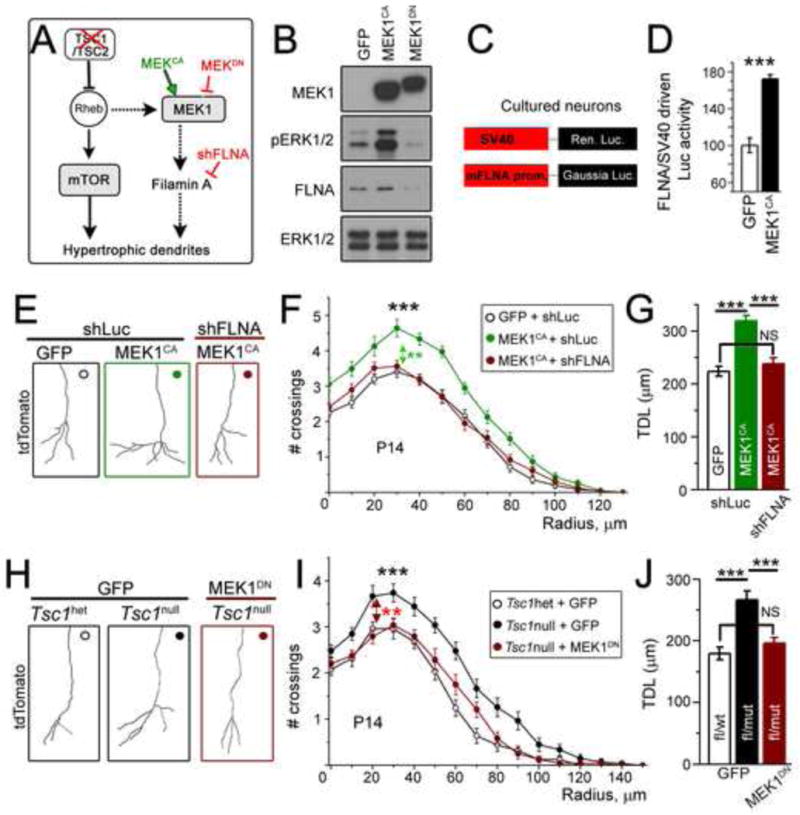
(A) A simplified model of TSC-mTOR-MEK-FLNA and the sites of actions of tested drugs and plasmids. (B) Immunoblots from Neuro2a cells transfected with GFP, MEK1CA, or MEK1DN. (C and D) Diagram of luciferase vectors (C) and normalized ratio of Gaussia luciferase driven by FLNA promoter activity over Renilla luciferase driven by SV40 promoter activity in cultured cortical neurons transfected with GFP or MEK1CA and appropriate luciferase vectors. (E) Reconstructions of the basal dendrites of P14 tdTomato+ OB neurons transfected with either GFP + shLuc, MEK1CA + shLuc (green), or MEK1CA + shFLNA (red). (F) Sholl analysis for neurons whose examples are shown in E. The statistical analysis (** in green) refers to MEK1CA neurons with shLuc or shFLNA. (G) Total dendritic length (TDL) from the Sholl data in F. (H) Reconstructions of the basal dendrites of Tsc1het transfected with GFP and Tsc1null neurons transfected with either GFP or MEK1DN (red). (I) Sholl analysis for neurons whose examples are shown in H. The statistical analysis (** in red) refers to Tsc1null + GFP compared to Tsc1null + MEK1DN. (J) Total dendritic length (TDL) from sholl data in (I). Student t-test or one way ANOVA and 2-way repeated measures ANOVA with post hoc Bonferroni’s tester used. ***: p<0.001 and **, p<0.01. See also Figure S5 and Tables S1 and S4.
These results suggested that hyperactive MEK-ERK1/2 drives pathologic FLNA expression and contributes to dendritic dysmorphogenesis in TSC. To address this possibility we examined whether hyperactive MEK-ERK1/2 activity underlies abnormal dendritic morphology in Tsc1null neurons using a dominant negative MEK1 vector (MEK1DN, K97M mutant (Mansour et al., 1994)). In Neuro2 cells, transfection of MEK1DN decreased pERK1/2 and FLNA levels (Figure 7B). In vivo, co-electroporation of MEK1DN and Cre prevented the increases in dendritic complexity and length of Tsc1null cells seen in control (GFP) electroporated Tsc1mull cells when analyzed at both P14 (n= 24–27 neurons per condition, N= 4, Figure 7H–J) and P28 (n=31 neurons per condition, N=4, Figure S5A–C). Collectively, these data provide strong evidence that MEK-ERK1/2 contributes to dendritic abnormalities in Tsc1null neurons by increasing FLNA expression.
Pharmacological inhibition of MEK-ERK1/2 or mTORC1 activity in Tsc1null neurons rescues dendritic defects
As we previously showed that mTOR inhibition partially rescues dendritic hypertrophy (Lafourcade et al., 2013), we wondered whether reducing MEK1-ERK1/2 activity also recues dendritic defects of Tsc1null cells. Because coincident electroporation of MEKDN and Cre does not allow use to distinguish rescue of the dendritic phenotype from prevention of the phenotype, we used a pharmacological approach to inhibit MEK1-ERK1/2 activity after the establishment of dendritic abnormalities. Specifically, we tested whether the MEK1/2 blocker PD0325901 can rescue FLNA levels and dendritic defects in Tsc1null neurons. PD0325901 used at 1 mg/kg in vivo significantly decreased ERK1/2 activity in the OB of Tsc1fl/mut mice treated from P14 to P28 (N=4 mice, Figure S6A and B).
To test the ability of PD0325901 to decrease FLNA levels in Tsc1null neurons, dissociated neurons from RTsc1fl/mut and RTsc1fl/wt mice were transfected with a Cre-encoding plasmid and cultured for 7 days in the presence of PD0325901 (2 μM, Figure 8A). PD0325901 significantly decreased FLNA levels albeit not to the levels seen in Tsc1het neurons (N=3 sets of cultures, Figure 8B and C). Importantly, in vivo treatment with PD0325901 (1 mg/kg) from P14 to P28 significantly decreased the dendritic complexity and total dendritic length of Tsc1null neurons (Figure 8A and D–E). A similar treatment with rapamycin (0.5 mg/kg, every other day), which decreased mTORC1 activity (Figure S6C), also significantly decreased dendritic complexity and normalized dendritic length of Tsc1null neurons compared to Tsc1het neurons (Figure 8D–F). These data suggest that increased mTORC1 and MEK-ERK1/2 signaling independently contributes to dendritic defects in Tsc1null neurons. Based on our data, blocking either pathway is sufficient to significantly prevent the dendritic defects.
Figure 8. Pharmacological inhibition of MEK-ERK1/2 or mTORC1 activity in Tsc1null neurons rescues dendritic defects.
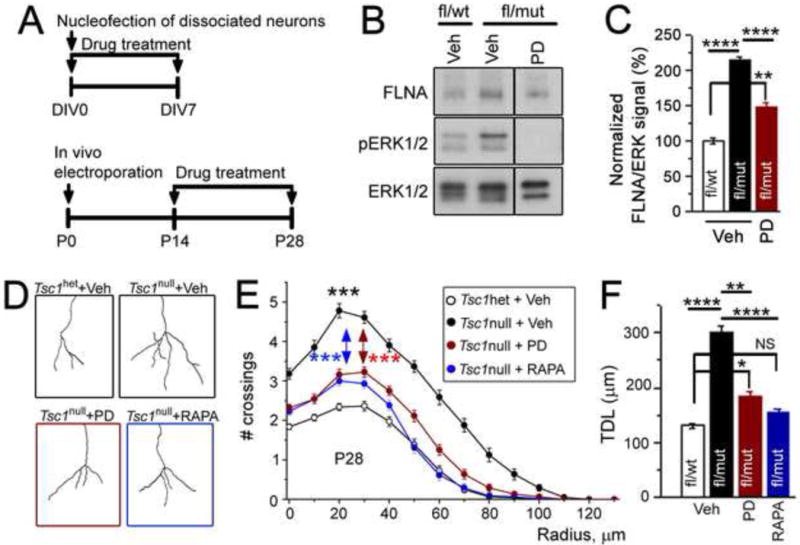
(A) Experimental design for in vitro panels B and C and in vivo panels D and E. (B) Western blots from Tsc1het neurons treated with vehicle and Tsc1null neurons treated with vehicle or PD0325901 (PD). (C) Bar graphs of FLNA signals from data in B. (D and E) Representative images of basal dendrites (D) and sholl analysis (E) for Tsc1het neurons in mice treated with vehicle (veh) and Tsc1null neurons in mice treated with vehicle (veh), PD or RAPA. The statistical analysis (*** in red and blue) refers to Tsc1null neurons treated with PD and RAPA, respectively. (F) Total dendritic length (TDL) from the sholl data in E. One way ANOVA and 2-way repeated measures ANOVA with post hoc Bonferroni’s test were used. **** p<0.0001, ***: p<0.001; **: p<0.01, *, p<0.05. See also Figure S6 and Table S1.
Discussion
Here we report, for the first time, that FLNA regulates dendritic morphogenesis. Moreover, FLNA overexpression underlies pathologic morphological and physiological defects in a mouse model of the human disorder TSC. We found that increased FLNA levels in our TSC models are MEK-ERK1/2-dependent and as such, reducing MEK-ERK1/2 signaling was sufficient to significantly rescue the dendritic defects. Additionally, early interventions that decrease FLNA levels in either Tsc1null or hyperactive MEK-ERK1/2 conditions are sufficient to prevent abnormal dendritic development.
Based on our findings, it is clear that conditions that push FLNA expression out of a narrow physiologic range promote abnormal dendritic patterning. To our surprise, both increasing and decreasing FLNA levels leads to increased dendritic complexity in newborn neurons. Although unexpected, this finding is not unreasonable considering that both high and low levels of FLNA expression impair cell migration implying a bell-shaped function for optimal FLNA expression (Cunningham et al., 1992; Sarkisian et al., 2008). Similar to cell migration, deviation from optimal FLNA expression in either direction results in hypertrophic dendrites. How both under- and overexpression of FLNA produce the same phenotype is not clear, however, it is notable that FLNA has multiple physiologic functions. Not only is FLNA involved in cytoskeletal reorganization by binding to and cross-linking actin, it also serves as a signaling and scaffolding protein that links the cytoskeleton to membrane and signaling molecules (Feng and Walsh, 2004; Razinia et al., 2012; Stossel et al., 2001). It is possible that these distinct FLNA functions independently contribute to dendritogenesis in differing ways. Understanding specifically how both under- or overexpression of FLNA lead to dendritic hypertrophy is the focus of ongoing study.
Nonetheless, overexpression of FLNA in Tsc1null neurons contributes to increased dendritic complexity as indicated by the fact that normalizing FLNA levels rescues dendritic complexity. Tsc1 null cells are enlarged (Feliciano et al., 2013a), suggesting that elevated FLNA could be secondary to a general upregulation of cytoskeletal proteins; however, we found that this is not the case as FLNB levels were unaltered in Tsc1null cells. Cellular enlargement in TSC is due to hyperactive mTORC1, which promotes both cellular and dendritic hypertrophy (Feliciano et al., 2013a). We therefore expected elevated FLNA to be secondary to mTORC1 hyperactivity.
Counter to our expectations, we found strong evidence that although Tsc1 deletion in vivo, and constitutively active Rheb expression in vitro, lead to hyperactive mTORC1 and dendritic hypertrophy, elevated FLNA expression is not downstream of mTORC1. Instead, pathologic FLNA expression in our model of TSC is due to hyperactive MEK-ERK1/2-signaling and blocking the MEK-ERK1/2 pathway is sufficient to rescue dendritic defects. Speculation about how Rheb and the upstream TSC complex signal to MEK-ERK1/2 to regulate FLNA expression is difficult given that Rheb signaling outside of mTORC1 is understudied (Jaeschke et al., 2002; Neuman and Henske, 2011). Conjecture about how MEK-ERK1/2 regulates FLNA expression, however, is more feasible given that the transcriptional activator serum response factor (SRF) is regulated by ERK (D’Addario et al., 2002; 2006; Tan and Khachigian, 2009). SRF is predicted to regulate FLNA expression and indeed, knocking down SRF in Neuro2a cells decreases FLNA expression (Zhang and Bordey, unpublished observations). As such, MEK-ERK1/2 hyperactivity in the setting of TSC may promote dendritic hypertrophy via SRF-dependent transcriptional up-regulation of the FLNA gene. This is consistent with studies showing that MEK-ERK1/2 activity regulates neurite growth in many cell types (e.g., PC12 cells, many references) and dendritic growth in neurons (Collo et al., 2008; Guo et al., 2012; Ha and Redmond, 2008; Kim et al., 2004; Xu et al., 2014). Whatever the mechanism, our data showing that MEK1 overexpression leads to FLNA-dependent dendritic hypertrophy in wild type cells reinforces the finding that reduction of either MEK1 activity (using a dominant negative vector) or FLNA expression (using shRNA) normalizes dendritic hypertrophy in TSC.
Normalizing dendrites in TSC is not purely cosmetic. Consistent with our previous report in which we overexpressed constitutively active Rheb (Lafourcade et al., 2013), we found that Tsc1null neurons display a significant increase in the frequency of miniature synaptic currents. Normalizing dendritic morphology by decreasing FLNA levels in Tsc1null neurons also restored a normal frequency of synaptic currents. This rescue could not be generalized to all physiologic defects as Tsc1null neurons also displayed a relatively depolarized resting membrane potential and a decreased input resistance that were not normalized by FLNA knockdown. These data indicate that electrophysiological defects in TSC are multifactorial.
Finally, it is important to note that we have previously shown that mTORC1 hyperactivity promotes dendritic hypertrophy and we replicate that finding here. Indeed, we and others have shown that rapamycin reduces hypertrophic dendrites in conditions of hyperactive Rheb or PI3K-AKT, both of which are associated with hyperactive mTORC1 (Feliciano et al., 2013a; Jaworski et al., 2005; Lafourcade et al., 2013). That reduction of mTORC1 or MEK1 activity in Tsc1null cells is sufficient to provide for a dendritic rescue without altering the activity of the other signaling pathway indicates that both mTORC1 and MEK1-ERK1/2 pathways contribute to dendritic hypertrophy in the context of TSC.
Thus, our study provides for the possibility that that inhibiting MEK-ERK1/2 activity or normalizing FLNA in TSC may be of therapeutic value. It also suggests that normalizing FLNA may be of benefit in other disorders where the MEK1-ERK1/2 pathway is hyperactive such as autism spectrum disorders (Cusco et al., 2009; Levitt and Campbell, 2009; Samuels et al., 2009). Although the study of TSC has historically been mTOR-centric, this works provides a motivation for exploration of additional and complementary approaches to treating TSC.
EXPERIMENTAL PROCEDURES
Animals and genotyping
Research protocols were approved by the Yale University Institutional Animal Care and Use Committee. Experiments were performed on wild-type CD1 and the following lines of transgenic mice of either gender: R26RtdTomato/Tsc1fl/mut mice (abbreviated RTsc1fl/mut) and RTsc1fl/wt mice; R26RtdTomato/Emx1Cre/Tsc1fl/mut mice (abbreviated RTsc1cKO) and RTsc1cHet. Breeding strategies and genotyping are detailed in Supplemental Material.
Human samples
Human tissue was obtained from the NICHD brain and tissue bank for developmental disorders in accordance with Yale human ethical committee. Tissue was from the prefrontal cortex of male individuals. Patient information is provided in Table S2. We ran TSC and control samples on the same membrane in a randomized order.
RNA isolation, Mouse Neurogenesis RT2 Profiler™ PCR Array, and qRT-PCR
RNA was extracted using standard Trizol protocol. cDNA was prepared using the RT2 Nano PreAMP cDNA Synthesis Kit (SA Biosciences). 12 μl of cDNAs combined with FastStart Universal SYBR Green Master (Roche) was loaded per well on a 384-well plate SA Biosciences Mouse Neurogenesis PCR Array. For qRT-PCR, 2.12 μg of RNA was mixed with dNTPs, random primers (Invitrogen). cDNA was subjected to PCR using primers to mouse Flna (F, GCACCGCAAGCACAACCA; R, CACAGCTGTCTACCAGGGC) and Gapdh (F, ACCACCATGGAGAAGGC; R, GGCATGGACTGTGGTCATGA).
Vectors
Vectors used are provided in Table S3 and additional details are provided in Supplemental Material.
Western blot analysis from mice and Neuro2a cells and antibodies
The Neuro2a mouse neuroblastoma cells were propagated using standard protocol and transfected with Polyjet (SignaGen Laboratories) at 80% confluence. Protein was harvested 48 h after transfection.
Western blotting protocol is detailed in supplemental material. Quantifications were performed using NIH Image J software. Primary antibodies are listed in Table S4. ERK or total protein (Amido Black) signals were used as loading controls and gave similar results. For the phosphorylated form of proteins, data were normalized to the total (unphosphorylated) levels from the same PVDF membrane. For western blot normalization across blots (Figure 6C) within a given experiment, a standard sample was run on each gel (see details in Supplemental Material).
Drug treatment
Drug treatment and preparation are detailed in Supplemental Material. Rapamycin and PD0325901 were purchased from A.G. Scientific Inc. (#R-1018) and Seleckbio (#PD0325901), respectively. Torin 1 and ERK blockers (U0126 and U0124) were from Tocris.
Neonatal electroporation
Electroporations were performed as previously described (Lacar et al., 2010; 2012; Platel et al., 2010) and detailed in Supplemental Material.
Culture of in vivo transfected neurons and FLNA immunostaining
7 days following electroporation, OB were dissected into ice-cold dissection medium (HBSS with 10 mM HEPES). Following standard dissociation protocol, cells were resuspended cells in MEM supplemented with 0.6% glucose and 5% FBS and plated on poly-D-lysine-coated coverslips. The medium was changed to neuronal maintenance media (neurobasal A medium with 1× B27 and 1× GlutaMAX-1) three hours after plating and every other day thereafter. 24 hours after plating, FLNA immunostaining was performed using a standard protocol.
Culture of P0 cortical neurons followed by nucleofection
The cortex of P0 pups was dissected out to prepare primary neuronal culture as described above. Once in cell suspension, neurons were nucleofected using a Mouse Neuron Nucleofector kit VPG-1001 (Lonza) following the manufacture instructions. Western blot analysis was performed 7 days following nucleofection.
Morphometric analysis
Images of tdTomato+ basal dendrites were acquired in coronal sections using a Fluoview 1000 confocal microscope and 20× objective. Basal dendrites were traced with simple neurite tracer software (FIJI, GNU GPL v3). Sholl analyses were carried out using the number of intersections in 10 μm-increment concentric circles as a measure of morphological complexity. Z-stacks from 3 different square fields of view were taken from 3 different OB sections. Analysis was performed blindly from >4 animals and >20 cells per condition. Experiments were performed at 2 time-points to validate that the dendrites did not recover by P28 due to dendritic pruning. We showed the P28 data in supplemental figures because by P28 the “rescue” effect is underestimated due to dilution of the electroporated vectors.
OB acute slice preparation
Coronal OB slices (350 μm) were prepared from anesthetized (Isoflurane 5%) P21–P24 mice using Vibratome 1000. Ice cold artificial cerebral spinal fluid (ACSF) containing (in mM): 124 NaCl, 3 KCl, 1.25 NaH2PO4, 1 MgSO4, 26 NaHCO3, 10 Dextrose, 2 CaCl2, 0.4 ascorbate, 4 Na-Lactate, 2 Na-Pyruvate (~290 mOsm/kg, pH 7.2), equilibrated with 95% O2/5% CO2 was used during both brain dissection and slicing. Brain slices were kept and used for recordings at 28°C in the ACSF mentioned above.
Whole-cell recording of OB granule cells
Fluorescent cells were identified using a 40× water-immersion Olympus LUMPlanFL/IR objective. Whole-cell recordings were performed with Axopatch 200B amplifier using glass pipettes (4–7 MΩ) filled with internal solution (in mM): 130 KCl, 10 HEPES, 10 di-tris-phosphocreatine, 1 EGTA, 0.1 CaCl2, 1.5 MgCl2, 4 Na2-ATP, and 0.3 Na-GTP. Liquid junction potential (~4 mV) was not corrected. Miniature synaptic currents were recorded at −70 mV in the presence of 1 μM tetrodotoxin. Data were analyzed with Clampfit 10 (Molecular Devices).
Luciferase assay
The standard procedure is detailed in Supplemental Material and was duplicated for each sample.
Statistics
N indicates the number of animals in each condition and n indicates the number of readings (e.g., cells). Data were plotted in Origin 8. Statistical significance was determined using unpaired two-tailed Student’s t-test or one way ANOVA with Tukey post-hoc except for sholl analysis with p<0.05 for significance for all experiments. For sholl analysis, we used two way repeated measures (RM) ANOVA with post hoc Bonferroni’s test for comparison of dendritic crossing. Data are presented as mean ± standard error of the mean (SEM).
Supplementary Material
Highlights.
FLNA levels are increased in TSC in an mTORC1-independent, MEK1-dependent manner.
Both over- and under-expression of FLNA increase dendritic complexity in neurons.
Reducing FLNA levels in Tsc1null neurons normalizes their dendritic complexity.
Decreasing MEK1 or mTOR activity rescues the dendritic defects of Tsc1null neurons.
Acknowledgments
This work was supported by grants from the Department of Defense (Idea Development Award) and McKnight Endowment Fund for Neuroscience award (AB), training grant from the China Scholarship Council (LZ), and NINDS MSTP T32 (C.M.B). We thank Drs. Hanada and Maehama (National Institute of Infectious Diseases, Tokyo), Cardoso (INMED, France), Nakamura (Harvard), Zenisek (Yale), Bennett (Dept. Pharmacology, Yale), Breunig (Regenerative Institute, Cedars-Sinai, LA), Baldassarre and Calderwood (Yale), and Sestan (Yale) for providing sequences or vectors. We also thank the lab members and Dr. Sarkisian (Univ. Florida) for helpful comments.
Footnotes
Publisher's Disclaimer: This is a PDF file of an unedited manuscript that has been accepted for publication. As a service to our customers we are providing this early version of the manuscript. The manuscript will undergo copyediting, typesetting, and review of the resulting proof before it is published in its final citable form. Please note that during the production process errors may be discovered which could affect the content, and all legal disclaimers that apply to the journal pertain.
References
- Au KS, Williams AT, Gambello MJ, Northrup H. Molecular genetic basis of tuberous sclerosis complex: from bench to bedside. J Child Neurol. 2004;19:699–709. doi: 10.1177/08830738040190091101. [DOI] [PubMed] [Google Scholar]
- Baldassarre M, Razinia Z, Burande CF, Lamsoul I, Lutz PG, Calderwood DA. Filamins regulate cell spreading and initiation of cell migration. PLoS ONE. 2009;4:e7830. doi: 10.1371/journal.pone.0007830. [DOI] [PMC free article] [PubMed] [Google Scholar]
- Boutin C, Diestel S, Desoeuvre A, Tiveron MC, Cremer H. Efficient in vivo electroporation of the postnatal rodent forebrain. PLoS ONE. 2008;3:e1883. doi: 10.1371/journal.pone.0001883. [DOI] [PMC free article] [PubMed] [Google Scholar]
- Carabalona A, Beguin S, Pallesi-Pocachard E, Buhler E, Pellegrino C, Arnaud K, Hubert P, Oualha M, Siffroi JP, Khantane S, et al. A glial origin for periventricular nodular heterotopia caused by impaired expression of Filamin-A. Hum Mol Genet. 2012;21:1004–1017. doi: 10.1093/hmg/ddr531. [DOI] [PubMed] [Google Scholar]
- Carson RP, Van Nielen DL, Winzenburger PA, Ess KC. Neuronal and glia abnormalities in Tsc1-deficient forebrain and partial rescue by rapamycin. Neurobiol Dis. 2012;45:369–380. doi: 10.1016/j.nbd.2011.08.024. [DOI] [PMC free article] [PubMed] [Google Scholar]
- Chevere-Torres I, Kaphzan H, Bhattacharya A, Kang A, Maki JM, Gambello MJ, Arbiser JL, Santini E, Klann E. Metabotropic glutamate receptor-dependent long-term depression is impaired due to elevated ERK signaling in the DeltaRG mouse model of tuberous sclerosis complex. Neurobiol Dis. 2012;45:1101–1110. doi: 10.1016/j.nbd.2011.12.028. [DOI] [PMC free article] [PubMed] [Google Scholar]
- Choo AY, Yoon SO, Kim SG, Roux PP, Blenis J. Rapamycin differentially inhibits S6Ks and 4E-BP1 to mediate cell-type-specific repression of mRNA translation. Proc Natl Acad Sci U S A. 2008;105:17414–17419. doi: 10.1073/pnas.0809136105. [DOI] [PMC free article] [PubMed] [Google Scholar]
- Collo G, Zanetti S, Missale C, Spano P. Dopamine D3 receptor-preferring agonists increase dendrite arborization of mesencephalic dopaminergic neurons via extracellular signal-regulated kinase phosphorylation. Eur J Neurosci. 2008;28:1231–1240. doi: 10.1111/j.1460-9568.2008.06423.x. [DOI] [PubMed] [Google Scholar]
- Crino PB, Nathanson KL, Henske EP. The tuberous sclerosis complex. N Engl J Med. 2006;355:1345–1356. doi: 10.1056/NEJMra055323. [DOI] [PubMed] [Google Scholar]
- Cunningham CC, Gorlin JB, Kwiatkowski DJ, Hartwig JH, Janmey PA, Byers HR, Stossel TP. Actin-binding protein requirement for cortical stability and efficient locomotion. Science. 1992;255:325–327. doi: 10.1126/science.1549777. [DOI] [PubMed] [Google Scholar]
- Cusco I, Medrano A, Gener B, Vilardell M, Gallastegui F, Villa O, Gonzalez E, Rodriguez-Santiago B, Vilella E, et al. Autism-specific copy number variants further implicate the phosphatidylinositol signaling pathway and the glutamatergic synapse in the etiology of the disorder. Hum Mol Genet. 2009;18:1795–1804. doi: 10.1093/hmg/ddp092. [DOI] [PMC free article] [PubMed] [Google Scholar]
- D’Addario M, Arora PD, Ellen RP, McCulloch CA. Interaction of p38 and Sp1 in a mechanical force-induced, beta 1 integrin-mediated transcriptional circuit that regulates the actin-binding protein filamin-A. J Biol Chem. 2002;277:47541–47550. doi: 10.1074/jbc.M207681200. [DOI] [PubMed] [Google Scholar]
- D’Addario M, Arora PD, McCulloch CA. Role of p38 in stress activation of Sp1. Gene. 2006;379:51–61. doi: 10.1016/j.gene.2006.04.012. [DOI] [PubMed] [Google Scholar]
- Dierssen M, Ramakers GJ. Dendritic pathology in mental retardation: from molecular genetics to neurobiology. Genes Brain Behav. 2006;5(Suppl 2):48–60. doi: 10.1111/j.1601-183X.2006.00224.x. [DOI] [PubMed] [Google Scholar]
- Eksioglu YZ, Scheffer IE, Cardenas P, Knoll J, DiMario F, Ramsby G, Berg M, Kamuro K, Berkovic SF, Duyk GM, et al. Periventricular heterotopia: an X-linked dominant epilepsy locus causing aberrant cerebral cortical development. Neuron. 1996;16:77–87. doi: 10.1016/s0896-6273(00)80025-2. [DOI] [PubMed] [Google Scholar]
- Feliciano DM, Hartman NW, Lin TV, Bartley C, Kubera C, Hsieh L, Lafourcade C, O’Keefe RA, Bordey A. A circuitry and biochemical basis for tuberous sclerosis symptoms: from epilepsy to neurocognitive deficits. Int J Dev Neurosci. 2013a:667–678. doi: 10.1016/j.ijdevneu.2013.02.008. [DOI] [PMC free article] [PubMed] [Google Scholar]
- Feliciano DM, Lafourcade CA, Bordey A. Neonatal subventricular zone electroporation. J Vis Exp. 2013b doi: 10.3791/50197. [DOI] [PMC free article] [PubMed] [Google Scholar]
- Feliciano DM, Quon JL, Su T, Taylor MM, Bordey A. Postnatal neurogenesis generates heterotopias, olfactory micronodules and cortical infiltration following single-cell Tsc1 deletion. Hum Mol Genet. 2012;21:799–810. doi: 10.1093/hmg/ddr511. [DOI] [PMC free article] [PubMed] [Google Scholar]
- Feliciano DM, Su T, Lopez J, Platel JC, Bordey A. Single-cell Tsc1 knockout during corticogenesis generates tuber-like lesions and reduces seizure threshold in mice. J Clin Invest. 2011;121:1596–1607. doi: 10.1172/JCI44909. [DOI] [PMC free article] [PubMed] [Google Scholar]
- Feng Y, Walsh CA. The many faces of filamin: a versatile molecular scaffold for cell motility and signalling. Nat Cell Biol. 2004;6:1034–1038. doi: 10.1038/ncb1104-1034. [DOI] [PubMed] [Google Scholar]
- Fox JW, Lamperti ED, Eksioglu YZ, Hong SE, Feng Y, Graham DA, Scheffer IE, Dobyns WB, Hirsch BA, Radtke RA, et al. Mutations in filamin 1 prevent migration of cerebral cortical neurons in human periventricular heterotopia. Neuron. 1998;21:1315–1325. doi: 10.1016/s0896-6273(00)80651-0. [DOI] [PubMed] [Google Scholar]
- Gorski JA, Talley T, Qiu M, Puelles L, Rubenstein JL, Jones KR. Cortical excitatory neurons and glia, but not GABAergic neurons, are produced in the Emx1-expressing lineage. J Neurosci. 2002;22:6309–6314. doi: 10.1523/JNEUROSCI.22-15-06309.2002. [DOI] [PMC free article] [PubMed] [Google Scholar]
- Guo SL, Tan GH, Li S, Cheng XW, Zhou Y, Jia YF, Xiong H, Tao J, Xiong ZQ. Serum inducible kinase is a positive regulator of cortical dendrite development and is required for BDNF-promoted dendritic arborization. Cell Res. 2012;22:387–398. doi: 10.1038/cr.2011.100. [DOI] [PMC free article] [PubMed] [Google Scholar]
- Ha S, Redmond L. ERK mediates activity dependent neuronal complexity via sustained activity and CREB-mediated signaling. Dev Neurobiol. 2008;68:1565–1579. doi: 10.1002/dneu.20682. [DOI] [PubMed] [Google Scholar]
- Hausser M, Spruston N, Stuart GJ. Diversity and dynamics of dendritic signaling. Science. 2000;290:739–744. doi: 10.1126/science.290.5492.739. [DOI] [PubMed] [Google Scholar]
- Jaeschke A, Hartkamp J, Saitoh M, Roworth W, Nobukuni T, Hodges A, Sampson J, Thomas G, Lamb R. Tuberous sclerosis complex tumor suppressor-mediated S6 kinase inhibition by phosphatidylinositide-3-OH kinase is mTOR independent. J Cell Biol. 2002;159:217–224. doi: 10.1083/jcb.jcb.200206108. [DOI] [PMC free article] [PubMed] [Google Scholar]
- Jan YN, Jan LY. Branching out: mechanisms of dendritic arborization. Nat Rev Neurosci. 2010;11:316–328. doi: 10.1038/nrn2836. [DOI] [PMC free article] [PubMed] [Google Scholar]
- Jaworski J, Spangler S, Seeburg DP, Hoogenraad CC, Sheng M. Control of dendritic arborization by the phosphoinositide-3′-kinase-Akt-mammalian target of rapamycin pathway. J Neurosci. 2005;25:11300–11312. doi: 10.1523/JNEUROSCI.2270-05.2005. [DOI] [PMC free article] [PubMed] [Google Scholar]
- Kim IJ, Drahushuk KM, Kim WY, Gonsiorek EA, Lein P, Andres DA, Higgins D. Extracellular signal-regulated kinases regulate dendritic growth in rat sympathetic neurons. J Neurosci. 2004;24:3304–3312. doi: 10.1523/JNEUROSCI.3286-03.2004. [DOI] [PMC free article] [PubMed] [Google Scholar]
- Kwiatkowski DJ, Manning BD. Tuberous sclerosis: a GAP at the crossroads of multiple signaling pathways. Hum Mol Genet. 2005;14(Spec No 2):R251–R258. doi: 10.1093/hmg/ddi260. [DOI] [PubMed] [Google Scholar]
- Kwiatkowski DJ, Short MP. Tuberous sclerosis. Arch Dermatol. 1994;130:348–354. [PubMed] [Google Scholar]
- Kwon CH, Luikart BW, Powell CM, Zhou J, Matheny SA, Zhang W, Li Y, Baker SJ, Parada LF. Pten regulates neuronal arborization and social interaction in mice. Neuron. 2006;50:377–388. doi: 10.1016/j.neuron.2006.03.023. [DOI] [PMC free article] [PubMed] [Google Scholar]
- Lacar B, Herman P, Platel JC, Kubera C, Hyder F, Bordey A. Neural Progenitor Cells Regulate Capillary Blood Flow in the Postnatal Subventricular Zone. J Neurosci. 2012;32:16435–16448. doi: 10.1523/JNEUROSCI.1457-12.2012. [DOI] [PMC free article] [PubMed] [Google Scholar]
- Lacar B, Young SZ, Platel JC, Bordey A. Imaging and recording subventricular zone progenitor cells in live tissue of postnatal mice. Front Neurosci. 2010;4 doi: 10.3389/fnins.2010.00043. [DOI] [PMC free article] [PubMed] [Google Scholar]
- Lafourcade CA, Lin TV, Feliciano DM, Zhang L, Hsieh LS, Bordey A. Rheb activation in subventricular zone progenitors leads to heterotopia, ectopic neuronal differentiation, and rapamycin-sensitive olfactory micronodules and dendrite hypertrophy of newborn neurons. J Neurosci. 2013;33:2419–2431. doi: 10.1523/JNEUROSCI.1840-12.2013. [DOI] [PMC free article] [PubMed] [Google Scholar]
- Letourneau PC, Shattuck TA. Distribution and possible interactions of actin-associated proteins and cell adhesion molecules of nerve growth cones. Development. 1989;105:505–519. doi: 10.1242/dev.105.3.505. [DOI] [PubMed] [Google Scholar]
- Levitt P, Campbell DB. The genetic and neurobiologic compass points toward common signaling dysfunctions in autism spectrum disorders. J Clin Invest. 2009;119:747–754. doi: 10.1172/JCI37934. [DOI] [PMC free article] [PubMed] [Google Scholar]
- Lian G, Lu J, Hu J, Zhang J, Cross SH, Ferland RJ, Sheen VL. Filamin a regulates neural progenitor proliferation and cortical size through Wee1-dependent Cdk1 phosphorylation. J Neurosci. 2012;32:7672–7684. doi: 10.1523/JNEUROSCI.0894-12.2012. [DOI] [PMC free article] [PubMed] [Google Scholar]
- Maehama T, Tanaka M, Nishina H, Murakami M, Kanaho Y, Hanada K. RalA functions as an indispensable signal mediator for the nutrient-sensing system. J Biol Chem. 2008;283:35053–35059. doi: 10.1074/jbc.M805822200. [DOI] [PMC free article] [PubMed] [Google Scholar]
- Magri L, Cambiaghi M, Cominelli M, Alfaro-Cervello C, Cursi M, Pala M, Bulfone A, Garcia-Verdugo JM, Leocani L, et al. Sustained activation of mTOR pathway in embryonic neural stem cells leads to development of tuberous sclerosis complex-associated lesions. Cell Stem Cell. 2011;9:447–462. doi: 10.1016/j.stem.2011.09.008. [DOI] [PubMed] [Google Scholar]
- Maldonado M, Baybis M, Newman D, Kolson DL, Chen W, McKhann G, Gutmann DH, Crino PB. Expression of ICAM-1, TNF-alpha, NF kappa B, and MAP kinase in tubers of the tuberous sclerosis complex. Neurobiol Dis. 2003;14:279–290. doi: 10.1016/s0969-9961(03)00127-x. [DOI] [PubMed] [Google Scholar]
- Mansour SJ, Matten WT, Hermann AS, Candia JM, Rong S, Fukasawa K, Vande Woude GF, Ahn NG. Transformation of mammalian cells by constitutively active MAP kinase kinase. Science. 1994;265:966–970. doi: 10.1126/science.8052857. [DOI] [PubMed] [Google Scholar]
- Meikle L, Talos DM, Onda H, Pollizzi K, Rotenberg A, Sahin M, Jensen FE, Kwiatkowski DJ. A mouse model of tuberous sclerosis: neuronal loss of Tsc1 causes dysplastic and ectopic neurons, reduced myelination, seizure activity, and limited survival. J Neurosci. 2007;27:5546–5558. doi: 10.1523/JNEUROSCI.5540-06.2007. [DOI] [PMC free article] [PubMed] [Google Scholar]
- Nagano T, Morikubo S, Sato M. Filamin A and FILIP (Filamin A-Interacting Protein) regulate cell polarity and motility in neocortical subventricular and intermediate zones during radial migration. J Neurosci. 2004;24:9648–9657. doi: 10.1523/JNEUROSCI.2363-04.2004. [DOI] [PMC free article] [PubMed] [Google Scholar]
- Nakamura F, Pudas R, Heikkinen O, Permi P, Kilpelainen I, Munday AD, Hartwig JH, Stossel TP, Ylanne J. The structure of the GPIb-filamin A complex. Blood. 2006;107:1925–1932. doi: 10.1182/blood-2005-10-3964. [DOI] [PMC free article] [PubMed] [Google Scholar]
- Nakamura F, Stossel TP, Hartwig JH. The filamins: organizers of cell structure and function. Cell Adh Migr. 2011;5:160–169. doi: 10.4161/cam.5.2.14401. [DOI] [PMC free article] [PubMed] [Google Scholar]
- Nestor MW, Hoffman DA. Aberrant dendritic excitability: a common pathophysiology in CNS disorders affecting memory? Mol Neurobiol. 2012;45:478–487. doi: 10.1007/s12035-012-8265-x. [DOI] [PMC free article] [PubMed] [Google Scholar]
- Neuman NA, Henske EP. Non-canonical functions of the tuberous sclerosis complex-Rheb signalling axis. EMBO Mol Med. 2011;3:189–200. doi: 10.1002/emmm.201100131. [DOI] [PMC free article] [PubMed] [Google Scholar]
- Ohta Y, Suzuki N, Nakamura S, Hartwig JH, Stossel TP. The small GTPase RalA targets filamin to induce filopodia. Proc Natl Acad Sci U S A. 1999;96:2122–2128. doi: 10.1073/pnas.96.5.2122. [DOI] [PMC free article] [PubMed] [Google Scholar]
- Pathania M, Torres-Reveron J, Yan L, Kimura T, Lin TV, Gordon V, Teng ZQ, Zhao X, Fulga TA, Van VD, Bordey A. miR-132 enhances dendritic morphogenesis, spine density, synaptic integration, and survival of newborn olfactory bulb neurons. PLoS ONE. 2012;7:e38174. doi: 10.1371/journal.pone.0038174. [DOI] [PMC free article] [PubMed] [Google Scholar]
- Platel JC, Dave KA, Gordon V, Lacar B, Rubio ME, Bordey A. NMDA receptors activated by subventricular zone astrocytic glutamate are critical for neuroblast survival prior to entering a synaptic network. Neuron. 2010;65:859–872. doi: 10.1016/j.neuron.2010.03.009. [DOI] [PMC free article] [PubMed] [Google Scholar]
- Platel JC, Gordon V, Heintz T, Bordey A. GFAP-GFP neural progenitors are antigenically homogeneous and anchored in their enclosed mosaic niche. Glia. 2009;57:66–78. doi: 10.1002/glia.20735. [DOI] [PubMed] [Google Scholar]
- Razinia Z, Makela T, Ylanne J, Calderwood DA. Filamins in mechanosensing and signaling. Annu Rev Biophys. 2012;41:227–246. doi: 10.1146/annurev-biophys-050511-102252. [DOI] [PMC free article] [PubMed] [Google Scholar]
- Samuels IS, Saitta SC, Landreth GE. MAP’ing CNS development and cognition: an ERKsome process. Neuron. 2009;61:160–167. doi: 10.1016/j.neuron.2009.01.001. [DOI] [PMC free article] [PubMed] [Google Scholar]
- Sarkisian MR, Bartley CM, Chi H, Nakamura F, Hashimoto-Torii K, Torii M, Flavell RA, Rakic P. MEKK4 signaling regulates filamin expression and neuronal migration. Neuron. 2006;52:789–801. doi: 10.1016/j.neuron.2006.10.024. [DOI] [PMC free article] [PubMed] [Google Scholar]
- Sarkisian MR, Bartley CM, Rakic P. Trouble making the first move: interpreting arrested neuronal migration in the cerebral cortex. Trends Neurosci. 2008;31:54–61. doi: 10.1016/j.tins.2007.11.009. [DOI] [PubMed] [Google Scholar]
- Sjostrom PJ, Rancz EA, Roth A, Hausser M. Dendritic excitability and synaptic plasticity. Physiol Rev. 2008;88:769–840. doi: 10.1152/physrev.00016.2007. [DOI] [PubMed] [Google Scholar]
- Stossel TP, Condeelis J, Cooley L, Hartwig JH, Noegel A, Schleicher M, Shapiro SS. Filamins as integrators of cell mechanics and signalling. Nat Rev Mol Cell Biol. 2001;2:138–145. doi: 10.1038/35052082. [DOI] [PubMed] [Google Scholar]
- Takafuta T, Wu G, Murphy GF, Shapiro SS. Human beta-filamin is a new protein that interacts with the cytoplasmic tail of glycoprotein Ibalpha. J Biol Chem. 1998;273:17531–17538. doi: 10.1074/jbc.273.28.17531. [DOI] [PubMed] [Google Scholar]
- Tan NY, Khachigian LM. Sp1 phosphorylation and its regulation of gene transcription. Mol Cell Biol. 2009;29:2483–2488. doi: 10.1128/MCB.01828-08. [DOI] [PMC free article] [PubMed] [Google Scholar]
- Thoreen CC, Kang SA, Chang JW, Liu Q, Zhang J, Gao Y, Reichling LJ, Sim T, Sabatini DM, Gray NS. An ATP-competitive mammalian target of rapamycin inhibitor reveals rapamycin-resistant functions of mTORC1. J Biol Chem. 2009;284:8023–8032. doi: 10.1074/jbc.M900301200. [DOI] [PMC free article] [PubMed] [Google Scholar]
- Xu X, Lu Y, Zhang G, Chen L, Tian D, Shen X, Yang Y, Dong F. Bisphenol A promotes dendritic morphogenesis of hippocampal neurons through estrogen receptor-mediated ERK1/2 signal pathway. Chemosphere. 2014;96:129–137. doi: 10.1016/j.chemosphere.2013.09.063. [DOI] [PubMed] [Google Scholar]
- Xu Y, Bismar TA, Su J, Xu B, Kristiansen G, Varga Z, Teng L, Ingber DE, Mammoto A, Kumar R, et al. Filamin A regulates focal adhesion disassembly and suppresses breast cancer cell migration and invasion. J Exp Med. 2010;207:2421–2437. doi: 10.1084/jem.20100433. [DOI] [PMC free article] [PubMed] [Google Scholar]
- Zheng L, Michelson Y, Freger V, Avraham Z, Venken KJ, Bellen HJ, Justice MJ, Wides R. Drosophila Ten-m and filamin affect motor neuron growth cone guidance. PLoS ONE. 2011;6:e22956. doi: 10.1371/journal.pone.0022956. [DOI] [PMC free article] [PubMed] [Google Scholar]
Associated Data
This section collects any data citations, data availability statements, or supplementary materials included in this article.