Abstract
Aims:
The aim was to compare the intraocular pressure (IOP), central corneal thickness (CCT), and optic disc topography findings of biochemically controlled acromegalic patients and the control group and to evaluate the effect of the duration of acromegaly and serum growth hormone and insulin-like growth factor-1 (IGF-1) levels on these ocular parameters.
Materials and Methods:
IOP measurement with Goldmann applanation tonometry, CCT measurement with ultrasonic pachymetry, and topographic analysis with Heidelberg retinal tomograph III were performed on 35 biochemically controlled acromegalic patients and 36 age- and gender-matched controls.
Results:
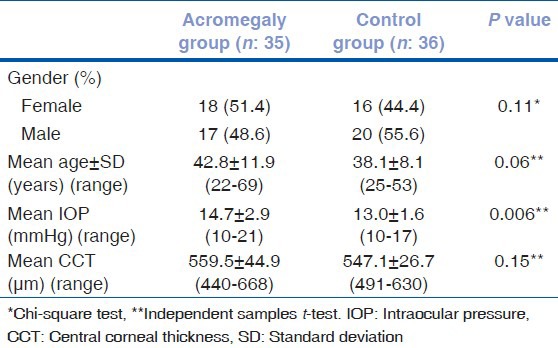
Mean IOP and CCT were 14.7 ± 2.9 mmHg and 559.5 ± 44.9 μm in the acromegaly patients and 13.0 ± 1.6 mmHg and 547.1 ± 26.7 μm in controls (P = 0.006 and P = 0.15, respectively). A significant moderate correlation was found between the duration of acromegaly and CCT (r = 0.391) and IOP (r = 0.367). Mean retinal nerve fiber layer (RNFL) thickness was significantly lower in the acromegalic patients (0.25 ± 0.05 mm) as compared to controls (0.31 ± 0.09 mm) (P = 0.01). A significant moderate correlation was detected between IGF-1 level and disc area (r = 0.362), cup area (r = 0.389) and cup volume (r = 0.491).
Conclusion:
Biochemically controlled acromegalic patients showed significantly higher CCT and IOP levels and lower RNFL thickness compared to healthy controls and the duration of disease was correlated with CCT and IOP levels.
Keywords: Acromegaly, central corneal thickness, intraocular pressure, optic disc topography, retinal nerve fiber layer thickness
Introduction
Acromegaly is a rare chronic disease due to a pituitary gland adenoma releasing excessive growth hormone (GH). While the prevalence is 40-70 cases/million, the incidence is 3-4 new cases/million.[1] Clinical findings of acromegaly result from increased levels of GH and insulin-like growth factor-1 (IGF-1).[2] GH effects on ocular development and growth may be via endocrine, autocrine, or paracrine pathways.[3] Bitemporal hemianopsia and loss of vision may occur, as a result of the compression of the optic chiasm by pituitary adenoma in acromegaly patients. Diabetic retinopathy, increased intraocular pressure (IOP), and central corneal thickness (CCT) have also been reported in these patients regardless of the mass effect.[4,5,6]
Increased IOP in acromegaly patients was first reported in 1955.[5] It has been suggested that the increased serum GH level observed in open-angle glaucoma (OAG) patients compared to the control group could increase IOP by influencing aqueous outflow via the trabecular meshwork.[7]
The aim of our study was to compare biochemically controlled acromegalic patients and healthy subjects in terms of IOP, CCT, and optic disc topographic parameters.
Materials and Methods
Patients and study design
The study protocol, which adhered to the tenets of the Declaration of Helsinki, was approved by the Institutional Review Board of Ankara University, School of Medicine. We prospectively evaluated both eyes of 35 cases with acromegaly that were referred from Ankara Numune Education and Research Hospital's Endocrinology and Metabolism Clinic to our Glaucoma Clinic, and 36 age- and gender-matched control subjects who presented at the Ulucanlar Eye Education and Research Hospital for a routine eye examination from September 2011 to June 2012. Informed consent was obtained from all cases. Patients with acromegaly were considered to be biochemically controlled if the GH level on the oral-glucose-tolerance test (OGTT)-GH suppression test was < 1 ng/mL and the IGF-1 level was within the normal range for age and gender.
Complete ophthalmological examination, including best-corrected visual acuity with Snellen chart, slit-lamp and fundus examination, gonioscopy with Goldmann three-mirror lens, CCT with ultrasonic pachymetry (Tomey Corporation, Nagoya, Japan), IOP with Goldmann applanation tonometer, and standard threshold perimetry with the Humphrey visual field analyzer 24-2 program (Carl Zeiss Meditec, Inc., Dublin, CA, USA) were performed for all cases. The duration of the disease was from the time the acromegaly diagnosis was made to the time of referral to us for an ophthalmology examination. Subjects with best-corrected visual acuities of 20/30 or better without a history of any systemic disease, family history of glaucoma or ocular problems other than refractive error (spherical: <±3.0, cylindrical: <±1.0D) were included in the control group. Subjects who had a previous history of glaucoma, keratitis, uveitis, systemic or topical corticosteroid use, and any ocular surgery or trauma were excluded from the study. Eyes that provided unreliable optic disc images due to lack of patient cooperation or optic media opacities, best-corrected visual acuity worse than 20/30, and high spherical (>±3) or cylindrical (>±1.0D) refractive errors were also excluded from the study.
The Heidelberg Retinal Tomograph III (HRT III, Heidelberg Engineering, Heidelberg, Germany) scanning laser ophthalmoscope was used by an experienced examiner (ES) under the same intensity dim room light and with the same reference plane height for the optic nerve head (ONH) quantitative assessment of all eyes. HRT assessments of the disc area (DA), cup area (CA), rim area (RA), cup volume (CV), rim volume (RV), cup to DA Ratio (C/D), Linear C/D, mean cup depth (MCD), maximum cup depth, cup shape measure (CSM), height variation contour (HVC), mean retinal nerve fiber layer (RNFL) thickness, and RNFL cross-sectional area were evaluated.
Laboratory analyses
Serum GH levels were measured by immunoradiometric assay (IRMA), using commercially available kits (hGH-IRMA CT; RADIM, Rome, Italy). The sensitivity of the assay was 0.04 ng/mL. The calibrator had been calibrated against the WHO 80/505 International Standard preparation (1 ng hGH = 2 μIU). The reference ranges of GH were 0-16 ng/mL for women and 0-8 ng/mL for men. Serum IGF-1 was measured by a solid-phase, enzyme-labeled chemiluminescent immunometric assay (Immulite IGF-I, Siemens Medical Solutions Diagnostics, Llanberis, United Kingdom) using the IMMULITE 1000 System (SIEMENS, Gwynedd, United Kingdom). In our laboratory, the reference ranges of IGF-I in the 21-25, 26-30, 31-35, 36-50, 51-60, 61-70, and over 70 years age groups were 116-358, 117-329,115-307, 94-284, 81-238, 69-212, and 55-188 ng/mL, respectively. The analytical sensitivity of the assay was 20 ng/mL. Calibration was up to 1600 ng/mL (WHO NIBSC 1st IRR 87/518). The within-run coefficients of variation were 3.1, 4.3, and 3.5% for the low, medium, and high points of the standard curve, respectively. The total coefficients of variation were 6.1, 6.9, and 5.8% for the low, medium, and high points of the standard curve, respectively.
Statistical methods
The sample size was calculated as 35 for each group with the power of 80% and a P = 0.05 using a mean acromegaly prevalence of 50/1,000,000 annually. For the continuous variables, the data were tested for normality using the Kolmogorov-Smirnov test, histograms, and p-p plots for both groups.
All data except the level of GH at diagnosis in the patient group and the CV in the control group were distributed normally and compared by the Independent samples t-test. The GH level at the time of diagnosis and CV was compared between the groups using the Mann–Whitney U-test.
As the GH level in the patient group was not consistent with the normal distribution, the Spearman Correlation Test was used to determine the correlation between this variable and the DA, CA, RA, CV, RV, C/D, Linear C/D, MCD, maximum cup depth, CSM, HVC, Mean RNFL Thickness, and RNFL Cross Sectional Area. Moreover, correlation analysis between normally distributed variables was carried out using Pearson's correlation test.
Results
Baseline demographics and characteristics
Mean duration of acromegaly was 4.3 ± 2.4 (1-8) years. In acromegaly group, serum GH and IGF-1 levels were 16.5 ± 15.8 (3.1-72.6) ng/mL, and 915.4 ± 329.5 (316-1800) ng/mL, respectively. Macroadenoma was more common (28 patients, 80%) than those patients with microadenoma. The acromegaly and control groups did not show a significant difference in terms of age and gender (Independent samples t-test, P = 0.06, Chi-square test, P = 0.11, respectively). Demographic characteristics of the participants are given in Table 1.
Table 1.
Characteristics of the participants

Intraocular pressure was adjusted for CCT based on the Dresdner correction formula[8] (14.4 ± 2.8 mmHg for the patient group, 13.1 ± 1.8 mmHg for controls). Statistical analysis was then repeated, and a significant difference was still observed (independent samples t-test, P = 0.04).
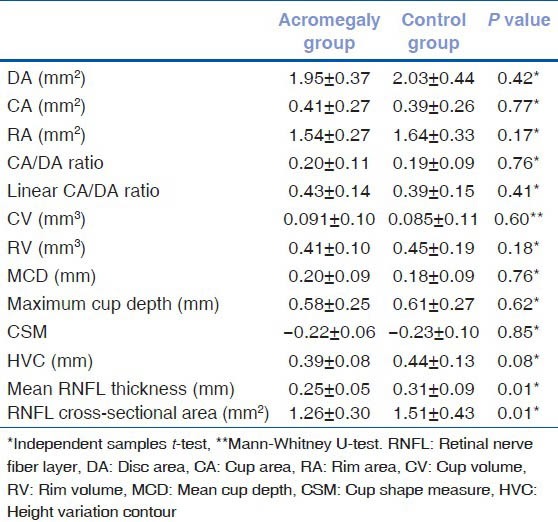
Mean RNFL thickness was found to be significantly lower in the patient group (0.25 ± 0.05 mm) compared with the control group (0.31 ± 0.09 mm) (Independent samples t-test, P = 0.01). RNFL cross-sectional area was also significantly lower in the patient group (1.26 ± 0.30 mm2) compared with the control group (1.51 ± 0.43 mm2) (independent samples t-test, P = 0.01). Optic disc topographic parameters of the patient and control groups are presented in Table 2. To investigate a possible effect of IOP on reducing the RNFL thickness or affecting other variables, Pearson's correlation coefficient was used for correlation analysis between normally distributed variables and IOP. However, there was no significant correlation between RNFL thickness and IOP in acromegalic patients (Pearson correlation test, P = 0.38).
Table 2.
Optic disc topographic parameters of acromegaly and control groups

Correlation of duration of acromegaly, serum growth hormone, and insulin-like growth factor-1 levels with ocular parameters of acromegalic patients
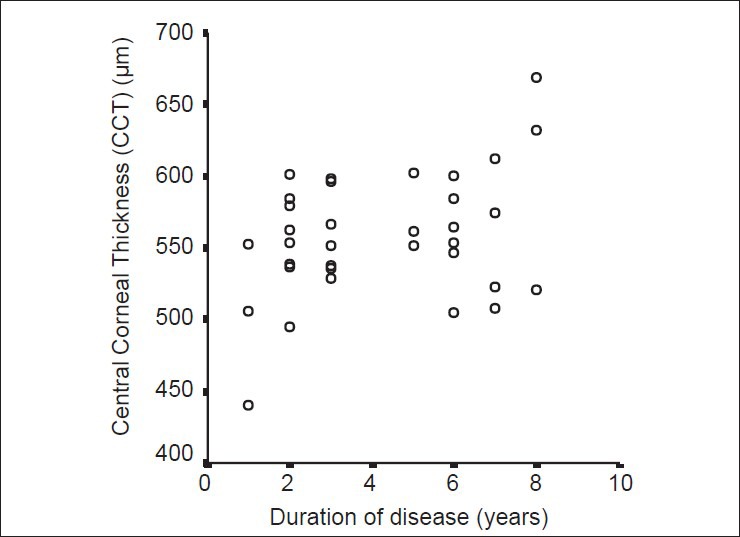
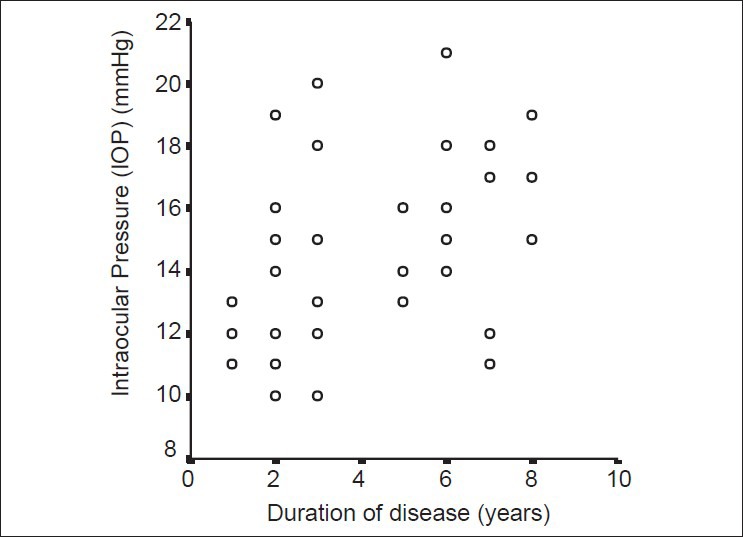
A significant moderate correlation was found between the duration of acromegaly and CCT (Pearson correlation test, P = 0.02, r = 0.391) as well as between the duration of acromegaly and IOP (Pearson correlation test, P = 0.03, r = 0.367) [Figs. 1 and 2]. For acromegalic patients, no correlation was found between the level of GH at the time of diagnosis and any other parameter (Spearman correlation test, P > 0.05). However, a significant moderate correlation was found between IGF-1 and DA (P = 0.03, r = 0.362), CA (P = 0.03, r = 0.389) and CV (P = 0.003, r = 0.491).
Figure 1.

Correlation between acromegaly duration and central corneal thickness. A significant moderate correlation was found between time (the duration of disease, year) and central corneal thickness (CCT, μm) (Pearson correlation test, P = 0.02, r = 0.39) in the acromegaly group
Figure 2.

Correlation between acromegaly duration and intraocular pressure. A significant moderate correlation was found between time (the duration of disease, year) and intraocular pressure (IOP, mmHg) (Pearson correlation test, P = 0.03, r = 0.36) in the acromegaly group.
Discussion
The clinical diagnosis of acromegaly is confirmed biochemically by an increased serum GH concentration following an OGTT and increased serum levels of IGF-I.[1] van Setten et al. reported that the IGF-1 level was elevated not only in the serum, but also in the subretinal fluid and aqueous humor in a patient with acromegaly.[2] The effect of IGF-1 on the synthesis of the extracellular matrix of the sclera, which may lead to disturbed aqueous humor outflow through the trabecular meshwork, has been reported in animal models.[9,10] GH messenger ribonucleic acid and GH immunoreactive proteins have also been observed in the neural retina of animal models.[11,12,13] It is, therefore, possible that the growth effect of GH and IGF-1 on bone and soft tissue in acromegaly patients may also be observed in the eye.[2,6,14] Bramsen et al. reported that increased CCT was observed as part of soft tissue thickening in acromegaly patients, and this could be as important as the GH level for the diagnosis and follow-up of these patients.[6] In addition, specific growth factors (such as IGF-1) acting through high-affinity receptors may also be involved in maintaining the normal microenvironment of the trabecular meshwork and in the pathogenesis of primary OAG.[15] It has been suggested that the increased serum GH level in patients with OAG compared to the control group might increase IOP by influencing aqueous outflow via the trabecular meshwork.[7] This information leads to the following question: “Do increased levels of GH and IGF-1 and higher IOP observed in patients with acromegaly pose a risk for glaucoma?” We, therefore, compared the IOP, CCT, and optic disc topographic values of acromegaly patients and healthy group.
Ciresi et al. emphasized that high GH may have stimulatory effects on the cornea as well as on other target organs.[14] Uncontrolled acromegalic patients had higher CCT values than controlled acromegalic patients in their study. Bramsen et al. divided 27 pituitary adenoma patients into two groups as those with and without acromegaly and reported higher CCT values in the group with acromegaly.[6] In contrast, Polat et al. reported no statistically significant difference regarding median right and left corneal thicknesses and mean CCT values between the acromegaly and control groups.[16] They divided 30 patients with acromegaly into two groups as those with active (n: 14) and inactive disease (n: 16). The CCT values were not significantly different between these subgroups.[16] We found higher CCT values in acromegaly patients than the control group although the difference was not statistically significant.
Bramsen et al. found higher IOP values in patients with pituitary adenoma and acromegaly than in patients without acromegaly.[6] Ciresi et al. reported that IOP measurements were higher in uncontrolled acromegalic patients compared to controlled acromegalic patients and the control group.[14] However, this difference disappeared when the IOP values measured by applanation tonometry were adjusted for CCT.[6,14] Polat et al. reported statistically significantly higher median right, left, and mean IOP values in the acromegaly group compared to healthy controls.[16] The two subgroups of acromegalic patients, that is, with active and inactive disease, had similar IOPs. Our study showed significantly higher IOP values in the biochemically controlled acromegalic patients compared to healthy subjects, and this was consistent with previous studies.
Ciresi et al. found higher CCT values in the uncontrolled group compared to the controlled one.[14] However, the duration of disease was 3.5 years in uncontrolled patients and 1 year in controlled patients in that study. Polat et al. did not observe a linear relationship between IOP and age, GH, the levels of IGF-1 and nadir GH during OGTT in either active or inactive acromegalic patients.[16] They did not find a correlation between IOP and total or active disease duration in acromegalic patients. The total disease duration was 5.5 and 5 years in the active and inactive groups, respectively.[16] Although all patients were controlled hormonally in our study, the duration of acromegaly was 4.3 years and found to be correlated with CCT and IOP. We should, therefore, keep in mind that the duration of disease is at least as important as the activity of the disease regarding CCT in these patients.
Ciresi et al. found no RNFL alteration in acromegalic patients by Stratus optical coherence tomography (OCT) (Stratus OCT-Model 3000 [Carl Zeiss Meditec, Dublin, CA, USA]).[14] Polat et al. reported no statistically significant difference regarding median right and left retinal thicknesses (RT) and mean central RT between the acromegaly and control groups using Spectral Domain-OCT (RTV system version 3.0, Optovue, Inc., CA, USA). The two subgroups (with active and inactive disease) of acromegalic patients had similar RT values.[16] Unlike these two studies,[14,16] in our study, HRT III was used to measure RNFL thickness. We found mean RNFL thickness and RNFL cross-sectional area, which are among the optic disc topographic parameters, to be significantly lower in the acromegaly group than the control group. This reduction in RNFL thickness may be attributed to the higher proportion of patients with macroadenoma that could lead to compression of the optic nerve in our acromegaly group. Therefore, ONH imaging should be considered for acromegaly patients when conducting an ophthalmologic examination. However, the correlation of RFNL thickness with IOP was not detected in our study.
We found a moderate correlation between IGF-1 and DA in our acromegalic patients. This indicates a possible growth effect of IGF-1, which mediates the effect of GH on tissues, on the eyes and optic nerve just as in all other tissues.
There are several limitations of the current study that should be noted. First, this study does not normalize variables including concurrent systemic diseases among the groups. Another potential limitation of the current study is not evaluating previous therapies such as radiotherapy or medical agents. Finally, measurements of GH or IGF-1 levels in subretinal fluid and aqueous humor to evaluate their correlation with IOP, CCT, and RNFL thickness values could not be performed as these are interventional procedures. Taking these measurements during routine, ophthalmic surgery may shed light on future studies. We also believe that the CCT, IOP, and RNFL thickness of these patients should be monitored for the early detection of visual acuity and visual field loss, even if the disease is under control.
Conclusion
The results of this study revealed that CCT and IOP levels were higher in acromegalic patients than healthy controls and the duration of acromegaly correlated with the presence of abnormal CCT and IOP findings even when the disease was controlled hormonally (GH < 1 mg/ml on the OGTT-GH suppression test). To the best of our knowledge, the present study is the first to evaluate RNFL thickness of cases with acromegaly using HRT III and mean RNFL thickness and RNFL cross-sectional area were statistically significantly lower in acromegalic patients than healthy controls. Furthermore, a moderate correlation was established between IGF-1 and DA in our acromegalic patients. The effects on the cornea, IOP, and RNFL thickness may continue over time, and longer-term longitudinal studies are, therefore, warranted in acromegalic patients.
Footnotes
Source of Support: Nil.
Conflict of Interest: None declared.
References
- 1.Chanson P, Salenave S. Acromegaly. Orphanet J Rare Dis. 2008;3:17. doi: 10.1186/1750-1172-3-17. [DOI] [PMC free article] [PubMed] [Google Scholar]
- 2.van Setten G, Brismar K, Algvere P. Elevated intraocular levels of insulin-like growth factor I in a diabetic patient with acromegaly. Orbit. 2002;21:161–7. doi: 10.1076/orbi.21.2.161.7186. [DOI] [PubMed] [Google Scholar]
- 3.Harvey S, Baudet ML, Sanders EJ. Growth hormone and developmental ocular function: Clinical and basic studies. Pediatr Endocrinol Rev. 2007;5:510–5. [PubMed] [Google Scholar]
- 4.Amemiya T, Toibana M, Hashimoto M, Oseko F, Imura H. Diabetic retinopathy in acromegaly. Ophthalmologica. 1978;176:74–80. doi: 10.1159/000308696. [DOI] [PubMed] [Google Scholar]
- 5.Aren A, Skanse B. On non-inflammatory glaucoma in acromegaly. Acta Ophthalmol (Copenh) 1955;33:295–306. doi: 10.1111/j.1755-3768.1955.tb00067.x. [DOI] [PubMed] [Google Scholar]
- 6.Bramsen T, Klauber A, Bjerre P. Central corneal thickness and intraocular tension in patients with acromegaly. Acta Ophthalmol (Copenh) 1980;58:971–4. doi: 10.1111/j.1755-3768.1980.tb08324.x. [DOI] [PubMed] [Google Scholar]
- 7.Greco AV, Ricci B, Altomonte L, Rebuzzi AG, Manna R, Ghirlanda G. GH secretion in open-angle glaucoma. Ophthalmologica. 1979;179:168–72. doi: 10.1159/000308886. [DOI] [PubMed] [Google Scholar]
- 8.Kohlhaas M, Boehm AG, Spoerl E, Pürsten A, Grein HJ, Pillunat LE. Effect of central corneal thickness, corneal curvature, and axial length on applanation tonometry. Arch Ophthalmol. 2006;124:471–6. doi: 10.1001/archopht.124.4.471. [DOI] [PubMed] [Google Scholar]
- 9.Rocha EM, Cunha DA, Carneiro EM, Boschero AC, Saad MJ, Velloso LA. Insulin, insulin receptor and insulin-like growth factor-I receptor on the human ocular surface. Adv Exp Med Biol. 2002;506:607–10. doi: 10.1007/978-1-4615-0717-8_85. [DOI] [PubMed] [Google Scholar]
- 10.Bourla DH, Laron Z, Snir M, Lilos P, Weinberger D, Axer-Siegel R. Insulinlike growth factor I affects ocular development: A study of untreated and treated patients with Laron syndrome. Ophthalmology. 2006;113:1197.e1–5. doi: 10.1016/j.ophtha.2005.12.023. [DOI] [PubMed] [Google Scholar]
- 11.Harvey S, Kakebeeke M, Murphy AE, Sanders EJ. Growth hormone in the nervous system: Autocrine or paracrine roles in retinal function? Can J Physiol Pharmacol. 2003;81:371–84. doi: 10.1139/y03-034. [DOI] [PubMed] [Google Scholar]
- 12.Harvey S, Baudet ML, Sanders EJ. Retinal growth hormone in perinatal and adult rats. J Mol Neurosci. 2006;28:257–64. doi: 10.1385/JMN:28:3:257. [DOI] [PubMed] [Google Scholar]
- 13.Baudet ML, Hassanali Z, Sawicki G, List EO, Kopchick JJ, Harvey S. Growth hormone action in the developing neural retina: A proteomic analysis. Proteomics. 2008;8:389–401. doi: 10.1002/pmic.200700952. [DOI] [PubMed] [Google Scholar]
- 14.Ciresi A, Amato MC, Morreale D, Lodato G, Galluzzo A, Giordano C. Cornea in acromegalic patients as a possible target of growth hormone action. J Endocrinol Invest. 2011;34:e30–5. doi: 10.1007/BF03347058. [DOI] [PubMed] [Google Scholar]
- 15.Wordinger RJ, Clark AF, Agarwal R, Lambert W, McNatt L, Wilson SE, et al. Cultured human trabecular meshwork cells express functional growth factor receptors. Invest Ophthalmol Vis Sci. 1998;39:1575–89. [PubMed] [Google Scholar]
- 16.Polat SB, Ugurlu N, Ersoy R, Oguz O, Duru N, Cakir B. Evaluation of central corneal and central retinal thicknesses and intraocular pressure in acromegaly patients. Pituitary. 2014;17:327–32. doi: 10.1007/s11102-013-0505-1. [DOI] [PubMed] [Google Scholar]


