

Abstract
Neuropilins (NRPs) are trans-membrane receptors involved in axon guidance and vascular development. Many growth factors and other signaling molecules bind to NRPs through a C-terminal, basic sequence motif (C-end Rule or CendR motif). Peptides with this motif (CendR peptides) are taken up into cells by endocytosis. Tumor-homing CendR peptides penetrate through tumor tissue and have shown utility in enhancing drug delivery into tumors. Here we show, using RNAi screening and subsequent validation studies, that NRP1-mediated endocytosis of CendR peptides is distinct from known endocytic pathways. Ultrastructurally, CendR endocytosis resembles macropinocytosis, but is mechanistically different. We also show that nutrient-sensing networks such as mTOR signaling regulate CendR endocytosis and subsequent intercellular transport of CendR cargo, both of which are stimulated by nutrient depletion. As CendR is a bulk transport pathway, our results suggest a role for it in nutrient transport; CendR-enhanced drug delivery then makes use of this natural pathway.
Keywords: CendR peptide, mTOR, peptide traffic, silver nanoparticles
Introduction
Transport of molecules across the vascular wall, through tissue, and into target cells plays an important role in various physiological and pathological processes1,2. It is also a major limiting factor in drug delivery, particularly into extravascular tumor tissue3. We recently identified a class of peptides that were particularly effective in entering into cultured cells and that the peptides and cargo attached to them appeared in endocytic vesicles inside the cells4. These peptides shared a C-terminal consensus motif, R/KXXR/K, and we showed that the prototype peptide among them, RPARPAR, binds to neuropilin-1 (NRP1) on the target cells4.
NRP1 is a cell surface receptor with multiple ligands that bind to NRP1 through a C-terminal R/KXXR/K motif similar to RPARPAR. These ligands include vascular endothelial growth factor (VEGF)-A isoform, VEGF-A165, transforming growth factor β, and semaphorin 3A (Sema3A)5-7. VEGF-A165 and Sema3A are known to increase vascular permeability to macromolecules8,9. These complex molecules have additional receptors to trigger downstream signaling events, but the vascular permeability effect is mediated by NRP110, despite the fact that NRP1 lacks an intracellular signaling domain6. Thus, the RPARPAR peptide, and a peptide from the C-terminus of VEGF-A165, both trigger vascular permeability4.
The increased vascular permeability obtained by NRP1 ligation may be based on extravasation through a paracellular or transcellular route, or both. A peptide modeled after the C-terminus of Sema3A has been reported to loosen cell junctions in the endothelium, which is thought to be responsible for the increased vascular permeability triggered by this peptide11. However, NRP1 is also involved in endocytosis. It initiates intracellular trafficking of a number of membrane receptors and regulates the transport of integrins from one part of a cell to another12,13. Moreover, Dvorak and coworkers showed that endothelial cells treated with VEGF-A164 (mouse ortholog of human VEGF-A165) developed striking assemblies of intracellular vesicles they named the vesiculo-vacuolar system and postulated to be involved in transcytosis14,15. However, the ability of NRP1-binding peptides to induce endocytosis and tissue penetration has generally not been appreciated.
Small peptides with a C-terminal R/KXXR/K motif are useful in investigating the functions of NRP1 because unlike the natural ligands of NRP1, which usually bind to additional receptors, the peptides bind only to NRP1, and only to a single site in it. To achieve NRP1 binding and initiate the subsequent endocytosis and tissue penetration, a peptide must have R/KXXR/K at their free C-terminus4. Hence, we have named the system the C-end Rule (CendR) pathway and the R/KXXR/K motif the CendR motif4.
NRP1 is ubiquitously expressed in the vasculature and many other cell types. However, a class of tumor-homing peptides that specifically activate the pathway in tumors has been described recently3. These peptides contain a CendR motif rendered cryptic by an internal position in the peptide. Each of them uses different receptor for initial homing to the target tissue, but converges on NRP1 after a proteolytic processing step at the surface of the target cells that activates the cryptic CendR motif3,16,17. These tumor-specific CendR peptides are capable of penetrating tumor vascular walls and transporting molecular and nanoparticle payloads attached to the peptide into and through extravascular tumor tissue4,16,18,19. Remarkably, CendR pathway also transports cargo that is nearby but not chemically conjugated to the peptide (bystander effect), making it possible to enhance drug delivery to tumors by coadministering the peptide with an unmodified drug19.
Little is known about the workings of the CendR pathway downstream of NRP1. Receptor-bound ligands are typically endocytosed through receptor interaction with a cytoplasmic machinery20. Indeed, CendR peptides and cargo attached to them appear in endocytic vesicles inside the cells4. The cytoplasmic domain of NRP1 contains a PSD-95/Dlg/ZO-1 (PDZ) binding motif (SEA-COOH), which interacts with the PDZ-domain of the cytoplasmic protein GIPC1/synectin6. The NRP1-GIPC1/synectin interaction is known to play a role in the trafficking of endocytosed VEGFR2 into Rab5a-positive endosomes upon VEGF-A165 stimulation12.
Several types of endocytosis have been described21-23. Best understood is the molecular machinery of clathrin-mediated endocytosis (CME), which is responsible for most of receptor-mediated uptake into cells24. Caveolae-mediated endocytosis (Cav-ME) utilizes plasma membrane invaginations known as caveolae, which are formed as a result of caveolin (CAV) oligomerization and are enriched in cholesterol 23. Macropinocytosis (MP) functions to non-selectively engulf extracellular solute macromolecules into endosomes in a receptor-independent manner22. There are no known molecular markers for macropinosomes, but a characteristic feature of these vesicles is their heterogeneous size (0.2 to 5 μm in diameter), while clathrin-coated vesicles and caveolae are usually more homogeneous, spherical in shape, and much smaller (85-150 nm diameter)22. Given the apparent importance of the CendR pathway in receptor trafficking and its potential in drug delivery, we set out to study the molecular machinery that mediates and regulates CendR-mediated cell and tissue penetration. Results of genome-wide RNA interference (RNAi) screens, together with mechanistic and morphological studies of CendR-mediated cell entry and subsequent intercellular transport show that the CendR pathway is distinct from known endocytic pathways, and that this pathway is regulated by nutrient supply to cells and tissues.
Results
Genome wide RNAi screen for CendR-mediated cell entry
To study cell entry of NRP1-binding peptides, we monitored the internalization of RPARPAR into a prostate tumor cell line (PPC1). PPC1 cells were chosen for this study because these cells are particularly efficient in internalizing CendR peptides4. RPARPAR was identified in a phage display screen as the strongest binder to these NRP1-expressing cells4. The CendR motif of RPARPAR is required for peptide binding to NRP1 and internalization into cells4. After entry, RPARPAR colocalizes with endosomal and lysosomal markers inside cells4.
We performed a genome-wide RNAi screen to isolate genes that regulate the cell entry of CendR peptides (CendR endocytosis) (Fig. 1A). To create a probe for the screen, we coated RPARPAR onto fluorescently labeled silver nanoparticles (R-Ag, 70 ± 10 nm)25. The silver nanoparticles greatly enhance the emission from fluorescent dyes coupled to their surface. Another advantage of this silver-based platform is that it allows exclusive tracing of the internalized fraction of R-Ag because the extracellular R-Ag can be readily removed by employing a mild etching solution25. The fluorescence intensity of R-Ag internalized into cells remained stable for up to 24 h (Supplementary Fig. 1A). Treatment with NRP1 siRNA (small interfering RNA, positive control) efficiently blocked R-Ag uptake, similar to NRP1 blocking antibody, whereas non-specific (NS) siRNAs had no obvious effect (Supplementary Fig. 1B). The NRP1 knockdown was verified using quantitative PCR (qPCR) and immunoblotting (Supplementary Fig. 1C). To validate the quality and to evaluate the reproducibility of the assay, we also performed a mini screen using 350 randomly selected genes. The quality of assay was adequate for high-throughput screening (Z-prime factor=0.42). The silencing of a majority of these genes had no significant effect on R-Ag uptake, similar to the negative controls (Supplementary Fig. 1D). These data indicated that the overall potency and specificity of our siRNA library are in an appropriate range to minimize false positives and negatives.
Fig. 1. Overview of genome RNAi screen.
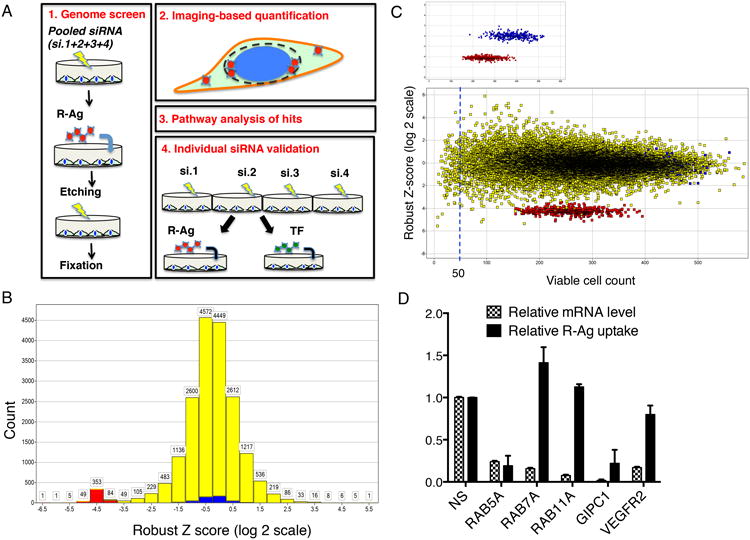
(A) Work flow scheme of genome screen and individual siRNA test.
(B) Overview of genome screen result. The robust Z-scores were determined for each screened gene as described in Methods and listed in Supplementary Data 1. Z-scores were divided into different zones and the values along the x-axis indicate the lowest values for each zone. The number of genes in each Z-score zone is shown on the y-axis. The negative (NS siRNA) and positive (NRP1 siRNA) controls are shown in blue and red, respectively, and the genome genes are in yellow.
(C) Robust Z-scores are independent of cell viability. Viable cell counts were generated as described in Methods and listed in Supplementary Data 1. The robust Z-scores are displayed on the y-axis and viable cell counts on the x-axis. The upper panel shows only the negative (blue) and positive (red) controls. The lower panel includes all tested genomic genes (yellow). The dashed line indicates the cutoff used (viable cell count >50) to eliminate the genes, the knockdown of which caused cytotoxicity. The distribution of the Z-scores on a horizontal line shows that the scores are independent of cytotoxicity.
(D) Validation of the effect of genome library siRNAs for selected genes on R-Ag uptake. PPC1 cells were treated with pooled siRNAs from the genome screen library for indicated genes (x-axis). The relative mRNA expression levels and R-Ag uptake per cell was quantified as described in Methods, and normalized to that of negative control (NS siRNA treated cells) as listed on y-axis. Error bars indicate SEM of three independent experiments.
Our genome screen covered about 18,000 human genes. The effect of knocking down individual genes on R-Ag uptake was quantified, and hits were defined using robust Z-scores, which were largely independent of cell viability (Figs. 1B and C, Supplementary Data 1). Approximately 2% of genome genes were identified as activators/necessary components (Z<-2) or repressors (Z>2) of R-Ag uptake (Supplementary Data 1). Retesting of the genomic library siRNAs for selected genes verified the potency of siRNA knockdown and gave results in agreement with the screening results (Fig. 1D).
CendR endocytosis is distinct from known endocytic pathways
Only a few components characteristic of the known endocytic pathways scored as genome screen hits important for R-Ag uptake (PCME=0.258; PCav-ME=0.295; PMP=0.253; calculated by Ingenuity pathway analysis (IPA, Qiagen)). To validate this observation, we retested selected known endocytic genes for their effect on cellular uptake of R-Ag in parallel with transferrin (TF), the most commonly used marker for tracing CME (Supplementary Data 2). To minimize the off-target effects of the siRNAs, we utilized an individual siRNA format using genomic library siRNAs (Fig. 1A). Knockdown of key components of CME, including clathrin (CLTC, CLTB) and adaptor protein complex 2 subunit (AP2M1), did reduce TF uptake but not R-Ag uptake (Supplementary Fig. 2A). R-Ag uptake was also resistant to treatment of the cells with Dynasore (a Dynamin-II (DNM2) inhibitor26) and DNM2 knockdown, further indicating that CendR endocytosis is not clathrin-dependent (Supplementary Fig. 2B).
We also re-tested a number of the genome screen hits using the individual siRNA format (Supplementary Data 2). A subset of genes the knockdown of which had a profound effect on R-Ag, but had a much milder or even opposite effect on TF uptake, was identified (Fig. 2A). The most dramatic difference was seen with translation-related components (Fig. 2A). The critical role of Rab5a, the marker of early endosome, in TF uptake has been documented27, and agrees with our results on Rab5a dependence of TF uptake (Fig 2A). We also validated using multiple siRNAs that Rab5a is required for R-Ag uptake (Fig. 2A). Thus, the CendR and CME pathways, while clearly distinct, may both lead into early endosomes.
Fig. 2. CendR endocytosis is mechanistically distinct from known endocytic pathways.
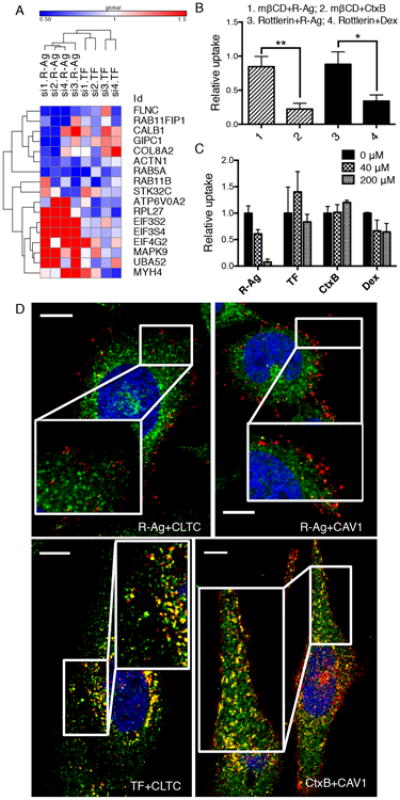
(A) The effect of knocking down selected hit genes from the genome screen on R-Ag and TF uptake using individual siRNAs format. The values represent relative probe uptake normalized to that of negative controls (which is 1, Supplementary Data 2). The heat-map and clustering analysis were generated using Gene-E (Broad institute).
(B) R-Ag uptake is not affected by Cav-ME and MP inhibitors. PPC1 cells were treated with indicated inhibitors (mβCD or Rottlerin) followed by testing for probe uptake (R-Ag, CtxB or Dex) as described in Methods. The fluorescence intensity of each probe was normalized to the average of the corresponding negative controls (vehicle alone) as relative uptake (y-axis). *P<0.05 and **P<0.01 (Student's t-test).
(C) CendR cargo does not compete with other endocytic pathways. Unlabeled CendR peptide, RPARPAR-OH, was added to culture media of PPC1 cells at the indicated concentrations (upper right corner) 10 min prior to addition of fluorescently labeled endocytic probes (x-axis). The intensity of probe signal was normalized to the average of untreated cells (0 μM) as relative uptake (y-axis).
(D) R-Ag does not colocalize with structural components of CME and Cav-ME vesicles. PPC1 cells were incubated with R-Ag, TF-594 or CtxB (red) for 15 min before washing and fixation. CLTC and CAV1 proteins were detected with rabbit anti-CLTC and anti-CAV1 antibodies, followed by staining with anti-rabbit secondary antibody (green). Nuclei were labeled with Hoechst 33342 (blue). Representative images captured by confocal microscopy are shown. The colocalization events between two probes were identified with the “colocalization highlighter” macro for Image J and shown in yellow. Scale bar, 10 μm. Error bars indicate SEM (3-5 replicates).
Knocking down key components of the Cav-ME (e.g. CAVs) and MP (Cdc42, Rac1) pathways did not affect either R-Ag or TF uptake (Supplementary Fig. 2A). We further used chemical inhibitors to distinguish CendR pathway from Cav-ME and MP. Methyl-beta-cyclodextrin (mβCD), which depletes cholesterol, blocked the uptake of the Cav-ME marker cholera toxin B (CtxB), but had no significant effect on R-Ag uptake (Fig. 2B). Similar results were obtained when cells were treated with the sphingolipid synthesis inhibitor, myriocin (Supplementary Fig. 2C). The MP inhibitor, rottlerin, also inhibited the uptake of the fluid phase marker dextran (Dex) more strongly than R-Ag uptake (Fig. 2B). Similar results were obtained with RPARPAR attached to a protein carrier (neutravidin; R-NA), showing independence of results on the nanoparticle carrier (Supplementary Fig. 2D).
An excess of RPARPAR peptide eliminated the uptake of R-Ag, indicating that CendR endocytic pathway is saturable. The same concentration of RPARPAR peptide did not affect the uptake of markers of other endocytic pathways (TF, CtxB or Dex), showing that these pathways do not interfere with each other at the cell entry stage (Fig. 2C).
We next investigated the colocalization of CendR cargo with principal structural components of CME and Cav-ME vesicles. R-Ag exhibited very limited colocalization with CTLC or CAV1 at early stage of cell entry (Fig. 2D). In contrast, TF and CtxB colocalized significantly with clathrin subunit (CLTC) and CAV1, respectively (Fig. 2D). After longer incubation, some colocalization between R-Ag and CLTC (and CAV1) was seen, but mainly at perinuclear sites, where R-Ag also colocalized with NRP1 (Supplementary Fig. 2E). These results show that CendR endocytosis is not dependent on conventional endocytic pathways of cell entry, but resembles macropinocytosis (see below).
CendR endocytosis pathway downstream of NRP1
GIPC1/synectin, a protein that interacts with the cytoplasmic tail of NRP1, exhibited a high inhibitory score in the original siRNA screen (Supplementary Data 1). The GIPC1/synectin dependence of R-Ag uptake was validated using the siRNAs from the screen individually. Two out of the 4 siRNAs strongly inhibited R-Ag uptake, whereas none had a significant effect on TF uptake (Fig. 2A). Similar results were obtained in HUVEC (human umbilical vein endothelial cells), which also exhibit NRP1-dependent endocytosis (Supplementary Figs. 3 A and B). GIPC1/synectin knockdown did not change cell surface NRP1 expression or significantly affect cell surface binding of R-Ag over time (Supplementary Figs. 3 C and D). Moreover, forced expression of wild-type NRP1 in HeLa cells, which do lack NRP1 expression but express GIPC1/synectin at levels comparable to the PPC1 cells (Supplementary Figs. 4 A and B), enabled the internalization of R-Ag (Fig. 3A). In contrast, expressing a mutant NRP1 that lacks the GIPC1/synectin-interacting sequence in the cytoplasmic domain (ΔSEA), allowed surface binding of R-Ag but blocked R-Ag entry into cells as effectively as GIPC1/synectin knockdown (Fig. 3 A and B). Thus, the NRP1-GIPC1/synectin interaction is not needed for CendR peptide binding, but is important for internalization into cells. TF uptake was not affected by overexpression of the NRP1 mutant or GIPC1/synectin knockdown (Supplementary Fig. 4C). Finally, knocking down GIPC1/synectin did not significantly affect the uptake of CtxB and Dex, lending further support to the notion that CendR is different from the known endocytic pathways (Fig. 3C).
Fig. 3. GIPC1/synectin is required for CendR endocytosis downstream of NRP1 binding.
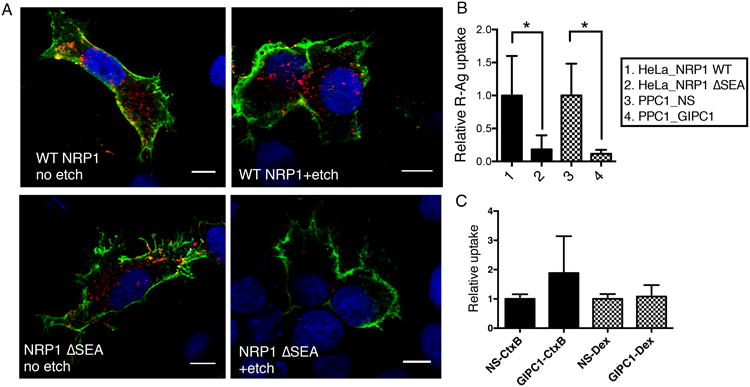
(A) NRP1-GIPC1/synectin interaction is important for the internalization of CendR peptides into cells. HeLa cells were transfected with plasmids expressing wild-type (WT) NRP1, or NRP1 ΔSEA mutant as described in Methods. R-Ag (red) was added 48 h later and incubated with the cells for 2 h at 37°C. The cells were then etched or washed twice with PBS without etching, fixed, and stained for cell surface NRP1 (green). Nuclei were stained with Hoechst 33342 (blue). Three independent experiments were performed and representative images are shown. Scale bar, 10 μm.
(B) Quantification of R-Ag uptake in (A). The fluorescence intensity of R-Ag per NRP1-positive HeLa cells in (A) were quantified and normalized to the average of WT NRP1-expressing samples as relative uptake (y-axis). As a comparison, PPC1 cells were treated with NS or GIPC1/synectin siRNA, and then incubated with R-Ag for 1 h before etching as described in Methods. The R-Ag signal per cell was quantified and normalized to the average of NS treated samples as relative uptake (y-axis). *P<0.05 (Student's t-test).
(C) GIPC1/synectin is not required for cellular uptake of non-CendR endocytic probes. After treatment with negative control siRNA (NS) or siRNA targeting GIPC1/synectin, the uptake of CtxB or Dex by PPC1 cells was measured as described in Methods. The fluorescence intensity of each probe per cell was normalized to the average of the corresponding negative controls (NS siRNA treated) as relative uptake (y-axis).
Error bars indicate SEM (3-6 replicates).
CendR endocytosis is regulated by nutrient availability
Pathway analysis on the genome screen hits showed that signaling pathways involved in translation initiation and mTOR (mammalian target of rapamycin) signaling were the most prevalent groups of hits, especially among those that increased R-Ag uptake (Fig. 4A). mTOR is a well-known upstream controller of translation initiation28, and the mTOR pathway plays a central role in sensing and integrating environmental cues to regulate cellular growth and homeostasis29. Nutrient depletion, such as removal of glucose or amino acids, inhibits mTOR activity, and translation initiation28,30. Thus, we next investigated the effect of nutrient availability on cellular uptake of CendR cargo.
Fig. 4. CendR-mediated cellular uptake is regulated by nutrient availability.
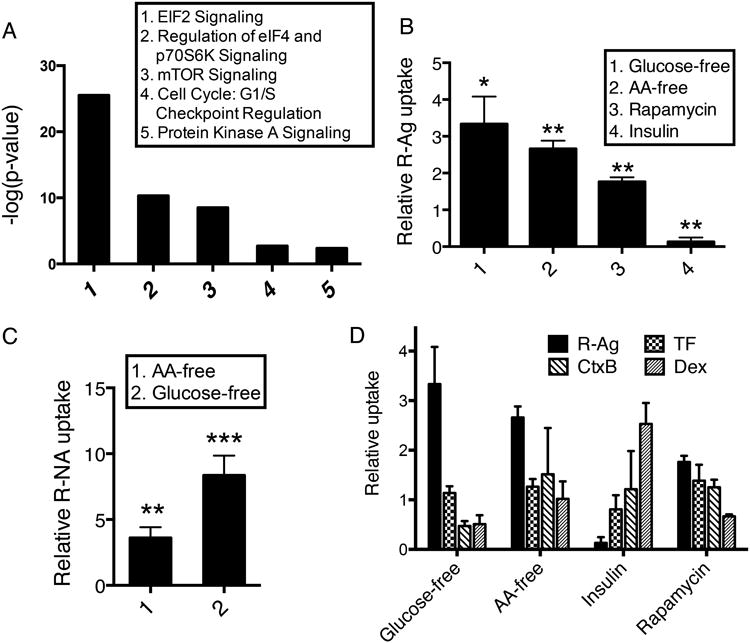
(A) Network analysis of genome screen hits using IPA. Top pathways associated with genomic hits (Supplementary Data 1) and the corresponding p-values (calculated by IPA) are shown.
(B) Regulation of R-Ag uptake by nutrient conditions and other stimuli. After the indicated treatments (x-axis), PPC-1 cells were incubated with R-Ag as described in Methods. The average intensity of internalized R-Ag per cell was normalized to cells cultured in complete media and is shown as relative uptake (y-axis).
(C) Stimulation of R-NA uptake by nutrient deprivation. After the indicated treatments (x-axis), PPC1 cells were incubated with R-NA as described in Methods. The average intensity of internalized R-NA per cell was normalized to cells cultured in complete media as relative uptake (y-axis).
(D) R-Ag and other endocytic probes respond differently to environmental cues. After the indicated treatments, PPC1 cells were incubated with different endocytic probes (upper right panels) for internalization as described in Methods. The fluorescence intensity of each probe under the indicated conditions (x-axis) was normalized to cells cultured in complete media as relative uptake (y-axis).
Error bars indicate SEM (3-5 replicates). *P<0.05, **P<0.01 and ***P<0.001 (Student's t-test) in comparison to complete media conditions of the corresponding probes.
Depleting glucose or amino acids in the culture media enhanced R-Ag uptake (Fig. 4B). Nutrient depletion also promoted the uptake of silver nanoparticles coated with another a CendR motif peptide (tLyP1)16 (Supplementary Fig. 5A). Nutrient depletion did not trigger nonspecific uptake of either control silver nanoparticles (no peptide coating; NA-Ag) in PPC1 cells, or of R-Ag in M21 cells, which express no NRP1 and allow no entry of RPARPAR4 (Supplementary Fig. 5B). Nutrient depletion also promoted the uptake of R-NA (Fig. 4C), showing that the pathway and its regulation by nutrient availability are not limited to nanoparticles.
The uptake of other endocytic probes showed no increase upon nutrient deprivation, or was even opposite to that of R-Ag uptake (Fig. 4D). The uptake of a cell-penetrating peptide lacking CendR activity, TAT peptide composed of D-amino acids (D-TAT), also exhibited no response to nutrient depletion (Supplementary Fig. 5C). These results agree with the observation that knocking down translation-related components had different effects on R-Ag and TF uptake (Fig. 2A), and further demonstrate the uniqueness of CendR endocytosis.
Treatment of cells with the mTOR inhibitor rapamycin enhanced R-Ag uptake (Fig. 4B), whereas a chemical mTOR activator31 abolished the enhancement of CendR uptake that was induced by amino acid or glucose deprivation (Supplementary Fig. 6A). Insulin stimulation, which activates mTOR, also suppressed R-Ag uptake (Fig. 4B).
Cell surface expression of NRP1 was increased in cells cultured in nutrient-depleted media (Supplementary Fig. 6B). Knocking down the expression of a translational machinery component also increased surface presentation of NRP1 (Supplementary Fig. 6C). Moreover, the expression of mRNA for mTOR and NRP1 in various cancer cell lines shows inverse correlation (Supplementary Fig. 6D, Supplementary Data 3). Thus, at least some of the regulation of the CendR pathway activity takes place at the level of NRP1 expression and surface presentation. Another neuropilin family member, NRP2, has a more restricted tissue distribution than NRP1, but is also sometimes expressed at elevated levels in tumors6. PPC1 cells express little NRP2, and it did not appear to be regulated by nutrient deprivation in these cells (Supplementary Fig. 6E). We focused this study on NRP1, but NRP2 also binds CendR peptides and causes their internalization16, so our finding likely applies to NRP2 as well.
Visualization of CendR endocytosis
Next, we used transmission electron microscopy (TEM) to visualize the cellular uptake of CendR cargo at the ultrastructural level. In most cases, gold nanoparticles coated with RPARPAR peptide (R-Au 50 nm, 45 ± 7 nm) appeared to be engulfed as a cluster into irregularly shaped vacuoles formed by extension and bending of nearby lamellipodia (Fig. 5A). Upon depletion of either amino acids or glucose, these endocytic structures were more evident, and their capacity for engulfing R-Au was increased (Fig. 5A). In contrast, insulin treatment diminished the R-Au uptake (Supplementary Fig. 7A). After entry, R-Au appeared in membrane-enclosed organelles with characteristics of endosomes, or more often, multivesicular bodies (MVBs) (Fig. 5B). In rare cases, R-Au was seen in smaller vesicles resembling clathrin-coated vesicles (Supplementary Fig. 7B). In contrast, TF, when coated on 15-nm gold particles, has been shown to internalize through clathrin-coated pits32. Because previous studies have indicated that nanoparticle size may affect the cell entry route33,34, we also tested 17-nm R-Au particles (16 ± 3 nm). Like the 50 nm particles, the smaller R-Au also appeared in macropinocytosis-like vacuoles, indicating that the route of CendR uptake was not affected by the size of nanoparticles (Supplementary Fig. 7C).
Fig. 5. CendR peptide initiates an NRP1-dependent endocytosis process resembling macropinocytosis.
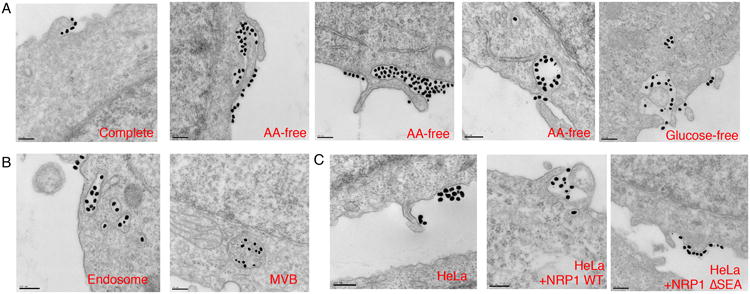
(A) PPC1 cells were cultured in complete, AA-free or glucose-free media for 16 h followed by the incubation with R-Au (dense dots, 50 nm) for 30 min and fixation. Representative TEM images at cell-entry sites are shown.
(B) Representative TEM images for intracellular organelles containing R-Au (50 nm) with characteristics of endosome and MVB.
(C) NRP1 dependence of CendR endocytosis. HeLa cells without or with transfection of NRP1 expression plasmids (NRP1 WT or ΔSEA) were incubated with R-Au (dense dots, 50 nm) for 30 min before fixation. Representative TEM images are shown. Scale bar, 200 nm.
CendR endocytosis, although it morphologically resembles macropinocytosis22, is receptor-mediated; it depends on peptide binding to NRP1. Gold nanoparticles coated with a control peptide (RPARPARA; RA-Au, ∼50 nm), which does not bind to NRP14, were not taken up into cells even after the starvation treatment (Supplementary Fig. 7D). HeLa cells, naturally expressing no NRP1 (Supplementary Fig. 4 A and B), did not engulf R-Au even though lamellipodia-like structures were present (Fig. 5C). Forced expression of NRP1, but not NRP1 ΔSEA, in HeLa cells rendered them capable of taking up R-Au into vesicles similar to those in PPC-1 cells (Fig. 5C). Thus, this type of endocytosis is specifically initiated by CendR peptide binding to NRP1 and stimulated by nutrient deprivation.
CendR mediated intercellular transport
A notable feature of CendR peptides is that they initiate both receptor-mediated cellular uptake and active trans-tissue transport18,19. We next set up a system to monitor cell-to-cell transfer as illustrated in Supplementary Fig. 8A. Only a minor fraction of recipient cells became positive for R-Ag when the cells were cultured as a monolayer. A modest increase in R-Ag transfer was observed when donor and recipient cells formed spheroid-like aggregates in suspension (Fig. 6A). However, a combination of spheroid culture and nutrient deprivation greatly enhanced the intercellular transfer of R-Ag without altering the physical appearance of the cell aggregates (Fig. 6A and Supplementary Fig. 8B).
Fig. 6. Intercellular transport of CendR cargo responds to nutrient availability.
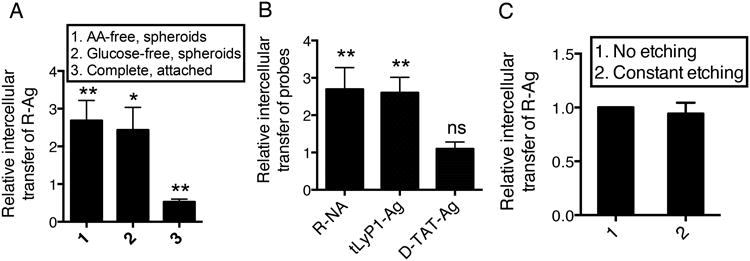
(A) Cell-to-cell R-Ag transfer is stimulated by nutrient deprivation. PPC1 cells were incubated with R-Ag for 2 h internalization. After etching, cells were harvested (donor cells) and mixed with PPC1-GFP cells (recipient cells) in PBS (pH=7.4). The cell mixture was then seeded as a monolayer in complete medium (complete, attached), or as spheroids in complete, AA-free or glucose-free medium. After 16 h, cells were harvested, and the R-Ag transfer was quantified as described in Methods and normalized to that of “complete spheroids”, which was set as 1.
(B) The nutrient regulation only applies to the intercellular transport of CendR peptides. Intercellular transport of indicated probes (x-axis) was monitored in cells grown as spheroids in complete and AA-free media as described in (A). The ratio of R-Ag transfer (AA-free vs. complete) represents the degree of stimulation by nutrient depletion (y-axis).
(C) Intercellular transport is protected from extracellular etching. R-Ag transfer was monitored in spheroids kept in AA-free media as described in (A), with or without constant etching treatment as described in Methods. The R-Ag transfer values at constant etching condition were normalized to that of no etching condition and listed at the y-axis.
Error bars indicate SEM (3-5 replicates). ns (not significant), *P < 0.05 and **P < 0.01 (Student's t-test) in comparison to complete spheroid conditions of the corresponding probes.
The nutrient regulation of the intercellular transport of CendR cargo was also observed with the tLyP1 peptide and R-NA, but not with D-TAT (Fig. 6B). We also observed CendR transfer between PPC1 and HUVECs, which was also enhanced by nutrient deprivation (Supplementary Fig. 8C). The extent of intercellular R-Ag transfer was not altered by constant exposure to the silver etching solution (Fig. 6C), suggesting that CendR cargo is transferred in membrane-enclosed vesicles or occurs in cell-to-cell contacts that do not allow entry of the etching solution.
CendR pathway responds to nutrient availability in vivo
To demonstrate the dependence of CendR pathway activity on nutrient availability in a tissue context, we starved live tumor slices in media depleted of glucose or amino acids. R-Ag uptake was greatly elevated upon starvation in two different tumor models (Figs. 7 A and B). Rapamycin treatment of the tumor slices also increased the R-Ag uptake, indicating that mTOR also regulates CendR endocytosis in vivo (Fig. 7A).
Fig. 7. Nutrient regulation of CendR uptake in physiological context.
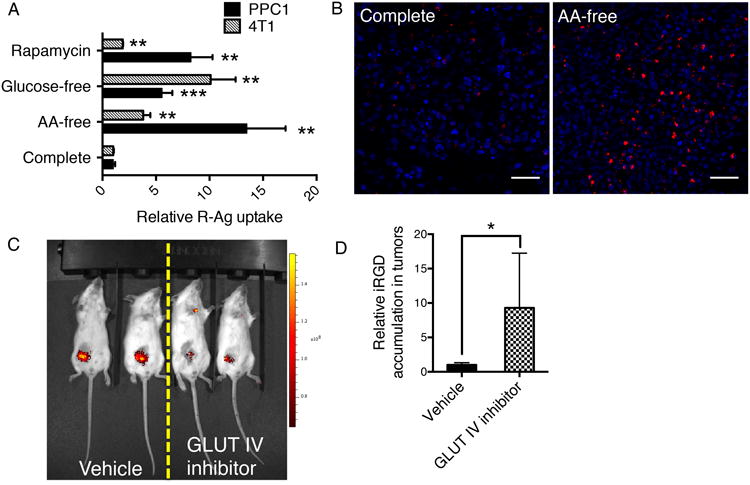
(A) CendR uptake in live tumor slices responds to nutrient availability. Live tumor tissue slices (PPC1 xenografts; 4T1 mouse mammary tumors) were obtained and incubated under the indicated conditions (y-axis) for 6 h. The slices were then suspended in the same kind of media containing 15 pM R-Ag, and incubated for another two hours at 37°C with gentle shaking on a rocker before etching and fixation. The fluorescence intensity of R-Ag per cell was quantified using ImageJ, normalized to slices cultured in complete media and shown as relative uptake (x-axis). **P<0.01 and ***P<0.001 (Student's t-test) in comparison to complete media conditions of the corresponding tumor types. Error bars indicate SEM (4-7 replicates).
(B) Representative images of R-Ag internalization into PPC1 tumor slices. R-Ag, red; nuclei, blue. Scale bar, 50 μm.
(C) Representative image of glucose uptake into 4T1 tumors after GLUT IV inhibitor treatment. Mice bearing 4T1 tumors were treated with intratumoral injections of vehicle only or GLUT IV inhibitor as described in Methods. IRDye 800CW 2-deoxy-D-glucose (2-DG) in 10 nmol in 100 μl PBS was then injected intravenously into a tail vein and 24 h later, the fluorescence intensity of 2-DG was captured using Xenogen IVIS 200 imager (PerkinElmer Inc.). The experiment was conducted twice with at least three mice per group.
(D) iRGD accumulation in tumors responds to glucose deprivation. FAM (fluorescein)-labeled iRGD (200 μg in 100 μl PBS) was intravenously injected into mice bearing 4T1 tumors treated with vehicle alone or with the GLUT IV inhibitor. After 2 h of circulation, the mice were perfused with PBS containing 1% BSA to remove peptide remaining in the circulation. The tumors were excised, fixed and sectioned. FAM-iRGD in the tumors was detected with rabbit anti-FITC antibody. The average signal intensity per cell was normalized to vehicle-treated tumors as relative uptake. The experiment was conducted twice with at least three mice per group, and error bars indicate SEM. *P<0.05 (Student's t-test).
We next investigated nutrient regulation of the CendR pathway in live animals. Here, we used a prototypic tumor-targeting CendR peptide, iRGD (CRGDR/KGPD/EC)18, to specifically monitor the CendR response in tumors upon restriction of nutrient supply. Intratumoral administration of an inhibitor of glucose transporter GLUT IV greatly suppressed glucose uptake (Fig. 7C) without significantly affecting tumor weight (Supplementary Fig. 9A). The glucose restriction caused a marked increase in the accumulation of iRGD in the extravascular tumor compartment (Fig. 7D and Supplementary Fig. 9B), whereas iRGD distribution in other organs was not altered (Supplementary Fig. 9C). Phosphorylation of S6 ribosomal protein (Ser235/236), an indicator of mTOR activity35, was lower after GLUT IV inhibitor treatment, suggesting that glucose restriction regulates CendR activity through mTOR (Supplementary Fig. 9D). Together, these results show that the activity of CendR-mediated cellular uptake and tissue penetration inversely correlates with nutrient availability in vivo.
Discussion
Cell-penetrating peptides have widely been used to deliver various types of cargo in vitro and in vivo, but the underlying machinery for cell entry remains unclear36. Here, we systematically surveyed the molecular machinery that mediates and regulates the cell entry of CendR peptides, a novel class of cell and tissue-penetrating peptides with considerable translational potential17-19.
The silver nanoparticle technology we used to study CendR endocytosis has a number of advantages25. In addition to the ease of synthesis and surface functionalization, the main advantage is the ability to use an etching solution to remove any particle that has not been internalized, which provides protection against the etching and focuses the analysis on internalized particles only. A possible drawback of this method is that the use of a particulate probe might give results different from how cells would handle a small molecule ligand. We guarded against this possibility by repeating the key experiments with a protein-based probe. Also, our cellular uptake and tissue penetration results agree with published work on the use of simple peptides to target various types of drug to tumors16,19.
Our siRNA screen showed that the CendR pathway differs in profound ways from the CME pathway, which has been analyzed in a similar manner37. Direct comparison between R-Ag and TF uptake further underscored the differences in their gene dependence. Limited molecular information available on Cav-ME and MP precluded similar comparison, but our inhibitor studies supported the notion that CendR uptake does not depend on the Cav-ME or MP machinery. This was the case whether the probe was R-Ag nanoparticles or the R-NA protein complex. Moreover, CendR cargo did not compete with other endocytic probes for cell entry, and showed no significant co-localization with principal components of known endocytic vesicles.
TEM studies showed that CendR endocytic vesicles are morphologically different from clathrin-coated vesicles or caveolae, but resemble MP. The receptor (NRP1)-dependence of the CendR pathway, resistance to the MP inhibitor rottlerin, and stimulation by nutrient deprivation further distinguish it from the conventional, non-selective MP. Uptake of plasma proteins, such as albumin, by MP has recently been shown to be an important source of amino acids for RAS-transformed tumor cells38. The plasma protein uptake had the characteristics of classical MP and appears to be different from CendR in that, unlike CendR, it was not dependent on a receptor and was sensitive to MP inhibitor38. Another difference is that we found MP, as measured by dextran uptake, not to be responsive to nutrient depletion. Finally, the cells we used do not express activated RAS.
Treatment of cells with VEGF-A165, which is a natural NRP1 ligand, causes internalization of NRP1 and VEGFR2, and presumably also VEGF-A165, in a clathrin-dependent manner39,40. This is different from the internalization of CendR peptide-NRP1 complexes, which does not involve clathrin. As VEGF binds both to the VEGF receptor and NRP1, the likely reason for this difference is the presence of VEGF-R2 in the VEGF-A165-induced complex. In contrast, CendR peptides bind only to NRP1, allowing one to study the functions of NRP1 in isolation of other receptors. The engulfment structures we induce here with the CendR peptide may represent the first stage in NRP1-dependent formation of the vesiculo-vacuolar system, which is induced by VEGF and thought to mediate transcytosis14.
GIPC1/synectin was among the most interesting hits from the genome screen. It is a PDZ domain protein that interacts with the cytoplasmic domain of NRP141. Accordingly, we show here that GIPC1/synectin, especially its interaction with NRP1, is needed for the uptake of NRP1-bound cargo into cells, while GIPC1/synectin had no effect on the uptake of the other endocytic probes we tested. We also show that the lack of GIPC1/synectin-interacting domain (ΔSEA) impairs CendR endocytosis. GIPC1/synectin interacts with many membrane proteins, including megalin, syndecan-4, various receptor tyrosine kinases, and integrins42-46. The GIPC1/synectin association of megalin47 is particularly interesting because megalin mediates reabsorption of proteins in the proximal tubules of the kidney, which resembles the role of NRP1 in the CendR pathway. Moreover, GIPC1/synectin is highly expressed in the kidney48. GIPC1/synectin may serve as the scaffold to bridge NRP1 and its bound CendR cargo with the cytoskeleton network and transport machinery13, and NRP1-GIPC1/synectin complex may determine the subsequent transport route.
A striking feature of CendR endocytosis revealed by our study is its regulation by the nutrient supply and mTOR, the central hub of nutrient-sensing and growth control. The inverse correlation of CendR activity to the availability of nutrients, which was not shared by the other pathways, further underscored the distinctiveness of CendR pathway. TEM studies showed that CendR endocytic structures become more prominent upon nutrient-depletion, and that there is a concomitant increase of NRP1 expression at the cell surface, which provides at least a partial explanation for the change in CendR activity. The changes in NRP1 expression may be mediated by transcription factors the activity of which is regulated by mTOR signaling. These factors include Sp1, which is known to control transcription of the NRP-1 gene 49-51, and which exhibited a high inhibitory score in our screen (Z=-1.9). mTOR plays a contributory, but ill-defined, role in a number of diseases29. Our results suggest that the effect of mTOR signaling on nutrient transport in such diseases should be considered.
The rapid penetration of CendR peptides across tumor tissue19 implies active transport from one cell to another. In this study, we directly demonstrate intercellular transport of CendR cargo and show that this part of the pathway is also responsive to nutrient availability. The nutrient responsiveness of the intercellular transport agrees with the observation that glucose restriction promoted tumor penetration of iRGD. That the transfer occurred more efficiently in 3-D spheroid than monolayer culture suggests requirement of extensive cell-cell contact. This result and the resistance of the transfer to constant etching of extracellular silver nanoparticles, suggests that CendR cargo may travel inside secretory vesicles (e.g. exosomes, microvesicles) or via direct cell-to-cell contact. Moreover, the transport of CendR cargo between HUVEC and tumor cells suggests that this system may be useful to study CendR penetration of tumor vasculature and further delivery of cargo to tumor cells.
Our primary focus here and in earlier studies has been the role of the CendR system in tumors because of the apparent utility of the CendR/NRP1 system in drug delivery into tumors18,52,53. However, this pathway is also active in normal cells, as we show here for HUVECs. Also, CendR peptides targeting a normal tissue have been identified54. Thus, the CendR pathway could be involved in nutrient delivery into tissues with poor vascular supply. As the system is particularly active in tumors, which frequently express elevated levels of NRP1 and/or NRP26, this may be another physiological process tumors have hijacked to promote their growth. Tumor cell survival in poorly vascularized parts of a tumor would be particularly likely to benefit from a high level of CendR transport.
In summary, we show here that CendR peptide binding of NRP1 initiates an endocytic process that is morphologically and mechanistically distinct from the known endocytosis pathways. Both cellular uptake and intercellular transport of CendR cargo are regulated by nutrient availability through changes in mTOR activity. NRP1-GIPC1/synectin interaction is important for the initial internalization, and may hold the key to elucidating the subsequent transport route inside the cells. The nutrient regulation of the pathway also adds an important new dimension to the use of the CendR pathway in drug delivery.
Methods
Reagents and cell lines
PPC1 and HUVEC cell lines were purchased from the American Type Culture Collection (ATCC), and HeLa cells were a gift from Dr. Robert G. Oshima at Sanford-Burnham Medical Research Institute (La Jolla, CA). PPC1-GFP cells were made by infecting PPC1 cells with GFP-expressing lentivirus, which was produced using ViraPower lentiviral directional TOPO expression kit (Life Technologies) and a pEGFP-C1 vector (Clontech) according to the manufacturer's instructions. PPC1, PPC1-GFP, and HeLa cells were cultured in DMEM (Thermo Scientific) plus 10% fetal bovine serum (FBS) with penicillin/streptomycin (complete media). HUVEC cells were cultured in EBM-2 media (Lonza) plus singlequots supplements (Lonza). Endocytic probes used here were TF-Alexa Fluor 488 (TF), TF-Alexa Fluor 594 (TF-594), CtxB-Alexa Fluor 594 (CtxB) and Dex-Alexa Fluor 488 (Dex) (MW=10,000; Life Technologies). Anti-NRP1 (blocking) antibody were prepared by immunizing the rabbits with ligand-binding b1b2 domain of human NRP155, followed by affinity purification of the antiserum on the immobilized NRP1 b1b2 (Aminolink Plus immobilization kit, Thermo Scientific). The final concentration of anti-NRP1 antibody used in all experiments was 20 μg ml-1.
Chemicals used in this study: rapamycin and GLUT IV inhibitor (Calbiochem); methyl-beta-cyclodextrin (Santa Cruz Biotechnology); rottlerin, MYH1485, myriocin and insulin (Sigma-Aldrich); IRDye 800CW 2-deoxy-D-glucose (2-DG, Licor). Antibodies used in immunofluorescence studies (1:200 dilution): rabbit anti-human CLTC (Cat # ab21679) and CAV1 (Cat # ab2910, Abcam), mouse anti-human NRP1 (Cat # 130-090-693, Miltenyi Biotec), rabbit anti-FITC antibody (Cat # A-889, Life Technologies), rat anti-mouse CD31 antibody (Cat # 550274, BD Pharmingen), rabbit anti-phospho-S6 (Ser235/236) antibody (Cat # 2211, Cell Signaling), donkey anti-rabbit (Cat # A-21206) and rabbit anti-mouse (Cat # A-11029) secondary antibodies labeled with Alexa Fluor 488 (Molecular Probes), and donkey anti-rat secondary antibody labeled with Cy3 (Cat # 712-165-153, Jackson ImmunoResearch). Antibodies used in immunoblotting: mouse anti-β actin antibody (Cat # A2228, Sigma-Aldrich, 1:1000 dilution), IRDye anti-rabbit (Cat # 926-68171), and anti-mouse (Cat # 926-32212) secondary antibodies in 1:5,000 dilution (Li-Cor).
RNAi screen
The NRP1 siRNA was acquired from Ambion (Cat # AM51331) as positive control. The siRNAs targeting other genes in our experiments include: GIPC1/synectin (Cat # 4392420, ID-S21130, Ambion) and EIF3S2 (Cat # 4392420, ID-S16512, Ambion), if not indicated otherwise. As negative control, we utilized a mix of nonspecific siRNAs56 provided by Sanford-Burnham functional genomics core. The screen was performed using the On-Target-Plus (OTP) genome-wide siRNA library from Dharmacon in pooled format (4 siRNAs per gene). Briefly, PPC1 cells were reverse transfected with 10 nM siRNA per well in 384-well plates using Lipofectamine RNAiMAX transfection reagent (Life Technologies). After allowing 72 h for the transfection the cells were incubated with 5 pM R-Ag (CF555) for 1 h. Etching buffer (a final concentration of 10 mM Na2S2O3 and 10 mM K3Fe(III)CN63- in PBS)25 was then added into the solution and incubated for 20 min before being washed twice with PBS. Thereafter, cells were fixed using 4% formaldehyde (Sigma-Aldrich) and stained with 1.25 μg ml-1 Hoechst 33342 (Life Technologies).
Individual siRNAs were assayed for their effect on R-Ag and TF internalization in parallel. PPC1 cells were separately transfected with 4 individual siRNAs for each gene as done in genome screen. Dharmacon OTP siRNA pool against TF receptor (TFRC) was used as a positive control. After allowing 72 h for the transfection, the cells were further incubated with 5 pM R-Ag or 5 μg ml-1 TF for 1 h. R-Ag wells were processed as above and TF-treated cells were washed twice with cell culture medium (DMEM plus 10% FBS) to remove unbound material followed by fixation and staining of the nuclei.
Automated image acquisition, quantification and data analysis were performed as follows: Plate imaging was performed on an Opera QEHS (PerkinElmer, Inc.) high content screening system equipped with a 20× magnification (0.45 NA) objective. R-Ag acquisition was set to 561 nm laser line excitation, 600/40 nm emission filter, 480 ms exposure time and imaged in confocal mode. TF acquisition was set to 488 nm laser line excitation, 540/75 emission filter and 80 ms exposure time. Nuclear acquisition was set to 365 nm xenon arc lamp excitation, 450/40 nm emission filter, 25 ms exposure time and imaged in wide-field mode. Each gene was tested in duplicate wells, and four images were acquired per well.
Images were uploaded to a Columbus Image Data Storage and Analysis System (PerkinElmer, Inc.) and subsequently analyzed with a custom Acapella 2.7 (PerkinElmer, Inc.) analysis script. Briefly, Nuclear detection was performed on the Hoechst channel using the Acapella Nuclear Detection Library (PerkinElmer, Inc.) followed by cytoplasm detection on the Hoechst 33342 channel using the Acapella Cytoplasm Detection Library (PerkinElmer, Inc.). Cells exhibiting chromatin condensation (cellular division or death) were excluded from further analysis based on the Hoechst dye intensity. R-Ag within the whole cell region (nucleus and cytoplasm) were then identified by image thresholding and subsequently quantified for fluorescence intensity and number of particles per cell. Values were aggregated (mean) on a per-well basis.
The average R-Ag (or TF) intensity per cell for each gene was further normalized to that of negative controls in the same plate as its relative uptake (RU). In the genome screen, the binary logarithm of RU values for each gene was used to generate its robust Z-score based on [1]57:
| [1] |
RUx, normalized uptake for a particular gene x; RUmedian, the median RU value for the whole screen; SD, standard deviation of RU for all tested genes.
Z-prime factor was calculated using [2]58:
| [2] |
SD1, standard deviation of two duplicates for individual genes; SD2, standard deviation of readouts for all tested genes; RUx, normalized uptake for a particular gene x; RUmedian, the median RU value for the whole screen.
Pathway analysis was performed utilizing Ingenuity Pathway Analysis (IPA, Qiagen) to identify the signaling pathways associated with the hits from the screen. To validate selected hits from the genome screen, individual siRNAs were used. As these tests included only a limited number of hits, there is no expectation of the data following a normal distribution. Therefore, we utilized the RU in comparison with negative controls to score inhibition (<0.7) or enhancement (>1.5) (Supplementary Data 2).
Cellular treatments
PPC1 cells were used in all studies unless indicated otherwise. Insulin treatment was carried out on cells cultured in serum-free media for at least 16 h before the addition of insulin (100 nM) for 1 h. Rapamycin (100 nM) was added to complete media for 1 h. For RNAi experiments, cells were seeded one day earlier and transfected of 10 nM siRNA using RNAiMAX for 72 h. For plasmid transfection, cells were transfected with NRP1 plasmids using Fugene 6 (Promega) based on manufacturer's instruction. For inhibitor treatment, PPC1 cells were incubated with 2.5 mM methyl-β-cyclodextrin or with 1 μM rottlerin for 1 h before adding probes.
Cellular uptake of endocytic probes
The final concentration of the endocytic probes was as listed below, if not otherwise indicated: R-Ag (5 pM), R-NA (5 pM), TF (5 μg ml-1), CtxB (0.5 μg ml-1) and Dex (100 μg ml-1). After 1 h incubation, R-Ag samples were etched, while cells incubated with the other probes were washed twice with cell culture media followed by fixation with 4% PFA (paraformaldehyde) and nuclear staining with Hoechst 33342 (blue).
Nutrient deprivation
Glucose-free media was made with DMEM (Cat # 11966-025, Invitrogen) supplemented with 10% FBS dialyzed with cassette (MWCO=3,500). The composition of the amino acid (AA)-free media is given in Supplementary Table 1. Cells were cultured in glucose-free or AA-free media for 16 h if not indicated otherwise.
To generate tumors, 1 × 10⁶ PPC1 cells were subcutaneously injected into male athymic nude mice (Cat # 6902f, Harlan laboratories) and 1 × 10⁶ 4T1 cells were injected into mammary fat pad of WT female Balb/c mice. Tumors were excised and sectioned using Vibratome (Cat # VT1200S, Leica) at a thickness of ∼300 μm under ice-cold HBSS according to the manufacturer's instructions. The slices were cultured at the liquid-air interface of Millicell® 6-well cell culture insert (Cat # PICM03050, Millipore) in Hams F12 Medium (Invitrogen) with 20% FBS overnight at 37°C. The viability of the slices was determined using 2.5% 2,3,5-Triphenyltetrazolium (Sigma-Aldrich) in PBS 59. The tumor slices were initially cultured in complete media, which was changed to glucose-free or AA-free media, or to complete media containing 100 nM rapamycin for 6 h at 37°C. To carry out nutrient deprivation in vivo, GLUT IV inhibitor (Cat # WZB117, Calbiochem) was dissolved in PEG400-water solution (v/v=1:1) and administered intratumorally to Balb/c female mice (6-8 week old) bearing orthotopic 4T1 tumors (∼0.5 cm) at a daily dose of 10 mg kg-1 for 5 days. Animal experimentation was performed according to procedures approved by the Institutional Animal Care and Use Committee at Sanford-Burnham Medical Research Institute.
Immunofluorescence staining and flow cytometry
To stain intracellular proteins, fixed cells were permeabilized for 5 min with 0.25% Triton X-100 (TX100) in PBS. The cells were blocked with a mix of 5% goat and donkey serum in PBS (v/v) followed by 1-h incubation at room temperature with primary and secondary antibodies. Surface-expressed proteins were stained without permeabilization of the cells. Fluorescence signal for R-Ag, endocytic probes, and immunofluorescence staining were imaged by confocal microscopy (Fluoview 1000, Olympus; LSM 710 NLO, Zeiss) or bright field microscopy (inverted TE300 Nikon wide field; Leica DMIRE2 wide field). The fluorescence intensity of each probe and nuclei count was quantified using ImageJ 60, and probe uptake per cell was generated by the mean intensity divided by nuclei number. Flow cytometry was performed with fixed cells using LSR Fortessa (BD Biosciences) based on manufacturer instruction.
Transmission electron microscopy
After R-Au uptake, PPC1 cells were fixed with 2% glutaraldehyde in PBS and samples were processed and embedded by the electron microscopy facility at University of California, San Diego. Images were taken with JEOL 1200 EX II TEM (JEOL) based on manufacturer's instruction.
Extraction and quantification of cellular RNA and protein
Cellular RNA was extracted by RNeasy kit (Qiagen) followed by reverse transcription (Qiagen) according to the manufacturer's instruction. Quantitative PCR (qPCR) was performed using SYBR green PCR master mix and ABI 7900HT (Applied Biosystems). Human tata-box binding protein (hTBP) was used as internal control and the primers for all tested genes were listed in Supplementary Table 2. The relative gene expression was calculated as described previously 61. Cellular proteins were extracted using RIPA buffer (Life Technologies) and dissolved in SDS-PAGE reducing buffer (Life Technologies). Immunoblots were developed using rabbit anti-human NRP1 antibody and mouse anti-β actin antibody. IRDye secondary antibodies were used to detect the primary antibodies and the blots were imaged with Odyssey (Li-Cor).
Intercellular transport
Donor cells cultured in complete media were first incubated with R-Ag or other indicated probes for internalization at 37°C. After etching of silver particles or extensive washing using culture media for other types of probes, the donor cells were harvested and mixed with recipient cells at a ratio of 1:2 in PBS. The cell mixture was then seeded in regular culture plates for monolayer cultures or in ultra-low binding plate (Corning) to form suspended cell aggregates (spheroids). The media used and incubation times are given in the text. Cells were dissociated by pipetting, fixed in 4% PFA (paraformaldehyde), and analyzed by flow cytometry. The percentage of recipient cells that became positive for R-Ag or other probes used, which represents the probe transfer, was determined by FlowJo software with untreated recipient cells as the negative control. For constant etching, the etching buffer was added to the culture media at a 20-fold dilution from the short-duration etching concentration above. The efficacy in dissolving silver particles was demonstrated before and after incubation.
Preparation of peptide-coated silver and gold particles
Preparation of silver nanoparticles. 70 nm silver nanoparticles with PVP (polyvinylpyrrolidone) coating (AgNP-PVP) were prepared using a modification of a method to be reported elsewhere25. First, 0.375 g of AgNO3 (Sigma, Cat # 209139) and 1.5 g PVP (Sigma, Cat # 856568) were dissolved in 150 mL ethylene glycol (BDH, Cat # BDH1125). This mixture was then heated to 160 °C and the reaction proceeded for 1 h. The silver was cooled and precipitated in a large amount of acetone followed by centrifugation at 1000 × g for 10 min. The solution was decanted and the solids were redispersed in water with bath sonication. An aliquot may be dissolved in dilute PVP in water for UV-Vis characterization (the extinction coefficient is 1 × 10¹¹ M-1 cm-1).
Preparation of NA-OPSS. NeutrAvidin (NA, Thermo Scientific) was modified for silver and for gold nanoparticle coupling by appending 5 kDa NHS-PEG-OPSS (Jenkem), where OPSS is ortho-pyridyl disulfide. NA (25 mg) was dissolved in 5 mL glycerol/water solution (10%, v/v) for 1 h and then brought to 1× PBS. NHS-PEG-OPSS (6 mg) was dissolved in 0.5 mL glycerol/water for 15 sec then added to the NA solution. After 4-5 h, the NA-OPSS was dialyzed (20 kDa Slide-a-Lyzer, Pierce) against 0.1× PBS with 2 mM NaN3. The product was extracted, filtered (0.22 μm syringe filter, Millipore) and then assayed for OPSS content using reduction by TCEP (tris(2-carboxyethyl)phosphine, 0.5 M solution pH 7.0, Sigma). UV-Vis spectroscopy was used to determine an average of 2.2 PEG-OPSS were attached per NA tetramer, based on the extinction of neutravidin (1 mg mL-1 = 1.66 O.D. at 280 nm) and of OPSS leaving group (8080 M-1cm-1 at 343 nm). OPSS was reduced to liberate the chromophore leaving group using tris(2-carboxyethyl)phosphine (TCEP, Sigma). On average, 2.2 OPSS were bound per NA.
Preparation of Ag neutravidin nanoparticles (Ag-NA). First, NA-OPSS was added at 56 μg ml-1 final concentration to 25 mL of AgNP-PVP in water and incubated overnight, followed by centrifugation at 3,300 × g for 70 nm AgNP and resuspension of pellet into PBST (PBS plus 0.005% Tween 20). Second, lipoic PEG amine (MW=3400 g mol-1, Nanocs Inc.) was dissolved in 70% ethanol and added to the Ag-NA at a final concentration of 20 μM and incubated for 3 days at room temperature. After washing the particles in PBST, NA content was determined using biotin-4-fluorescein assay (Life Technologies, Cat # B-10570) to be 102-103 NA per particle. Third, NHS-dyes were added to Ag-NA solution at 40 μM final concentration, incubated overnight at 4 °C followed by extensive washing with PBST until supernatant was not fluorescent. Last, biotin labeled peptides were added at 40 μM for >1 h, then nanoparticles were washed with PBST. Peptides used here were biotin-X-RPARPAR-OH, biotin-X-GGSGAGNKRTR-OH (tLyP1), and biotin-X-{D}RKKRRQRRR-NH2 (D-TAT) (synthesized by Lifetein), where X indicates one copy of 6-amino-hexanoic linker.
Preparation of gold neutravidin nanoparticles (Au-NA). Gold (Au) citrate nanoparticle cores ∼50 nm diameter were synthesized using a citrate reduction method as described previously 62. Briefly, 90 mg HAuCl4:xH2O (Sigma) was added to 1200 mL of boiling water, followed by 94.1 mg of sodium citrate dihydrate (Sigma) dissolved in 8.25 mL water. The heat was immediately removed and the solution was kept stirring until room temperature. The resulting wine colored solution had an absorbance peak at 530 nm, and O.D. of 0.53 at 1 cm path length. To coat the Au citrate with NeutrAvidin, 2 mL of 3 mg/mL NA-OPSS solution was added to 500 mL of Au citrate while stirring at 37 °C. After briefly (30 s) bath sonicating (Aquasonic 50HT), 25 mL of 0.1 M MES pH 6.3 was added (2-(N-Morpholino)ethanesulfonic acid hemisodium salt, Sigma). Heating was continued for 1 h, then 50 mL of 10× PBS (at pH 6.75) was added, along with 250 μL 10% Tween 20 solution (Sigma), and 30 s of sonication. To purify Au-NA the solution was centrifuged at 12,200 ×g at 4°C and the pellet redispersed by sonication in 50 mL PBST (1× PBS with 0.005% Tween 20). To ensure complete reduction of OPSS groups onto the gold, TCEP 0.1 M 500 μL was added, followed by 30 min incubation at 37 °C. The gold surface was then passivated using lipoic-PEG-amine (250 μL 10 mM in 0.1 M TCEP) at 37 °C, followed by overnight at 4 °C. The Au-NA product was cleared from excess reagents at 10k ×g and redispersed in PBST 2 mM NaN3 and stored at 4 °C. Final absorbance was 33 O.D. at 534 nm peak plasmon resonance. Aliquots were dye labeled with NHS-CF555 dye (40 μM in DMSO, Biotium) and washed 3× with PBS-T. Peptides were loaded into the NA on the nanoparticles by adding 10 μL 2 mM biotin peptide per 500 μL Au-NA, washed 1 h later at 6,000 × g, redispersing in 1 mL PBST then 0.22 μm filtering (Millipore). All particle size were determined using TEM.
Synthesis of labeled neutravidin-RPARPAR (R-NA) conjugates
Neutravidin (NA) was conjugated with peptide through a reducible disulfide through the following steps. NA was dissolved at 5 mg/mL in 5% glycerol in water, then brought to 1× PBS using 10× PBS. CF555-NHS (Biotium) was dissolved in DMSO at 10 mM and added to the NA at 8.5-fold molar excess. Sodium bicarbonate (Gibco, 7.5%, Cat. #25080) was added to accelerate the reaction. After 3 h the solution was dialyzed (20 kDa Slide-a-Lyser, Pierce) overnight against 1× PBS with 2mM NaN3 with a buffer change. The product was filtered and determined to have 4 dye molecules per NA using extinction coefficients of 150,000 M-1 cm-1 at 555 nm and 40,000 M-1 cm-1 at 260 nm for the dye and NA, respectively. Next, the NA was loaded with N-(6-(Biotinamido)hexyl)-3′-(2′-pyridyldithio)propionamide (biotin-HPDP, Pierce, Cat # 21341). Biotin-HPDP has a disulfide bond and a thiol reactive pyridyl group to attach to cysteine. Biotin-HPDP was dissolved in DMSO and added to the NA-CF555 at 8.6 molar excess over NA (2.1 per biotin binding site). Dialysis was used to remove the excess biotin-HPDP. The thiol reactivity of NA-CF555-biot-HPDP was checked by adding L-cysteine (Sigma) to an aliquot and monitoring the appearance of HPDP leaving group absorbance at 343 nm. To load peptides the NA-CF555-biot-HPDP solution was added directly to lyophilized peptide FAM-Cys-x-RPARPAR-OH (synthesized in house), or reacted with dissolved L-cysteine as a control, with at least 10 molar excess cys to NA. These final conjugates were dialyzed (20 kDa) against 1× PBS and filtered.
Statistical analysis
Statistical differences between two data sets were determined via Student's t-test. All error bars indicate standard error of the mean (SEM). A value of P<0.05 was considered statistically significant.
Supplementary Material
Acknowledgments
We thank Drs. Marilyn G. Farquhar and Sumit Chanda for comments on the manuscript, Dr. Kun-Liang Guan for advice on nutrient regulation and Craig W. Vander Kooi for NRP1 b1b2 cDNA. This work was supported by grant CA152327 and Cancer Center Support grant CA30199 from the NCI. T.T is supported by Susan Komen for Cure Foundation career development award KG110704. G.B.B was supported by NIH T32 fellowship (CA121949).
Footnotes
Author contribution: H.B.P, G.B.B, T.F, K.N.S, T.T and E.R designed the experiments; H.B.P and P.A.B were responsible for screen design and optimization; H.B.P, P.A.B and M.E.R carried out the screen and analyzed the results; G.B.B. synthesized all peptide-carrier conjugates; H.B.P performed all other experiments. H.B.P and E.R wrote the manuscript.
NIH Author Disclaimer: The views and opinions of authors expressed on OER websites do not necessarily state or reflect those of the U.S. Government, and they may not be used for advertising or product endorsement purposes.
K.N.S, T.T and E.R have ownership interest (including patents) in CendR Therapeutics Inc. E.R is the founder, chairman of the board, consultant/advisory board member, and major shareholder of CendR Therapeutics Inc., and has ownership interest (including patents) in the same. ER is also a consultant/advisory board member, and major shareholder of EnduRx Pharmaceuticals Inc., and has ownership interest (including patents) in the same.
No potential conflicts of interest were disclosed by the other authors.
References
- 1.Nagy JA, Benjamin L, Zeng H, Dvorak AM, Dvorak HF. Vascular permeability, vascular hyperpermeability and angiogenesis. Angiogenesis. 2008;11:109–119. doi: 10.1007/s10456-008-9099-z. [DOI] [PMC free article] [PubMed] [Google Scholar]
- 2.Dvorak HF. Vascular permeability to plasma, plasma proteins, and cells: an update. Current opinion in hematology. 2010;17:225–229. doi: 10.1097/MOH.0b013e3283386638. [DOI] [PMC free article] [PubMed] [Google Scholar]
- 3.Teesalu T, Sugahara KN, Ruoslahti E. Tumor-penetrating peptides. Frontiers in oncology. 2013;3:216. doi: 10.3389/fonc.2013.00216. [DOI] [PMC free article] [PubMed] [Google Scholar]
- 4.Teesalu T, Sugahara KN, Kotamraju VR, Ruoslahti E. C-end rule peptides mediate neuropilin-1-dependent cell, vascular, and tissue penetration. Proceedings of the National Academy of Sciences of the United States of America. 2009;106:16157–16162. doi: 10.1073/pnas.0908201106. [DOI] [PMC free article] [PubMed] [Google Scholar]
- 5.Kolodkin AL, et al. Neuropilin is a semaphorin III receptor. Cell. 1997;90:753–762. doi: 10.1016/s0092-8674(00)80535-8. [DOI] [PubMed] [Google Scholar]
- 6.Ellis LM. The role of neuropilins in cancer. Molecular cancer therapeutics. 2006;5:1099–1107. doi: 10.1158/1535-7163.MCT-05-0538. [DOI] [PubMed] [Google Scholar]
- 7.Glinka Y, Prudhomme GJ. Neuropilin-1 is a receptor for transforming growth factor beta-1, activates its latent form, and promotes regulatory T cell activity. Journal of leukocyte biology. 2008;84:302–310. doi: 10.1189/jlb.0208090. [DOI] [PMC free article] [PubMed] [Google Scholar]
- 8.Bates DO, Harper SJ. Regulation of vascular permeability by vascular endothelial growth factors. Vascular pharmacology. 2002;39:225–237. doi: 10.1016/s1537-1891(03)00011-9. [DOI] [PubMed] [Google Scholar]
- 9.Nagy JA, Dvorak AM, Dvorak HF. VEGF-A and the induction of pathological angiogenesis. Annual review of pathology. 2007;2:251–275. doi: 10.1146/annurev.pathol.2.010506.134925. [DOI] [PubMed] [Google Scholar]
- 10.Becker PM, et al. Neuropilin-1 regulates vascular endothelial growth factor-mediated endothelial permeability. Circulation research. 2005;96:1257–1265. doi: 10.1161/01.RES.0000171756.13554.49. [DOI] [PubMed] [Google Scholar]
- 11.Shin TH, et al. Enhancement of the tumor penetration of monoclonal antibody by fusion of a neuropilin-targeting Peptide improves the antitumor efficacy. Molecular cancer therapeutics. 2014;13:651–661. doi: 10.1158/1535-7163.MCT-13-0748. [DOI] [PubMed] [Google Scholar]
- 12.Lanahan A, et al. The Neuropilin 1 Cytoplasmic Domain Is Required for VEGF-A-Dependent Arteriogenesis. Developmental cell. 2013;25:156–168. doi: 10.1016/j.devcel.2013.03.019. [DOI] [PMC free article] [PubMed] [Google Scholar]
- 13.Valdembri D, et al. Neuropilin-1/GIPC1 signaling regulates alpha5beta1 integrin traffic and function in endothelial cells. PLoS biology. 2009;7:e25. doi: 10.1371/journal.pbio.1000025. [DOI] [PMC free article] [PubMed] [Google Scholar]
- 14.Feng D, Nagy JA, Hipp J, Dvorak HF, Dvorak AM. Vesiculo-vacuolar organelles and the regulation of venule permeability to macromolecules by vascular permeability factor, histamine, and serotonin. The Journal of experimental medicine. 1996;183:1981–1986. doi: 10.1084/jem.183.5.1981. [DOI] [PMC free article] [PubMed] [Google Scholar]
- 15.Feng D, et al. Pathways of macromolecular extravasation across microvascular endothelium in response to VPF/VEGF and other vasoactive mediators. Microcirculation. 1999;6:23–44. [PubMed] [Google Scholar]
- 16.Roth L, et al. Transtumoral targeting enabled by a novel neuropilin-binding peptide. Oncogene. 2012;31:3754–3763. doi: 10.1038/onc.2011.537. [DOI] [PubMed] [Google Scholar]
- 17.Alberici L, et al. De novo design of a tumor-penetrating peptide. Cancer research. 2013;73:804–812. doi: 10.1158/0008-5472.CAN-12-1668. [DOI] [PMC free article] [PubMed] [Google Scholar]
- 18.Sugahara KN, et al. Tissue-penetrating delivery of compounds and nanoparticles into tumors. Cancer cell. 2009;16:510–520. doi: 10.1016/j.ccr.2009.10.013. [DOI] [PMC free article] [PubMed] [Google Scholar]
- 19.Sugahara KN, et al. Coadministration of a tumor-penetrating peptide enhances the efficacy of cancer drugs. Science. 2010;328:1031–1035. doi: 10.1126/science.1183057. [DOI] [PMC free article] [PubMed] [Google Scholar]
- 20.Gruenberg J. The endocytic pathway: a mosaic of domains. Nature reviews Molecular cell biology. 2001;2:721–730. doi: 10.1038/35096054. [DOI] [PubMed] [Google Scholar]
- 21.Marsh M, McMahon HT. The structural era of endocytosis. Science. 1999;285:215–220. doi: 10.1126/science.285.5425.215. [DOI] [PubMed] [Google Scholar]
- 22.Swanson JA, Watts C. Macropinocytosis. Trends in cell biology. 1995;5:424–428. doi: 10.1016/s0962-8924(00)89101-1. [DOI] [PubMed] [Google Scholar]
- 23.Anderson RG. The caveolae membrane system. Annual review of biochemistry. 1998;67:199–225. doi: 10.1146/annurev.biochem.67.1.199. [DOI] [PubMed] [Google Scholar]
- 24.Clague MJ. Molecular aspects of the endocytic pathway. The Biochemical journal. 1998;336(Pt 2):271–282. doi: 10.1042/bj3360271. [DOI] [PMC free article] [PubMed] [Google Scholar]
- 25.Braun GB, et al. Etchable plasmonic nanoparticle probes to image and quantify cellular internalization. Nat Materials. 2014 doi: 10.1038/nmat3982. in press. [DOI] [PMC free article] [PubMed] [Google Scholar]
- 26.Macia E, et al. Dynasore, a cell-permeable inhibitor of dynamin. Developmental cell. 2006;10:839–850. doi: 10.1016/j.devcel.2006.04.002. [DOI] [PubMed] [Google Scholar]
- 27.Schwartz SL, Cao C, Pylypenko O, Rak A, Wandinger-Ness A. Rab GTPases at a glance. Journal of cell science. 2007;120:3905–3910. doi: 10.1242/jcs.015909. [DOI] [PubMed] [Google Scholar]
- 28.Hay N, Sonenberg N. Upstream and downstream of mTOR. Genes & development. 2004;18:1926–1945. doi: 10.1101/gad.1212704. [DOI] [PubMed] [Google Scholar]
- 29.Laplante M, Sabatini DM. mTOR signaling in growth control and disease. Cell. 2012;149:274–293. doi: 10.1016/j.cell.2012.03.017. [DOI] [PMC free article] [PubMed] [Google Scholar]
- 30.Jewell JL, Guan KL. Nutrient signaling to mTOR and cell growth. Trends in biochemical sciences. 2013 doi: 10.1016/j.tibs.2013.01.004. [DOI] [PMC free article] [PubMed] [Google Scholar]
- 31.Choi YJ, et al. Inhibitory effect of mTOR activator MHY1485 on autophagy: suppression of lysosomal fusion. PloS one. 2012;7:e43418. doi: 10.1371/journal.pone.0043418. [DOI] [PMC free article] [PubMed] [Google Scholar]
- 32.Harding C, Heuser J, Stahl P. Receptor-mediated endocytosis of transferrin and recycling of the transferrin receptor in rat reticulocytes. The Journal of cell biology. 1983;97:329–339. doi: 10.1083/jcb.97.2.329. [DOI] [PMC free article] [PubMed] [Google Scholar]
- 33.Rejman J, Oberle V, Zuhorn IS, Hoekstra D. Size-dependent internalization of particles via the pathways of clathrin- and caveolae- mediated endocytosis. The Biochemical journal. 2004;377:159–169. doi: 10.1042/BJ20031253. [DOI] [PMC free article] [PubMed] [Google Scholar]
- 34.Kettler K, Veltman K, van de Meent D, van Wezel A, Hendriks AJ. Cellular uptake of nanoparticles as determined by particle properties, experimental conditions, and cell type. Environmental toxicology and chemistry/SETAC. 2014;33:481–492. doi: 10.1002/etc.2470. [DOI] [PubMed] [Google Scholar]
- 35.Mark A, et al. Characteristic mTOR activity in Hodgkin-lymphomas offers a potential therapeutic target in high risk disease--a combined tissue microarray, in vitro and in vivo study. BMC cancer. 2013;13:250. doi: 10.1186/1471-2407-13-250. [DOI] [PMC free article] [PubMed] [Google Scholar]
- 36.Heitz F, Morris MC, Divita G. Twenty years of cell-penetrating peptides: from molecular mechanisms to therapeutics. British journal of pharmacology. 2009;157:195–206. doi: 10.1111/j.1476-5381.2009.00057.x. [DOI] [PMC free article] [PubMed] [Google Scholar]
- 37.Collinet C, et al. Systems survey of endocytosis by multiparametric image analysis. Nature. 2010;464:243–249. doi: 10.1038/nature08779. [DOI] [PubMed] [Google Scholar]
- 38.Commisso C, et al. Macropinocytosis of protein is an amino acid supply route in Ras-transformed cells. Nature. 2013;497:633–637. doi: 10.1038/nature12138. [DOI] [PMC free article] [PubMed] [Google Scholar]
- 39.Lampugnani MG, Orsenigo F, Gagliani MC, Tacchetti C, Dejana E. Vascular endothelial cadherin controls VEGFR-2 internalization and signaling from intracellular compartments. The Journal of cell biology. 2006;174:593–604. doi: 10.1083/jcb.200602080. [DOI] [PMC free article] [PubMed] [Google Scholar]
- 40.Salikhova A, et al. Vascular endothelial growth factor and semaphorin induce neuropilin-1 endocytosis via separate pathways. Circulation research. 2008;103:e71–79. doi: 10.1161/CIRCRESAHA.108.183327. [DOI] [PMC free article] [PubMed] [Google Scholar]
- 41.Cai H, Reed RR. Cloning and characterization of neuropilin-1-interacting protein: a PSD-95/Dlg/ZO-1 domain-containing protein that interacts with the cytoplasmic domain of neuropilin-1. The Journal of neuroscience: the official journal of the Society for Neuroscience. 1999;19:6519–6527. doi: 10.1523/JNEUROSCI.19-15-06519.1999. [DOI] [PMC free article] [PubMed] [Google Scholar]
- 42.Gao Y, Li M, Chen W, Simons M. Synectin, syndecan-4 cytoplasmic domain binding PDZ protein, inhibits cell migration. Journal of cellular physiology. 2000;184:373–379. doi: 10.1002/1097-4652(200009)184:3<373::AID-JCP12>3.0.CO;2-I. [DOI] [PubMed] [Google Scholar]
- 43.Kato H, Ohno K, Hashimoto K, Sato K. Synectin in the nervous system: expression pattern and potential as a binding partner of neurotrophin receptors. FEBS letters. 2004;572:123–128. doi: 10.1016/j.febslet.2004.07.017. [DOI] [PubMed] [Google Scholar]
- 44.Lou X, Yano H, Lee F, Chao MV, Farquhar MG. GIPC and GAIP form a complex with TrkA: a putative link between G protein and receptor tyrosine kinase pathways. Molecular biology of the cell. 2001;12:615–627. doi: 10.1091/mbc.12.3.615. [DOI] [PMC free article] [PubMed] [Google Scholar]
- 45.El Mourabit H, et al. The PDZ domain of TIP-2/GIPC interacts with the C-terminus of the integrin alpha5 and alpha6 subunits. Matrix biology: journal of the International Society for Matrix Biology. 2002;21:207–214. doi: 10.1016/s0945-053x(01)00198-6. [DOI] [PubMed] [Google Scholar]
- 46.Lou X, McQuistan T, Orlando RA, Farquhar MG. GAIP, GIPC and Galphai3 are concentrated in endocytic compartments of proximal tubule cells: putative role in regulating megalins function. Journal of the American Society of Nephrology :JASN. 2002;13:918–927. doi: 10.1681/ASN.V134918. [DOI] [PubMed] [Google Scholar]
- 47.Naccache SN, Hasson T, Horowitz A. Binding of internalized receptors to the PDZ domain of GIPC/synectin recruits myosin VI to endocytic vesicles. Proceedings of the National Academy of Sciences of the United States of America. 2006;103:12735–12740. doi: 10.1073/pnas.0605317103. [DOI] [PMC free article] [PubMed] [Google Scholar]
- 48.De Vries L, Lou X, Zhao G, Zheng B, Farquhar MG. GIPC, a PDZ domain containing protein, interacts specifically with the C terminus of RGS-GAIP. Proceedings of the National Academy of Sciences of the United States of America. 1998;95:12340–12345. doi: 10.1073/pnas.95.21.12340. [DOI] [PMC free article] [PubMed] [Google Scholar]
- 49.Rossignol M, Pouyssegur J, Klagsbrun M. Characterization of the neuropilin-1 promoter; gene expression is mediated by the transcription factor Sp1. Journal of cellular biochemistry. 2003;88:744–757. doi: 10.1002/jcb.10384. [DOI] [PubMed] [Google Scholar]
- 50.Mireuta M, Darnel A, Pollak M. IGFBP-2 expression in MCF-7 cells is regulated by the PI3K/AKT/mTOR pathway through Sp1-induced increase in transcription. Growth Factors. 2010;28:243–255. doi: 10.3109/08977191003745472. [DOI] [PubMed] [Google Scholar]
- 51.Astrinidis A, et al. The transcription factor SP1 regulates centriole function and chromosomal stability through a functional interaction with the mammalian target of rapamycin/raptor complex. Genes, chromosomes & cancer. 2010;49:282–297. doi: 10.1002/gcc.20739. [DOI] [PubMed] [Google Scholar]
- 52.Laakkonen P, et al. Antitumor activity of a homing peptide that targets tumor lymphatics and tumor cells. Proceedings of the National Academy of Sciences of the United States of America. 2004;101:9381–9386. doi: 10.1073/pnas.0403317101. [DOI] [PMC free article] [PubMed] [Google Scholar]
- 53.Agemy L, et al. Targeted nanoparticle enhanced proapoptotic peptide as potential therapy for glioblastoma. Proceedings of the National Academy of Sciences of the United States of America. 2011;108:17450–17455. doi: 10.1073/pnas.1114518108. [DOI] [PMC free article] [PubMed] [Google Scholar]
- 54.Zhang L, Hoffman JA, Ruoslahti E. Molecular profiling of heart endothelial cells. Circulation. 2005;112:1601–1611. doi: 10.1161/CIRCULATIONAHA104.529537. [DOI] [PubMed] [Google Scholar]
- 55.Vander Kooi CW, et al. Structural basis for ligand and heparin binding to neuropilin B domains. Proceedings of the National Academy of Sciences of the United States of America. 2007;104:6152–6157. doi: 10.1073/pnas.0700043104. [DOI] [PMC free article] [PubMed] [Google Scholar]
- 56.Kim J, et al. Functional genomic screen for modulators of ciliogenesis and cilium length. Nature. 2010;464:1048–1051. doi: 10.1038/nature08895. [DOI] [PMC free article] [PubMed] [Google Scholar]
- 57.Birmingham A, et al. Statistical methods for analysis of high-throughput RNA interference screens. Nature methods. 2009;6:569–575. doi: 10.1038/nmeth.1351. [DOI] [PMC free article] [PubMed] [Google Scholar]
- 58.Zhang JH, Chung TD, Oldenburg KR. A Simple Statistical Parameter for Use in Evaluation Validation of High Throughput Screening Assays. Journal of biomolecular screening. 1999;4:67–73. doi: 10.1177/108705719900400206. [DOI] [PubMed] [Google Scholar]
- 59.Hennings L, et al. Dead or alive? Autofluorescence distinguishes heat-fixed from viable cells. International journal of hyperthermia : the official journal of European Society for Hyperthermic Oncology, North American Hyperthermia Group. 2009;25:355–363. doi: 10.1080/02656730902964357. [DOI] [PMC free article] [PubMed] [Google Scholar]
- 60.Rasband WS. U.S. National Institutes of Health; Bethesda, Maryland, USA: 1997-2012. ImageJ. http://imagej.nih.gov/ij/ [Google Scholar]
- 61.Haimes J, Kelley M. Demonstration of a ΔΔCq Calculation Method to Compute Thermo Scientific Relative Gene Expression from qPCR Data. http://www.thermoscientificbio.com/uploadedfiles/resources/tech-note-demonstration-of-a-cq-calculation-method-using-solaris-qpcr-assays.pdf.
- 62.Chithrani BD, Ghazani AA, Chan WC. Determining the size and shape dependence of gold nanoparticle uptake into mammalian cells. Nano letters. 2006;6:662–668. doi: 10.1021/nl052396o. [DOI] [PubMed] [Google Scholar]
Associated Data
This section collects any data citations, data availability statements, or supplementary materials included in this article.