Summary
The varied topography of human skin offers a unique opportunity to study how the body’s microenvironments influence the functional and taxonomic composition of microbial communities. Phylogenetic marker gene-based studies have identified many bacteria and fungi that colonize distinct skin niches. Here, metagenomic analyses of diverse body sites in healthy humans demonstrate that local biogeography and strong individuality define the skin microbiome. We developed a relational analysis of bacterial, fungal, and viral communities, which showed not only site-specificity but also individual signatures. We further identified strain-level variation of dominant species as heterogeneous and multiphyletic. Reference-free analyses captured the uncharacterized metagenome through the development of a multi-kingdom gene catalog, which was used to uncover genetic signatures of species lacking reference genomes. This work is foundational for human disease studies investigating inter-kingdom interactions, metabolic changes, and strain tracking and defines the dual influence of biogeography and individuality on microbial composition and function.
Human skin harbors an abundant microbial ecosystem with bidirectional metabolic exchanges supporting symbiotic and commensal processes. The skin’s surface consists of diverse microenvironments with distinct pH, temperature, moisture, sebum content, and topography1. These niche-specific physiologic differences influence the resident bacteria2,3 and fungi4; oily surfaces like the forehead support lipophilic bacteria that differ from dry, low biomass sites like the forearm. In turn, microbial sensing and signaling mechanisms, metabolic pathways, or immunogenic features likely exhibit site-specificity to sustain host interactions. Similar to the distribution of skin microbes, skin disorders often present in a site-specific manner, such as atopic dermatitis (eczema) in arm and leg creases or psoriasis on the elbows and knees. Inter-kingdom and inter-species microbial interactions may exacerbate disease severity5 or facilitate transitions from opportunistic to pathogenic. While skin physiology is a dominant force, individuals retain unique elements of microbial profile and community organization. Here, we explore the complex skin microbial biogeography, integrating broad physiologic characteristics with individual discriminatory attributes.
Studies based on phylogenetic marker genes (e.g., bacterial 16S rRNA gene or fungal internal transcribed spacer (ITS) regions) have studied core taxonomic characteristics of different skin sites and disease states. However, such approaches survey kingdoms in isolation and provide limited information into an ecosystem’s functionality. Metagenomic shotgun sequencing interrogates the full complement of DNA present in a sample, enabling characterization of both a community’s functional capacity and genomes for which no targeted amplicon strategies exist. Several large-scale studies have used metagenomics to examine bacterial or viral communities of the healthy gut and other body sites6–8, or taxonomic and functional differences in type 2 diabetes9,10. To date, a systematic metagenomic investigation of human skin is lacking. The physiologic heterogeneity and variable microbial biomass of the skin pose unique technical and analytical challenges for metagenomic studies. Each site on the human skin is constrained by ecological properties such as host microenvironment, yet possesses a distinct biogeography that significantly influences microbial diversity, composition, and biomass2–4,11.
We present the first systematic, multi-site metagenomic study of human skin. We determined the composition and function of the healthy skin microbiome using direct shotgun sequencing of 15 individuals at 18 clinically relevant sites, which included diverse skin microenvironments (dry, moist, sebaceous, or toenail, Extended Data Fig. 1). Our dual approach incorporated reference-based and reference-free methods to characterize the metagenome. We present new insights into the larger community of skin microorganisms, including DNA viruses, lower eukaryotes, bacteria, and subspecies of dominant bacteria. We defined how functional capacity varies by body site and created a multi-kingdom, skin-associated gene catalog. Using new analytic approaches, we identified metagenomic ‘clusters’ representing species without known references. Our study demonstrates that biogeography and individuality significantly shape a community’s functional and taxonomic characteristics and provides a framework for human studies investigating inter-kingdom interactions, metabolic changes, and pathogen expansion in disease.
Skin sampling and data characteristics
263 specimens were collected from 15 healthy adults (9 males, 6 females) from 18 defined anatomical skin sites (Supplementary Table 1). We modified previous clinical sample acquisition, DNA isolation, and library preparation to generate shotgun metagenomic sequence data from skin sites, which varied in biomass and composition. For example, human-derived DNA accounted for 19.4±6.7% to 98.2±0.1% of reads, reflecting the difference between stratified, cornified plantar heel skin and nucleated inner nostril epithelium, respectively (Extended Data Fig. 2a). Microbial sequencing yields and estimated coverage also varied with skin physiologic features (‘microenvironment’), such that low-diversity, higher-biomass sebaceous sites generally achieving greater coverage (maximum 81.0±7.0%) than high-diversity, lower-biomass dry or moist sites (minimum 38.0±5.7%, Extended Data Fig. 2c). We obtained a total of 289 Gbp of non-human, quality filtered Illumina microbial sequence reads (Extended Data Fig. 2a–c, Supplementary Table 1).
Phylogenetic profiles of skin microbes
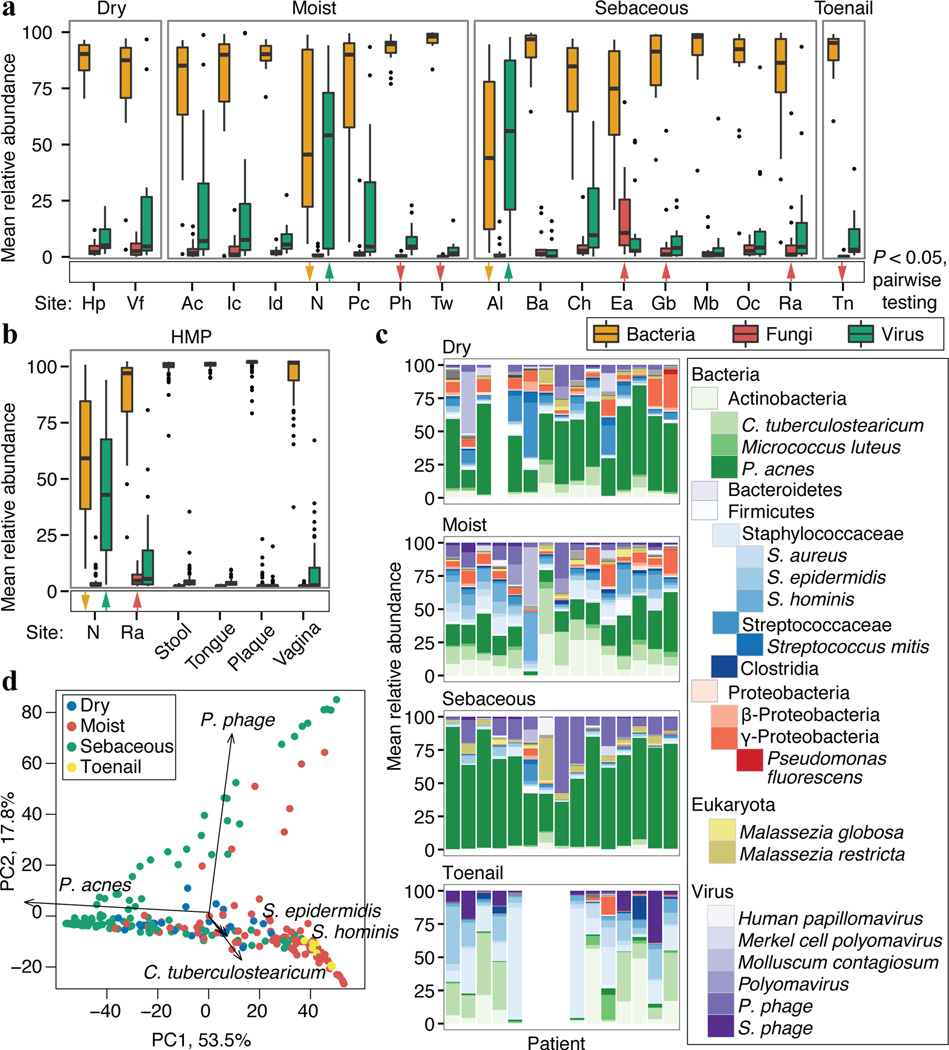
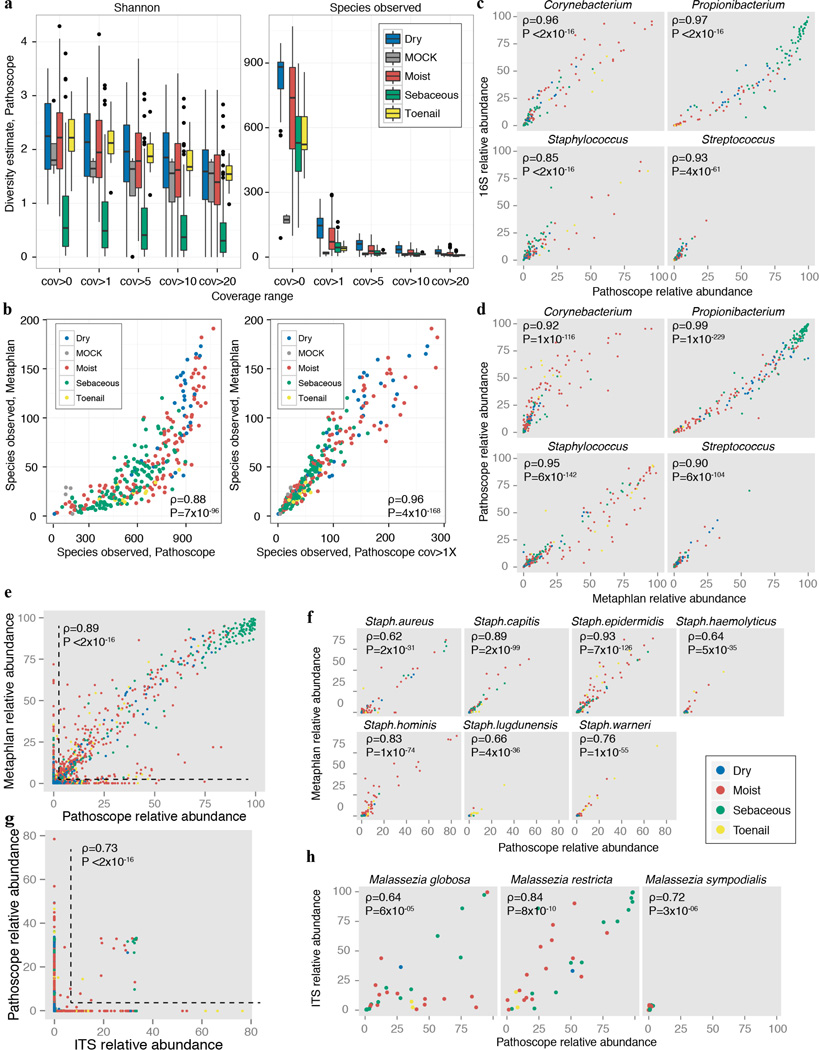
To explore the relative abundances of skin microbiota across kingdoms, we performed a relational analysis mapping filtered reads to 2342 bacterial, 389 fungal, 1375 viral, and 67 archaeal genomes. To validate taxonomic assignments, we compared our metagenomic data with 16S and ITS sequencing of the same samples, which showed high concordance (Extended Data Fig. 3, Supplementary Tables 2–4). While recognizing that fungal and viral genomes are more sparsely represented in reference databases, bacteria predominated at most sites (Fig. 1a–c, Extended Data Fig. 1, 4a, Supplementary Table 6) and comprised the bulk of phylogenetic diversity with fungi and viruses contributing relatively fewer species. Fungi, primarily Malassezia (M.) globosa and M. restricta, were a lower fraction (3.9±5.0%), except near the ears and forehead, which had a higher fungal presence (external auditory canal, 16.8±5.1%; retroauricular crease 7.5±4.2%; glabella 7.1±4.0%). The feet had low fungal representation (plantar heel, 0.7±0.2%; toenail 0.5±0.3%; toeweb 0.3±0.1%), despite high diversity observed in amplicon-based studies. Archaea were nearly absent on skin, but DNA viruses were abundant at specific sites, with marked interpersonal variation. Note, RNA viruses are not interrogated by these methods and likely represent uncharacterized diversity. The nares and adjacent alar crease showed significant viral representation (51.0±11.8% and 54.6±9.3%), compared to 9.9±1.0% at other sites. Interestingly, a few individuals had sites that were dominated by viruses (up to 96%). These ‘blooms’ contained Propionibacterium (P.) or Staphylococcus (S.) phage and/or human viral pathogens (Molluscum contagiosum, human papillomavirus, and Merkel cell polyomavirus), although skin sites were free of clinical lesions. Communities were shaped primarily by microenvironment in which differential abundance of stereotypical taxa such as P. acnes, commensal staphylococci, Corynebacterium, and P. phage contributed most significantly to variation both between and within individuals (Fig. 1d).
Figure 1.
Multi-kingdom relative abundances are strongly shaped by skin microenvironment. a, Boxplots of mean relative abundance of different kingdoms by site; see Extended Data Fig. 1 for site codes. Black lines indicate median; boxes first and third quartiles. Triangles indicate significance (adjusted P < 0.05, Kruskal-Wallis post-hoc test) for over- (up) or under- (down) representation in a majority of pairwise comparisons between sites. b, Kingdoms in HMP body sites. c, Consensus relative abundance plots of major skin taxa by microenvironment. d, Communities cluster primarily by microenvironment with sebaceous regions most distinct in principal components (PC) analysis. Propionibacterium (P.), Staphylococcus (S.), Corynebacterium (C.).
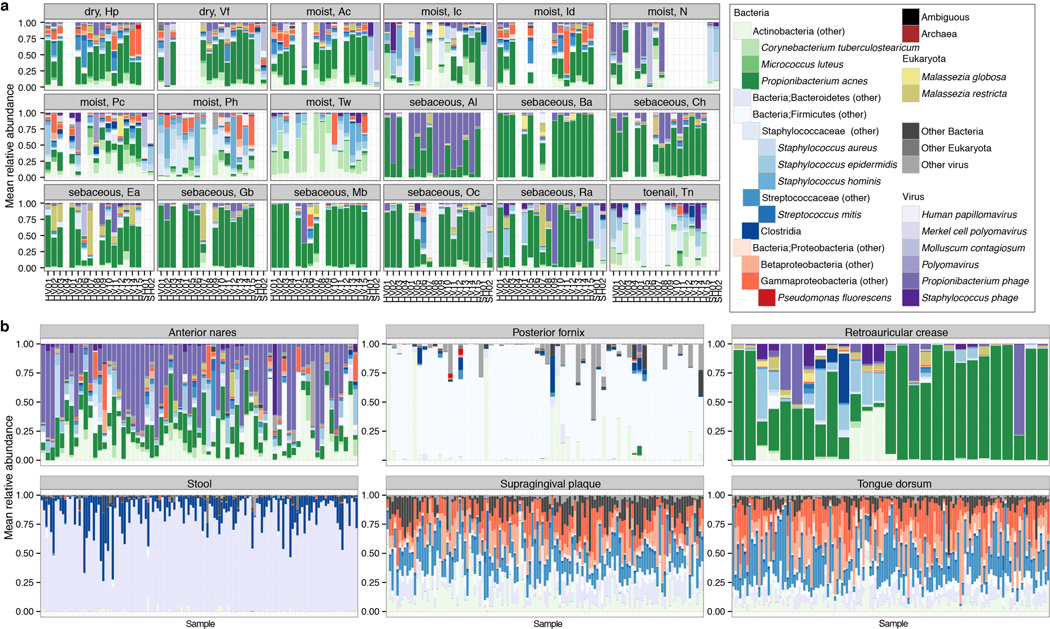
To compare skin with other body sites, we analyzed 552 Human Microbiome Project (HMP) metagenomic samples obtained from anterior nares, posterior fornix (vagina), retroauricular crease, stool, supragingival plaque, and tongue dorsum (Fig. 1b, Extended Data Fig. 4b, Supplementary Table 6–7)12. Our skin samples were similar to the HMP’s in community membership and structure of all kingdoms (P > 0.05). However, retroauricular crease samples from our study had greater fungal abundance than HMP (7.5% vs. 3.4%), likely reflecting differences in nucleic acid extraction techniques, which we optimized to recover fungal DNA. Fungi were relatively scarce at non-skin sites. Similar to skin sites with phage co-occurring with their host bacteria, Lactobacillus phage was observed in the posterior fornix with marked interpersonal variation. Viruses were low abundance in the mouth, but Streptococcus phage was universal, present in 99.2% of samples (mean abundance 1.2±0.1%). Overall, the human body is rich in both bacterial and non-bacterial taxa, with site-specific fungal enrichment and viral blooms.
Individuality underlies biogeography
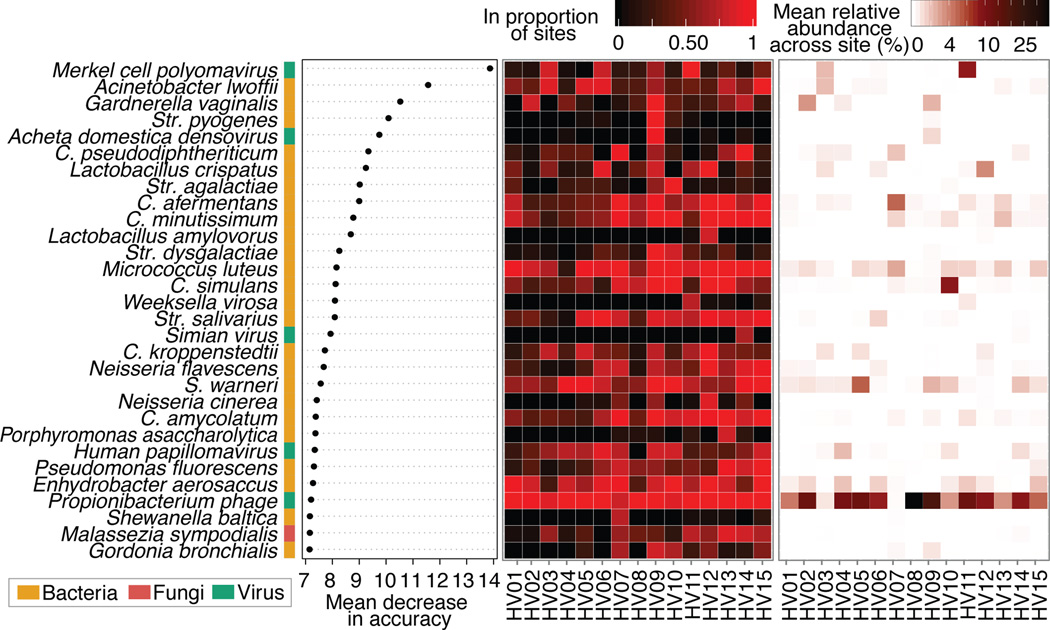
Differential manifestations of phenotypes including disease susceptibility, antibiotic response, drug metabolism, or even weight gain are likely influenced by an individual’s exclusive microbial community features. We explored whether we could classify individuals based on unique taxonomic signatures across their body. We used random forests, which incorporates interactions of both rare and abundant taxa, to identify key taxa that might differentiate individuals (Supplementary Table 8). Surprisingly, low-abundance taxa shared across skin sites discriminated individuals (Fig. 2). For example, the strongest discriminatory feature was Merkel cell polyomavirus, present in low abundance at all skin sites within one individual, regardless of site. Several taxa could also be discriminatory on an individual level; Gardnerella vaginalis and Streptococcus pyogenes were host-specific across all skin sites in addition to taxa that likely represent transient populations (e.g., Acheta domesticus densovirus).
Figure 2.
Individual-specific signatures are typically low abundance but shared across most sites. Left, variable importance plot of most discriminatory taxa from random forests analysis. For each individual, center: proportion of the 18 sites in which each taxa is present, and right: mean relative abundance of that taxa across sites. Streptococcus (Str.)
With our multi-kingdom taxonomy, we could differentiate our 15 individuals with >80% accuracy (19.3% error). The increased error estimates based upon kingdom-specific analyses (21.8%, bacteria; 74%, fungi; 41.2%, viruses) underscores the importance of understanding the full phylogenetic diversity of a community. Such approaches are relevant in identifying discriminatory features in disease states or assessing longitudinal community stability in which individuals may be identifiable by microbial features. While site-specificity serves as an overarching constraint on community composition, we observed a remarkable range of individual signatures within the skin biogeography.
Strain heterogeneity in skin symbionts
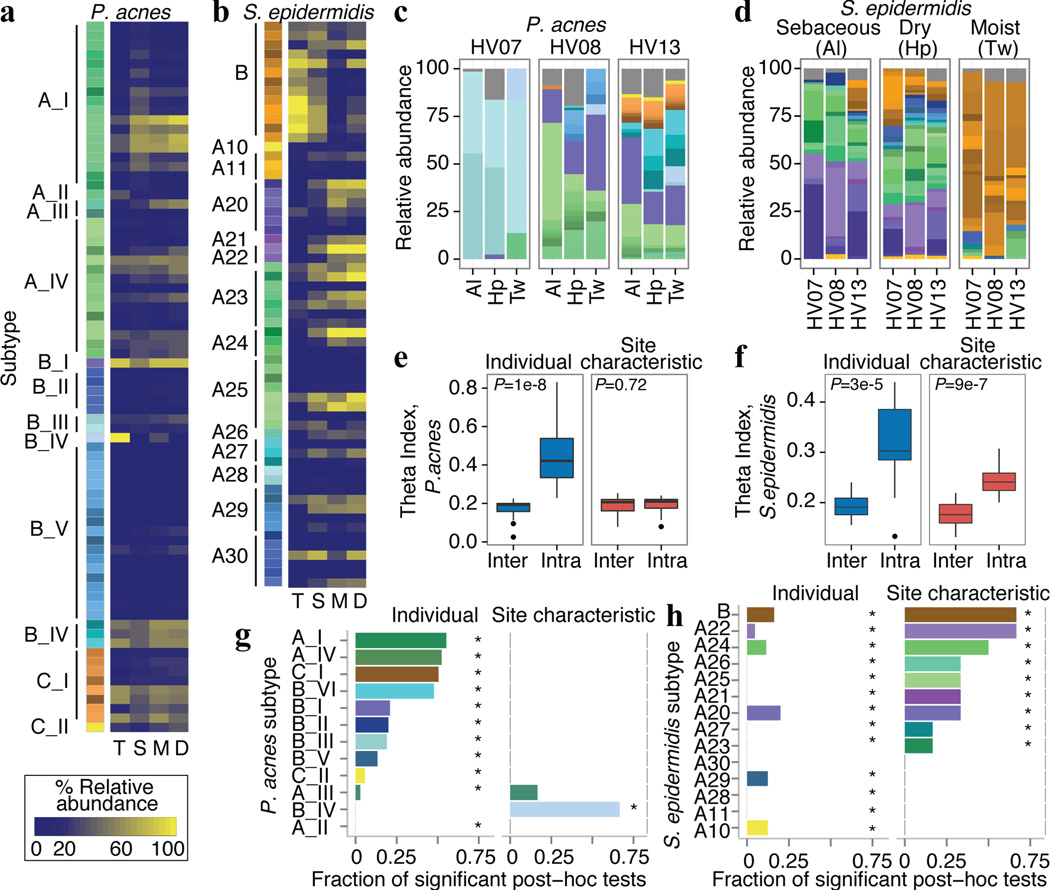
We further explored individual signatures by examining strain-level variation; substrains within a clade can possess different properties of transmissibility, virulence, antibiotic resistance, or metabolism14. To investigate strain-level heterogeneity, we focused on two common skin commensals with well-documented sequence variation, P. acnes and S. epidermidis. Using a reference-based approach that leveraged both single nucleotide polymorphisms and larger variants (Extended Data Fig. 5, Supplementary Table 2, –10), we identified phylogenetically ‘most similar’ strains based on differentiating genomic features. To reduce false discovery, we characterized both strain and a more conservative subtype level that represents phylogenetically similar strain groups (Fig. 3a–b, Extended Data Fig. 5–6).
Figure 3.
Propionibacterium acnes and Staphylococcus epidermidis are heterogeneous and multiphyletic at the strain level. a, b, Reference genomes used for a, P. acnes and b, S. epidermidis. Leftmost bar shows subtypes (phylogenetically similar genomes) as color groups. Adjacent heatmap shows mean relative abundance by skin microenvironment. Dry (D), moist (M), sebaceous (S), toenail (T). c, d, Select relative abundance plots; strain colors as in a–b. e, f, P. acnes subtypes differ more significantly between individuals than skin microenvironment with the converse observed for S. epidermidis. Boxplots of Yue-Clayton theta indices calculate similarity between (‘inter’) or within (‘intra’) individuals/microenvironments (θ=1: identical). Black lines indicate median; boxes first and third quartiles. P-value, Wilcoxon rank-sum test. g, h, Barcharts show P. acnes and S. epidermidis subtypes that differ by microenvironment or individual. Length of bar represents the fraction of post-hoc tests significant for each comparison; 105 comparisons for individual; 6 for microenvironment. *P < 0.05, adjusted Kruskal-Wallis test.
Given the extensive strain-level diversity observed for both species, our results suggest that individual and microenvironment differentially shape subspecies variation. P. acnes strains were more individual- than site-specific (Fig. 3c, e); 11/12 P. acnes subtypes were differentially abundant between individuals while only 1 differed between microenvironments (Fig. 3g). In contrast, S. epidermidis strains were significantly more site-driven with diminished inter-individual variation (Fig. 3d, f); nearly all subtypes were differentially abundant between sites (Fig. 3h) with subtype ‘B’ particularly dominant in the foot and toenail (Fig. 3b). These results strongly suggest that P. acnes and S. epidermidis communities are heterogeneous and multiphyletic, properties that likely vary by species and niche. Further analyses of this resolution will be powerful in determining genetic variation across time, topography, and disease. In summary, our systematic analysis of microbial community composition has described a remarkable dynamism spanning inter-kingdom partnerships down to sub-species variability, characteristics that are driven both by broad ecological constraints and an individual’s unique carriage.
Biogeography shapes functional diversity
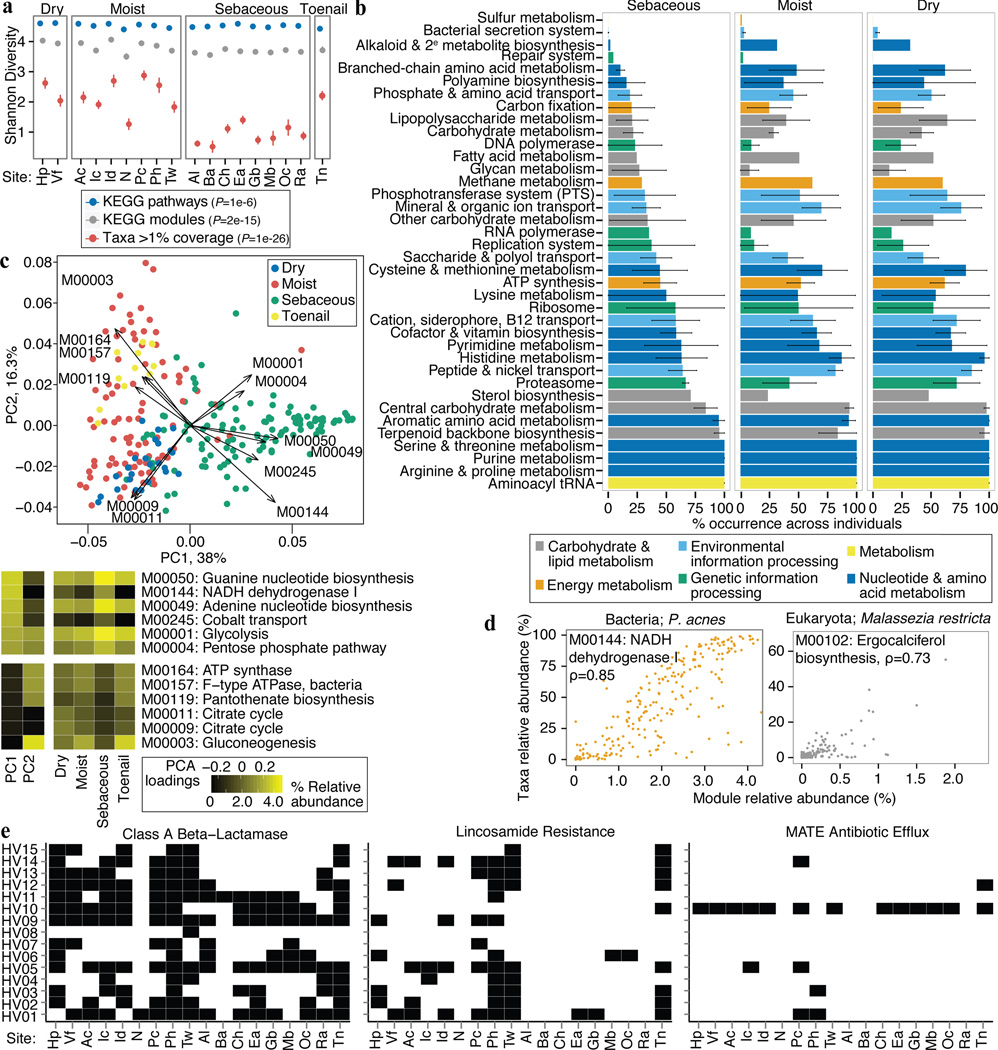
While taxonomy yields important insight into community organization, metagenomics also enables analysis of a community’s collective functional potential. While previous studies reported that most metabolic pathways are evenly distributed across body sites12, we observed a modest decrease in metabolic diversity that occurred in tandem with lower taxonomic diversity in sebaceous sites (Fig. 4a). Investigating this concept of core functionality, we determined that only 30% (44/148) of modules were “core” irrespective of site (present in ≥2/3 samples), representing processes essential to microbial growth and metabolism (Extended Data Fig. 7, Supplementary Tables 13–15). Extensive variability was observed within subclasses of major pathways, particularly transport systems (sulfate, glutamate, aspartame, L- or branched amino acids and sorbitol) and putrecine/spermidine biosynthesis and transport, which were typically absent in sebaceous regions, attesting to the chemical diversity likely present at higher-complexity sites. Conversely, most eukaryotic pathways were more prevalent in sebaceous sites (cell cycle, DNA replication, transcription, translation, protein degradation, and vitamin D2 biosynthesis, a fungi-produced phytonutrient). Thus, while a strong functional core exists, this core metagenome can vary tremendously, reflecting functional diversification of skin microenvironments. Future studies with transcriptional profiling will likely reveal additional functional variance in vivo.
Figure 4.
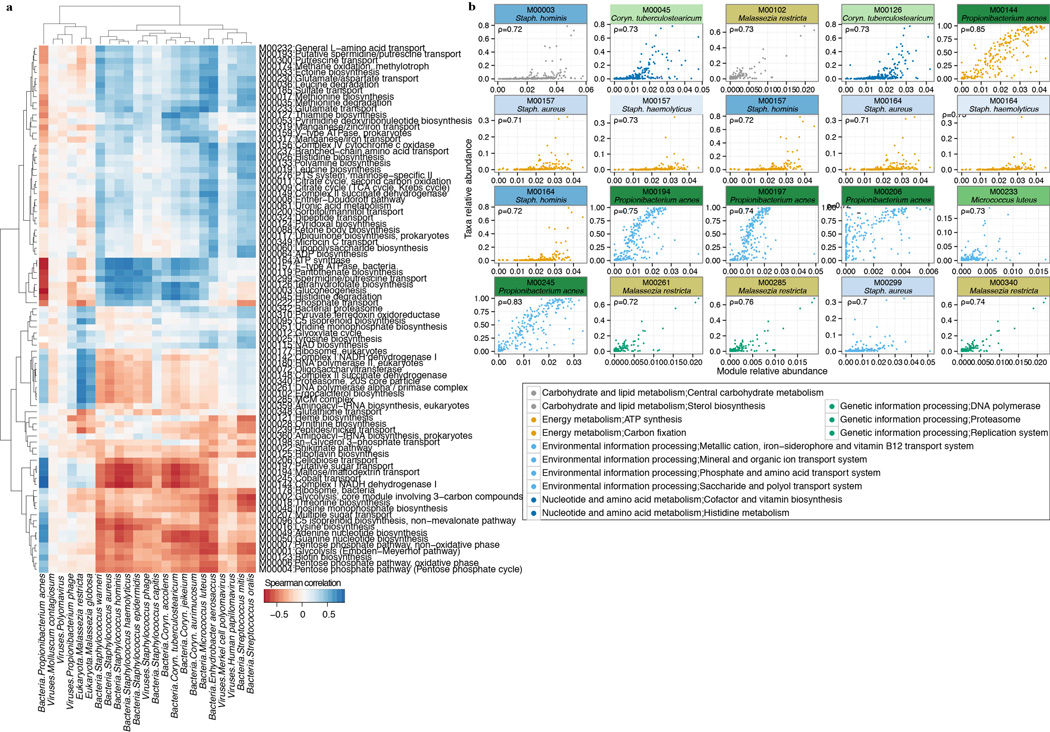
Functional capacity varies by microenvironment. a, Shannon diversity of functional pathways and taxonomy by site; P-value, Kruskal-Wallis test between microenvironments. Error bars: standard error of the mean. b, Microenvironments possess different core modules; ‘core’ = occurrence in > 2/3 of samples. Error bars show variation within a class of modules (full version in Extended Data) that may arise from a unique specialization for that microenvironment. c, PCA shows clustering by microenvironment, with strong separation of sebaceous, dry, and toenail modules. Heatmaps: left, loadings for the first two PCs; right, mean relative abundances for modules with the greatest variation by microenvironment. d, A module’s taxonomic origin can be imputed by Spearman correlation (ρ; adjusted P ≤ 2e-16) with P. acnes and M. restricta relative abundances. e, Presence of select antibiotic resistance gene families by individual and site.
Modules present across all sites were typically low abundance and associated with uncharacterized biomolecular functions and metabolism (Supplementary Table 14). 88% of modules were differentially abundant in at least one microenvironment (adjusted P < 0.05, Supplementary Table 13, 15), suggesting that functional capacity is driven primarily by biogeography. Principal components identified modules that discriminate microenvironments (Fig. 4c). Sebaceous sites (PC1) are distinguished by overrepresentation of glycolysis and related components (ATP and GTP generation) and NADH dehydrogenase I. Toenail samples differed primarily by the presence of different energy production components, such as conversion of oxaloacetate to fructose-6P, and ATPase and ATP synthase. Dry sites were characterized by the presence of citrate cycle modules. Covariance analysis imputing pathway abundance to select species suggested that P. acnes and M. restricta are likely candidates to drive some niche-specific metabolism, given their abundance in sebaceous sites (Fig. 4d, Extended Data Fig 8).
With increasing concerns of antibiotic-resistant microorganisms, we explored the reservoir of antibiotic resistance genes in the skin. While skin is physically compartmentalized from other body sites, cross-inoculation remains a risk factor. For example, the nares can harbor methicillin-resistant Staphylococcus aureus (MRSA)15 underlying skin and soft tissue infections. Strain crosstalk between oral, lung, and skin sites may underlie recurrent infections in immunocompromised patients16. Here, we identified presence/absence of well-characterized resistance gene families as pioneered for the gut17 and soil18. We observed significant variability across individuals and resistance types (Extended Data Fig. 9, Supplementary Table 16). Certain antibiotic classes were highly host-specific, such as multi-antimicrobial extrusion (MATE) efflux pumps (Fig. 4e). In an example of site-specific dominance, lincosamide resistance showed significant representation in three foot sites but was generally absent in sebaceous regions. Finally, certain families were broadly represented across samples, such as class A beta-lactamases, rRNA methyltransferases, efflux mechanisms, or quinolone resistance. Thus, carriage of antibiotic resistance families demonstrated both site- and individual-specificity, although we note that resistance activity may differ in vivo.
Insights into microbial dark matter
Our reference-based analysis showed a large variable fraction of reads (2–96%) unmapped to reference genomes, most frequently originating from decreased bacterial assignments (Supplementary Table 6, Extended Data Fig. 10a). Such uncharacterized sequences likely originate from both taxa with no representative reference and intraspecies pangenomic variation, which can represent significant gene content14. Using reference-free methods to capture this ‘dark matter’ of the skin metagenome, we created a skin gene catalog that we then used to identify previously uncharacterized taxa in the skin. Such resources will be invaluable for downstream analyses, enabling in silico prediction and synthesis of genes and pathways that are over- or underrepresented in, for example, disease states.
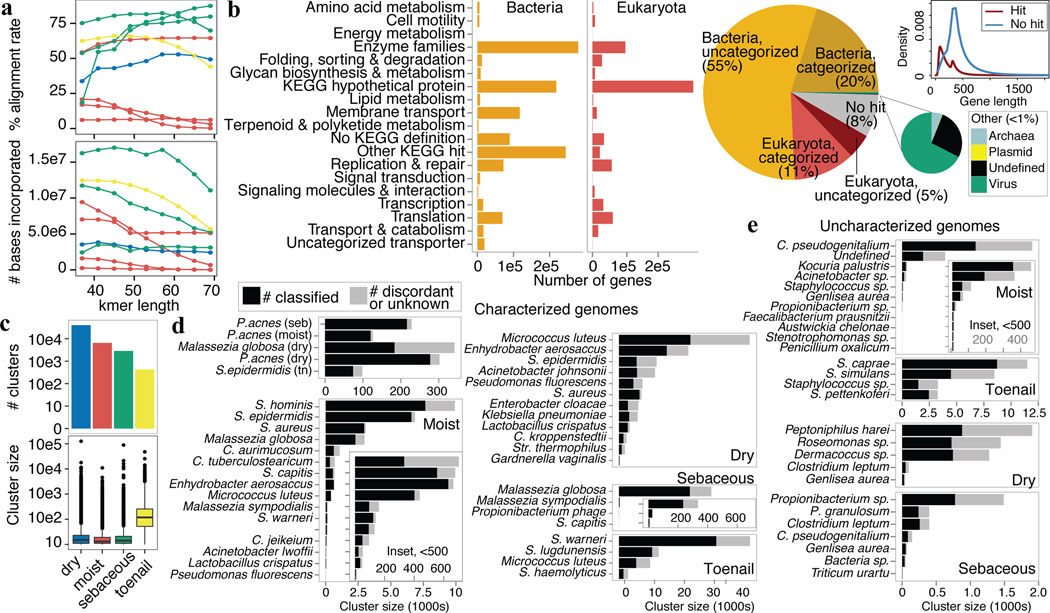
The inherent variation in skin community complexity and human DNA admixture presents new challenges in reference-free methodologies; variable microbial load and taxonomic diversity across sites affect sequencing depth and coverage. To account for this variability, we devised an adaptive and iterative strategy (Extended Data Fig. 10b–c) that optimizes assembly on a per-sample basis (Fig. 5a, Supplementary Table S17). We then established the first multi-kingdom skin microbial gene catalog using both fungal and bacterial prediction models. Of 5.92 million open reading frames (ORFs), 75.7% could be reconstructed as bacterial and 15.9% as eukaryotic, consistent with our taxonomic analyses (Fig. 5b). Large numbers of KEGG hypothetical genes (25.7% of bacterial, 48.3% of eukaryotic) likely represent pangenomic loci of characterized taxonomies, e.g., P. acnes and M. globosa, based on association without pathway annotation. In support of their authenticity, ORFs with no identifiable homologs (7.9%) were typically longer than classified ORFs (Fig. 5b, inset). <1% of ORFs were assigned to Archaea and viruses (which require unique prediction models), possibly reflecting integrative viruses or overlap in gene prediction models.
Figure 5.
Reconstruction of metagenomic dark matter with reference-free methods. a, Per-sample iterative assembly with variable kmers optimizes assembly quality as assessed by % reads mapping back to assembly (left) and the number of bases incorporated (right). b, Skin gene catalog was mapped to nr and KEGG to identify kingdom and functional category. Density plot compares length of genes with and without homology; gene length was typically larger for unmapped genes. c, Metagenomic clusters represent genes that covary in abundance across samples within a microenvironment; boxplots show cluster sizes; histograms show number of clusters (log10 scale). d, A lowest common ancestor (LCA) was assigned to a cluster with >50% consensus taxonomy. Bar length indicates the total number of ‘genes’ in a cluster; black represents the number of genes mapping to the LCA. Gray represents ambiguous or unannotated genes. “Characterized” indicates that a reference genome exists for that species; for e, “Uncharacterized genomes”, no reference exists. Propionibacterium (P.), Staphylococcus (S.), Corynebacterium (C.)
Finally, we used our gene catalog to identify microbial species and pangenomic content independently of reference genomes. Under the assumption that genes from one genome covary in abundance across samples due to physical linkage, we created metagenomic ‘clusters’9,10 by correlating gene abundances across samples. Most resultant clusters were relatively small, but others contained hundreds of thousands of predicted ORFs, which likely represent both genes and gene fragments. High-complexity dry sites had the most clusters and while toenails had the fewest, their median gene recruitment was significantly larger (Fig. 5c). To strengthen the reliability of our metagenomic clusters, we required clusters to share >50% consensus taxonomy at the species level and uncovered large clusters of fungi, bacteria, and viruses (Fig. 5d). M. globosa, P. acnes, and S. epidermidis had very large clusters, consistent with their high abundance in skin. In addition to clusters representing referenced genomes, we also identified multiple uncharacterized genomes (Fig. 5e), most commonly species of common genera in the skin, including Corynebacterium, Propionibacterium, and Staphylococcus. In summary, leveraging reference-free approaches, we identified previously undefined elements of the human skin microbiota. While dominant species or pathogens are targeted for sequencing, metagenomic studies reveal striking additional taxonomic and thereby functional diversity.
Conclusions
The healthy skin metagenome possesses surprising taxonomic and functional diversity dependent on both biogeography and individuality. In contrast to other body sites like the gut, skin has markedly higher viral and fungal representation. For most individuals, common skin species exist as a heterogeneous mix of strains, raising questions of whether transitions to a pathogenic state are mono- or multiphyletic, and how strain heterogeneity affects disease incidence or severity. Significant decreases in community diversity are a hallmark of a disease state19; whether such shifts occur at all taxonomic levels down to the subspecies awaits investigation. Our reference-based toolkit for multi-kingdom analyses and strain differentiation is broadly applicable to ecosystems with a well-characterized sequence space. Our reference-free resources, generated by adaptive assemblies, enable interrogation of the significant uncharacterized proportion of the metagenome, even identifying species without reference genomes.
From a therapeutic perspective, the metagenome represents a rich resource for synthetic biology approaches to modify and transplant endogenous elements to other communities. Studies of metabolic capacity, pathogenicity islands, and virulence genes in disease states, with our catalog from healthy skin, will uncover biomarkers associated with transmission, recurrence, and severity of disease. Finally, characterization and tracking of surprisingly pervasive antibiotic resistance elements will remain clinically relevant, as skin sites can serve as a taxonomic and genetic reservoir for pathogens. We envision a new therapeutic landscape leveraging unique metagenomic profiles with tailored clinical interventions that reshape our microbial communities.
Methods
Subject recruitment and sampling
Healthy male and female volunteers of 23 to 39 years of age without chronic skin diseases were recruited from the Washington, DC metropolitan region, USA, between June 2011 and May 2013. This natural history study was approved by the Institutional Review Board of the National Human Genome Research Institute (http://www.clinicaltrials.gov/ct2/show/NCT00605878). All subjects provided written informed consent prior to participation. Subjects provided medical and medication history and underwent a physical examination. Exclusion criteria included history of chronic medical conditions, including chronic dermatologic diseases, and use of antimicrobial medication (antibiotic or antifungal treatments) 1 year before sampling. Cleansing with only non-antibacterial cleansers was allowed during the 7 days before sample collection. To maximize microbial load, no bathing, shampooing, or moisturizing was permitted within 24 hours of sample collection15, which we have previously observed produces no discernible shifts in the overall diversity and structures of skin communities.
18 skin sites representing diverse physiologic characteristics and sites of predilection for specific dermatologic diseases were sampled: moist (antecubital crease, inguinal crease, interdigital web space, nares, popliteal crease, plantar heel, toeweb space), dry (hypothenar palm, volar forearm), sebaceous (alar crease, back, cheek, external auditory canal, glabella, manubrium, occiput, retroauricular crease), and toenail (Extended Data Fig. 1). Additional unmatched samples excluded from statistical analyses included samples extracted with the NEBNext Microbiome DNA Enrichment Kit (NEB), axillary vault (moist), bacterial and fungal mock communities19, samples that were whole genome amplified prior to library creation, and samples from disease patients (SH). To obtain sufficient DNA from defined anatomical skin sites with low and variable microbial biomass, we modified clinical sample acquisition methods using a swab-scrape-swab procedure, in which a defined anatomical skin area was swabbed with a swab (Catch-All Sample Collection Swabs, Epicentre) pre-moistened with yeast cell lysis buffer (MasterPure Yeast DNA Purification Kit, Epicentre), scraped via sterile disposable surgical blade, and swabbed with the same swab again. Residuals from the scalpel and swab were collected into lysis buffer. Nares and external auditory canal sites were sampled via swabbing with pre-moistened swabs that were then placed into lysis buffer. Toenail samples were cut with sterilized nail clippers and placed into lysis buffer. All samples were stored at −80 C until extraction. Samples were then incubated in yeast cell lysis buffer (MasterPure Yeast DNA Purification Kit, Epicentre) and Readylyse (Epicentre) for 30 min at 37 C, then mechanically disrupted using 5 mm stainless steel beads (Qiagen) in a Tissuelyser (Qiagen) for 2 min, 30 Hz. Samples were incubated for 30 min at 65 C, placed on ice for 5 min, and debris spun down after treatment with MPC protein precipitation reagent. Samples were combined with 350 µL of 100% ethanol and column purified using the Invitrogen PureLink Genomic DNA. Finally, samples were eluted in 30 µl of water (MoBio).
Sample sequencing
Because of low bioburden typical of skin samples, Illumina libraries were created using Nextera library preparation. Briefly, 1–50 ng of extracted DNA was used as input into the transposome fragmentation step. Manufacturer’s protocol was followed with the exception of using 10 cycles of PCR. 1–10 ng of extracted DNA was used as input according to manufacturers’ recommended protocol (Qiagen Repli-G Mini). Libraries were then sequenced with 2×100bp paired end reads on an Illumina HiSeq at the NIH Intramural Sequencing Center with a target of 15 or 50 million clusters, depending on the microbial diversity of that site and the human DNA admixture. To ascertain that the Nextera approach resulted in minimal sequencing bias, we calculated expected distribution of breaks as represented by the expected frequency of 5-mers starting a read for 4 different genomes, with high correlation with a standard Illumina prep. Moreover, expected vs. observed frequencies of species in sequencing of the bacterial mock community were closely matched.
In total, we obtained 7.4 billion reads (289 Gbp) of non-human, quality-filtered paired-end and singleton reads (median 9.5 million reads (893 Mbp) per sample, mean insert size 145±2 bp). Sequencing data were processed to remove low quality reads and any read pairs in which at least one read mapped to the human hg19 human reference. Nextera adapter sequences were trimmed, if necessary, using Crossmatch 1.090518 (http://www.phrap.org) and custom scripts. Bases with quality score below 20 were trimmed, and reads <50 bp length were removed. Sequencing depth varied by site with estimated kmer coverage ranging from 38.0±5.7% to 81.0±7.0% based on the accumulation of unique DNA substrings, or kmers. Rarefaction curves were generated using Khmer v0.7.120 with a 20× coverage cut-off. Briefly, reads were split into k-mers, compared to a k-mer coverage table and kept only if the median k-mer coverage was below the cutoff. Resulting curves showed the coverage of k-mer space as a function of sequencing effort. Median insert size was estimated from a subsample of paired reads that match hg19. Post sequence quality control, samples with >20 million reads remaining were subsampled to 10 million paired end reads, and singletons were discarded. HMP data from the anterior nares, retroauricular crease, stool, posterior fornix, tongue dorsum, and supragingival plaque were obtained from public-ftp.hmpdacc.org and subsampled to 1 million reads for taxonomic comparisons.
Amplicon processing
To validate our taxonomic assignments, normalize for sequencing levels, and reduce false positives, we also compared our results with matched bacterial 16S and fungal ITS amplicon sequencing. 159 matched 16S rRNA and 92 matched ITS1 samples were processed as previously described15. Briefly, the V1–V3 region of the 16S rRNA gene was amplified using the barcoded 27F and 534R and the ITS1 with 18SF and 5.8S-1R primers. Amplicon libraries were sequenced on a 454 GS FLX (Roche) instrument using titanium chemistry. 16S rRNA and ITS1 samples were processed using the mothur pipeline21 as previously described15. Briefly, 454 flow gram data were denoised, error-trimmed, and chimeric sequences removed. 16S sequences were classified using RDP training set 9 and ITS1 using a custom ITS1 database4. Staphylococcus and Malassezia genera were classified to the species level using pplacer22 with custom databases.
Reference-based taxonomic and functional classification
We compiled a list of complete and draft microbial reference genomes of 2342 bacterial, 389 fungal, 1375 viral, and 67 archaeal genomes from the National Center for Biological Information (NCBI, http://www.ncbi.nlm.nih.gov), the Human Microbiome Project (HMP, www.hmpdacc.org), the Saccharomyces Genome Database (SGD, www.yeastgenome.org), the Fungal Genome Initiative (FGI, http://www.broadinstitute.org), FungiDB (fungidb.org), and internally sequenced genomes (Supplementary Table 2). Where multiple genomes for a reference were available, we selected complete over draft genomes. Reads not matching hg19 + hg19 rRNA were mapped to this genome collection using bowtie2’s23 —very-sensitive parameter retrieving the top 10 hits. Reads mapping to multiple genomes were then reassigned to a ‘most likely’ genome using Pathoscope v1.024, which uses a Bayesian framework to examine each read’s sequence and mapping quality within the context of a global reassignment. Read hit counts were then normalized by genome length and scaled to sum to one. To reduce the likelihood of recovering spurious genomes, we also calculated genome coverage for each genome hit using the genomeCoverageBed tool in the Bedtools suite25. For relative abundance and diversity calculations, genomes with coverage < 1 were removed to decrease low-abundance false positives, providing a measure of normalization for sequencing depth.
To assess the accuracy of our taxonomic classifications and our estimation of community diversity, we compared taxonomic assignments of bacteria and fungi to 16S and ITS amplicon results, as well as to the output from a bacterial and archaeal mapping tool, Metaphlan26. We observed high correlations extending to the species level for bacterial sequences (Extended Data Fig. 3, Supplementary Tables 2–4). Concordance of non-Malassezia fungal species was lower, presumably due to the relative paucity of sequenced fungal genomes. We used the Shannon diversity index as well as species observed for diversity comparisons for bacterial classifications. All taxonomies were reconstructed to the species level, combining hits to multiple strain subtypes. The coverage cutoff of 1 was chosen as an inflection point for species accumulation and as a point of concordance between diversity estimates derived from other approaches.
We characterized the representation of functional gene groups in the skin using the KEGG Orthology gene pathway (KO) and module (MO) annotations27, calculating corresponding abundances and coverages using the HMP Unified Metabolic Analysis Network (HUMAnN)28. We note that functional diversity is likely underestimated in the absence of viral pathways in the KEGG database. We mapped reads to the 2013.10.14 KEGG release using USEARCH v7.029 e-value <0.01, -accel 0.5 as described28. The top 10 hits were then processed with HUMANN v0.9928. To define genetic carriage of resistance profiles in the skin, antibiotic resistance genes from the Antibiotic Resistance Genes Database (ARDB)30 were clustered based on sequence similarity to produce families of unique short sequence markers using ShortBRED31. Reads were then mapped to the top marker using USEARCH v7.0, minimum alignment length 20, percent identity 95%. A family (resistance gene) was called present if at least one gene of that family was represented with a non-zero median of all its markers (median # hits to its markers > 0). Each family was normalized by the number of the hits, the marker length, and the length of the original protein sequence. We considered only presence/absence for a more conservative assessment. We note that while antibiotic resistance genes are typically classified with respect to a particular species, from metagenomic data it is difficult to impute an organism of origin because families can be encoded on plasmids (e.g., NP_040465, a tetracycline efflux pump).
Reference-based strain mapping
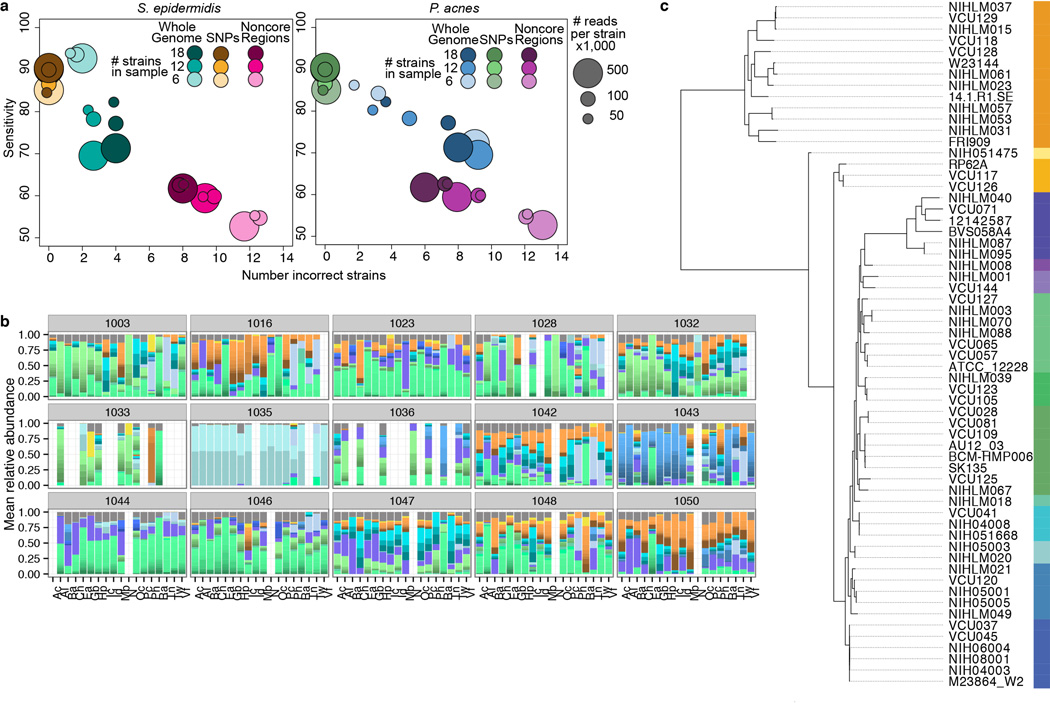
Accurate, de novo identification of single nucleotide polymorphisms (SNPs), used in metagenomic strain tracking of high-biomass stool samples, typically requires 100× coverage for robust identification32. Given strain variance due to differential representation and sequencing depth, we developed a reference-based approach, assessing feasibility and accuracy with computational simulations of communities of mixed complexity. For bacteria Propionibacterium acnes and Staphylococcus epidermidis, we created custom, species-specific reference databases incorporating all complete and draft genomes present for those species from NCBI, totaling 78 and 61, respectively (Supplementary Table 2). To visualize relationships between the strains, all SNPs identified in core regions were used to create dendrograms with the program PhyML 3.033. Strains were assigned to a subtype based on phylogenetic distance, e.g., we defined 12 subtypes for P. acnes and 14 for S. epidermidis.
For each respective set of reference genomes, we identified first, SNPs unique to each strain in regions shared in all genomes (‘core’), and second, larger regions that are partially shared or unique to a strain (‘non-core’, Supplementary Table 2). We mapped reads to each database using bowtie2 with stringent parameters (--score-min L, −0.6,0.006), allowing zero mismatches and as many hits as genomes in the database. Read assignment using Pathoscope was performed as described, except theta_prior, an option that controls the proportion of non-unique reads that are assigned to a genome, was set to 10e88 (most genomes permitted). Normalization was performed as described above.
Because Pathoscope can reassign reads to closely related genomes rather than an actual target genome that may or may not be present in a sample, we evaluated the ability of Pathoscope to accurately reassign reads to very similar substrains by first, assessing sensitivity of complex staggered mixtures of synthetic communities, and second, demonstrating the presence of unique genomic loci that allow discrimination between subtypes. First, synthetic communities were created with 6, 12, or 18 genomes per community, with 50,000, 1000,000, or 500,000 reads sampled per genome for an even mix, as well as a staggered community to estimate accuracy in abundance calling. 15 random synthetic communities for each even genome group, and 5 for staggered, were created and mapped to the full genome set. Sensitivity was calculated from the expected vs. observed abundances. Second, we identified SNPs unique to each genome in ‘core’ regions of the genome (defined as shared between all reference genomes in species-specific database) using nucmer34 and custom scripts. Nucmer was also used to identify ‘non-core’ regions in each of the genomes. Simulated reads were then mapped to strains based upon: 1) consensus SNPs, 2) non-core region variants, or 3) full genomes to identify what variants are shared between sites/individuals. In simulations, core SNPs had the highest sensitivity, but whole genomes, which incorporate both core and non-core elements, were best able to identify closest neighbor strains (Extended Data Fig. 6, Supplementary Table 9). Although we have supported our results using SNPs (Supplementary Table 10), mapping to whole genomes provided clear advantages if an exact reference strain is not present in vivo, which is likely given the limited number of fully sequenced genomes. In absence of an exact reference, our approach robustly defines most similar strains based on differentiating genomic features.
Adaptive iterative de novo assembly
Assembly efficacy varies depending on the site’s unique features of community complexity, typically defined by microenvironment, and sequencing depth, which is affected by biomass and human DNA admixture. To optimize assembly parameters, individual samples were assembled using a wide kmer range in Velvet35, and contigs greater than 300 bp in length were analyzed. To examine assembly efficacy, reads were remapped to assemblies using bowtie2 —sensitive. ’Adaptive’ denotes that each sample was assembled using kmers ranging from 37–69. A quality score was calculated using % paired or singleton reads realigning to the assembly, the number of bases incorporated into the assembly, and number of contigs > 300 bp. The assembly with the highest quality score was used for subsequent analysis. ‘Iterative’ denotes subsequent steps in which unaligned reads from remapping were then pooled to improve recovery of rare genes that may represent genomes unique to an individual. We found that pooling by individual produced higher quality assemblies than pooling by site (Supplementary Table S17). This observation supported our insight that while site can shape the major features of a community, species and strains are shared within an individual. To improve assembly quality and reduce computational burden, digital normalization20, which reduces error by removing redundant data and performs similarly to non-normalized data (Extended Data. Fig 14c), was applied on pooled samples prior to assembly. We used two pass normalization to 20× then 5× with variable coverage and assembled with adaptive kmer selection. Finally, unaligned reads from pooled individual assemblies were pooled and subsampled 1:10 prior to normalization and variable assembly.
To create a multi-kingdom skin microbial gene catalog, genes were predicted from contigs using two models, MetaGeneMark36, which incorporates multiple bacterial models, and Augustus37 with a Ustilago maydis model as a phylogenetically near neighbor to Malassezia, the most predominant skin fungi. To account for cases where both fungal and bacterial genes were called for the same contig, we adopted a filtering methodology by which each contig was assigned to a kingdom using blastn against our microbial database, or where no blastn hit was available, a blastx against nr using USEARCH. Discordant calls not resolved by blastn/x filtration were marked ambiguous or assigned to whichever caller generated a prediction. A non-redundant catalog was constructed using UCLUST with sequence identity cut-off of 0.95 and a minimum coverage cutoff of 0.9 for shorter sequences. This final catalog contained 5,922,920 putative bacterial and fungal genes.
During this process, we also observed that many short contigs (<1000bp) produced no putative genes. To circumvent losing partial genes or genes unidentifiable by our prediction models, we revised our gene catalog to first retrieve contigs <1000bp, then call genes on contigs > 1000bp as previously described. To assess the abundance of genes, reads were aligned to the gene catalog with Bowtie2 —sensitive and counts per gene were normalized by length.
Putative metagenomic clusters, based on covariance of gene abundances across samples, were formed as described10. Genes from the same genome are assumed to co-vary in relative abundance across subjects due to physical linkage; therefore such clusters can serve as a proxy for unknown organisms or known organisms with variable gene content. We clustered gene abundances across samples, grouped by site characteristic both to improve segregation of clusters and reduce computational burden. To reduce false positives and computational complexity, we required genes to be present in at least 20% of samples for a given site characteristic. The abundances of these genes across samples were then clustered using the Markov clustering algorithm implemented in MCL38 with a Spearman correlation coefficient of 0.85 and inflation parameter set to 2. Cluster parameters varying presence to 40% presence across samples, correlation coefficients to 0.80 and 0.90, and inflation parameters of 4 produced similar results. For toenail, 40% presence and clustering at 80% was performed due to computational limitations imposed by site complexity. Clusters were taxonomically annotated by blastx-ing each gene in a cluster to nr as previously described, and as a strict requirement against false binning, clusters with at least 50% of genes mapping to the same phylogenetic group at the species, genus, and/or family level were retained as a metagenomic ‘cluster’. Clusters with the same consensus taxonomy were merged at the genus and species level; family level analysis showed minimal improvements in consensus (Supplementary Table 18). Because a typical microbial genome contains thousands of genes, we speculate that many of these represent gene fragments that did not pass our stringent redundancy thresholds. While our variable sequencing depth likely precludes recovery of complete genomes from such a metagenomic linkage analysis, we identified large clusters of taxonomically related groups of covarying genes for both characterized and uncharacterized species.
Statistical analysis
All statistical analyses were performed in the R software. Data are represented as mean ± standard error of the mean unless otherwise indicated. For all boxplots, black center lines represent the median and box edges the first and third quartiles. 'e' in scientific notation refers to 10×, e.g., 10e5 represents 10×105. Spearman correlations (ρ) of non-zero values were used for all correlation coefficients. The nonparametric tests Wilcoxon rank-sum and Kruskal-Wallis were used to determine statistically significant differences between microbial populations, and to identify significant inter-category comparisons, we used a post-hoc multiple comparison test, implemented by the kruskalmc test in the pgirmess package. Unless otherwise indicated, P-values were adjusted for multiple comparisons using the p.adjust function in R using method = “fdr”39. Statistical significance was ascribed to an alpha level of the adjusted P-values ≤ 0.05. Site characteristics were treated as separate groups where indicated based on spatial physiological differences between these different body niches2. Similarity between samples was assessed using the Yue-Clayton theta similarity index40 with relative abundances of species, substrains, or shared genomic variants. The theta coefficient assesses the similarity between two samples based on (1) number of features in common between two samples, and (2) their relative abundances with θ=0 indicating totally dissimilar communities and θ=1 identical communities. To avoid repeated measures, samples belonging to an individual were averaged prior to statistical comparisons between site characteristic when using summary metrics such as means, diversity, or theta indices.
Supervised random forest models to identify discriminatory taxa and modules was implemented with the randomForest package in R41. This analysis was enabled by our multi-site sampling strategy, as using a single or few sites lacks statistical power to detect low abundance features. Mean decrease in accuracy denotes the normalized difference in the classification accuracy when that variable is included versus when data is randomly permuted, i.e., to what degree inclusion of this predictor in the model reduces classification error. Model accuracy was calculated using the out-of-bag (oob) error estimate, which is an approximation of how frequently an individual is misclassified.
Data deposition
Data deposition is with the SRA and all sequences can be accessed under BioProject 46333. Human subject clinical data is deposited with dbGaP 2188. Analysis workflow is available at https://github.com/julia0h/skinmetagenome.git.
Extended Data
Extended Data Figure 1.
The 18 selected skin sites and their location on the human body. These sites represent three microenvironments: sebaceous (blue), dry (red), and moist (green). Toenail (black) is a site that does not fall under these major microenvironments and is treated separately. Pie charts represent consensus relative abundance of the kingdoms Bacteria, Eukaryota (Fungi), and Virus from multi-kingdom mapping.
Extended Data Figure 2.
Per-sample read statistics. Additional samples (bacterial and eukaryotic mock communities) are shown. a, Boxplots (line indicates median; boxes represent first and third quartiles) show, for each site, % reads mapping to human hg19 that are discarded prior to analysis. Sites are colored by site characteristic. b, Samples are ordered by label. Lines indicate the median value for that statistic; value is in parenthesis. c, Estimate of sequencing coverage. Reads seen is the number of reads in a sample sampled. Reads are then split into 20-mers, compared to a k-mer coverage table and kept only if the median k-mer coverage is below 20×. Curves are grouped by site, colored by individual as indicated.
Extended Data Figure 3.
Validation of taxonomic classifications. a, Bacterial sample community diversity as a function of genome coverage for two diversity metrics, the Shannon index that measures the richness and evenness of the community (left), and # species observed (right). Genome coverage is defined as for each genome hit, the % of genome covered by reads. Boxplots show the range of diversity values for all samples, segregated by microenvironment. Black lines indicate median; boxes represent first and third quartiles. As coverage cutoffs increase, diversity estimates drop sharply. b, Comparisons of bacterial community diversity for Metaphlan-derived classifications vs. custom bacterial Pathoscope-derived classifications. Each point represents a different sample, colored by microenvironment. With no coverage cutoffs (left), Pathoscope may overestimate diversity, which is reduced by setting a minimum 1× coverage requirement. Spearman correlation (ρ) and corresponding P-values are shown. Pathoscope-derived relative abundances versus relative abundances derived from c, 16S amplicon sequencing, d, Metaphlan genus-level, e, Metaphlan-species level (ρ & P-value are calculated for non-zero abundance taxa) f, Metaphlan, staphylococcal species, g, ITS1 amplicon sequencing, genus (ρ & P-value are calculated for non-zero abundance taxa) and h, ITS1 amplicon sequencing, Malassezia species.
Extended Data Figure 4.
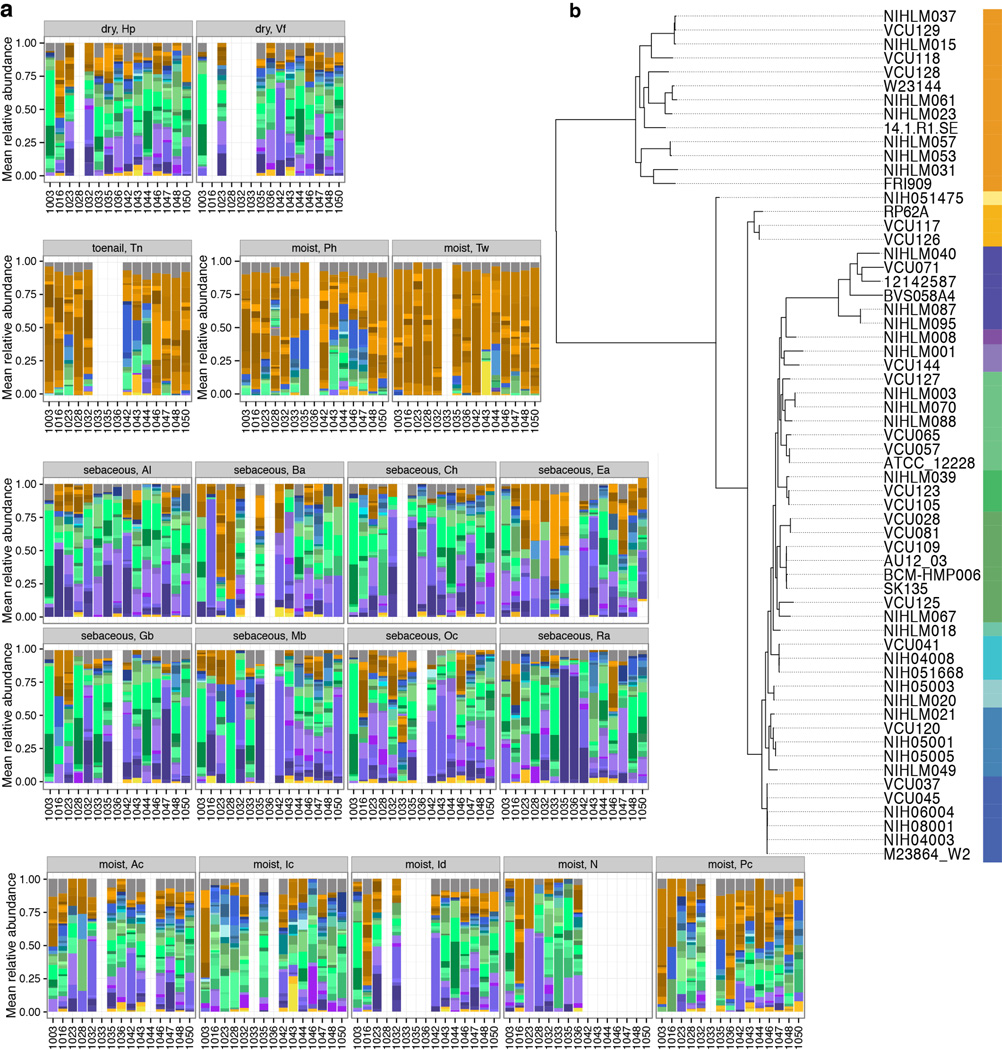
Full taxonomic classifications for all healthy volunteers (HV), all sites. To aid visualization of site- and individual-specific similarities, samples are grouped by site/microenvironment for each individual. Relative abundances of the most abundant skin taxa for each super-kingdom are shown. b, Taxonomic re-classification of major sites sampled by the Human Microbiome Project. Samples are from the anterior nares and retroauricular crease (skin), tongue dorsum and supragingival plaque (oral), stool, and posterior fornix (vaginal). Relative abundances of the most abundant taxa for each kingdom in the skin, for comparison, are shown.
Extended Data Figure 5.
Strain-level classification based on reference genomes show sub-species heterogeneity for dominant skin taxa. a, Simulations to assess sensitivity of Pathoscope-based mapping to SNPs, non-core regions, or whole genomes. Synthetic communities were created with 6, 12, or 18 genomes per community. Sizes of circles reflect the number of reads sampled from each genome, e.g., 50,000, 1000,000, or 500,000 reads per genome. 15 random synthetic communities for each genome group were created and mapped to SNPs, non-core regions, or the full genome set. Sensitivity is calculated from the expected vs. the observed abundances. b, Full strain-level assignments for samples with relative abundances of closest related Propionibacterium acnes strains, by individual. c, Dendrograms of strain similarity. Trees were generated using core SNPs; genomes were aligned with nucmer to identify core regions, and then SNPs within these core regions were identified by calculating all pairwise differences between genomes. Bar of colors indicates delineations of subtypes where phylogenetically more similar genomes are in similar colors, e.g., we defined 12 subtypes for P. acnes.
Extended Data Figure 6.
Strain-level classification for Staphylococcus epidermidis. a, Full strain-level assignments for samples by microenvironment. b, Description is as in Extended Data Figure 5c. We defined 14 subtypes for S. epidermidis.
Extended Data Figure 7.
Full version of coreness of different module categories across skin microenvironment. A module is defined as core if occurring in >2/3 of samples for that class. Major KEGG module descriptors are shown in the different colors. Height of bars reflects the proportion of samples that a module occurs in; error bars reflect the variation of the members of that KEGG descriptor and are standard error of the mean.
Extended Data Figure 8.
Correlation analysis of module abundance with species abundance to infer a module’s taxonomic origin. Spearman correlation (ρ) was calculated with corresponding P-value for taxa with relative abundance > 0.5% and modules with greater than 0.05% relative abundance. Corynebacterium (Coryn.) a, Unsupervised clustering of correlation coefficients. Species from the same genera clustering together may suggest a shared contribution of a pathway. b, Most significantly correlated taxa; colors represent broad KEGG classes. Adjusted P < 2e-16.
Extended Data Figure 9.
Antibiotic resistance profiles in the skin. Reads were mapped to a short marker database consensus created from the ARDB database, which catalogs publicly available resistance genes. Genes are grouped into broad resistance classes; a resistance category is called present (black; absent = white) if at least one gene from its family is present.
Extended Data Figure 10.
Reference-free analysis of skin metagenome with adaptive iterative assembly, gene catalog, and metagenomic clusters. a, Tracking unclassified reads. Fraction unmapped reads refers to the fraction of total reads passing quality control that do not map to the major super kingdoms Archaea, Bacteria, Eukaryota, and Viruses. Samples are ordered by label and are divided by site. b, Assembly, gene-calling, and clustering workflow. c, Assembly efficacy varies significantly by kmer depending on the site’s unique features of community complexity and sequencing depth, which is most affected by that site’s human DNA admixture. Assembly statistics are shown for samples pooled by individual, which produced higher quality assemblies than pooling by site. Because of large pool size, khmer digital normalization was used prior to Velvet assembly. % overall alignment rate indicates the total % of reads that map back to that sample’s assembly for each kmer. % paired concordant indicates the fraction paired reads (of overall, not of % paired) in which both pairs of a mate map back to an assembly; discordant is where one mate of a pair does not map, or maps to a different contig. Contigs are then assessed by the maximum assembly size, the number of bases that are used in the assembly, and the number of contigs above a threshold of 300bp. d, Effect of khmer digital normalization on individual sample assembly. Digital normalization + Velvet assembly performs similarly to Velvet assembly alone.
Supplementary Material
Acknowledgments
We thank Deborah Schoenfeld, Amynah Pradhan, Morgan Park, and Gerald Bouffard for their underlying efforts. We also thank members of the Segre lab and Mark C. Udey for their helpful discussions. This work was supported by NIH NHGRI and NCI Intramural Research Programs and in part by 1K99AR059222 (H.H.K.). This study utilized the high-performance computational capabilities of the NIH Biowulf Linux cluster. Sequencing was funded by grants from the National Institutes of Health (1UH2AR057504-01 and 4UH3AR057504-02).
Footnotes
Supplementary
Supplementary Table 1. Sequencing statistics for all samples
Supplementary Table 2. List of reference genomes used for mapping
Supplementary Table 3. Bacterial taxonomic classifications via Metaphlan
Supplementary Table 4. Bacterial taxonomic classifications via 16S rRNA amplicon sequencing
Supplementary Table 5. Fungal taxonomic classifications via ITS1 amplicon sequencing
Supplementary Table 6. Multi-kingdom taxonomic classifications, diversity, and microenvironment means, all coverages
Supplementary Table 7. Multi-kingdom taxonomic classifications, diversity, and microenvironment means (all coverages) for select HMP data
Supplementary Table 8. Taxonomy-level random forests analysis, by patient
Supplementary Table 9. Sensitivity of simulations estimating accuracy of Pathoscope-based strain caller
Supplementary Table 10. Summary of SNP-level identification per strain
Supplementary Table 11. Estimated relative abundance of strain-level variation in Propionibacterium acnes using full genomes
Supplementary Table 12. Estimated relative abundance of strain-level variation in Staphylococcus epidermidis using full genomes
Supplementary Table 13. Functional module and metabolic pathway mapping via HUMAnN; abundance
Supplementary Table 14. Functional module and metabolic pathway mapping via HUMAnN; coverage
Supplementary Table 15. Over- and underrepresentation of KEGG modules
Supplementary Table 16. Assessment of antibiotic resistance gene families
Supplementary Table 17. Iterative assembly statistics for de novo assembly
Supplementary Table 18. Gene catalog summary
Author contribution statement
J.O., H.H.K., J.A.S. designed the study. H.H.K. collected patient samples. C.D. prepared the clinical samples for sequencing, which was carried out by the members of the NIH Intramural Sequencing Center Comparative Sequencing program. J.O., A.L.B., S.C. analyzed sequence data. J.O., H.H.K., J.A.S. drafted the manuscript. All authors read and approved the final version of the manuscript.
NISC Comparative Sequencing Program2 (additional authors)
Betty Barnabas, Robert Blakesley, Gerry Bouffard, Shelise Brooks, Holly Coleman, Mila Dekhtyar, Michael Gregory, Xiaobin Guan, Jyoti Gupta, Joel Han, Shi-ling Ho, Richelle Legaspi, Quino Maduro, Cathy Masiello, Baishali Maskeri, Jenny McDowell, Casandra Montemayor, James Mullikin, Morgan Park, Nancy Riebow, Karen Schandler, Brian Schmidt, Christina Sison, Mal Stantripop, James Thomas, Pamela Thomas, Meg Vemulapalli, Alice Young
References
- 1.Grice EA, Segre JA. The skin microbiome. Nat Rev Micro. 2011;9:244–253. doi: 10.1038/nrmicro2537. [DOI] [PMC free article] [PubMed] [Google Scholar]
- 2.Grice EA, et al. Topographical and Temporal Diversity of the Human Skin Microbiome. Science. 2009;324:1190–1192. doi: 10.1126/science.1171700. [DOI] [PMC free article] [PubMed] [Google Scholar]
- 3.Costello EK, et al. Bacterial Community Variation in Human Body Habitats Across Space and Time. Science. 2009;326:1694–1697. doi: 10.1126/science.1177486. [DOI] [PMC free article] [PubMed] [Google Scholar]
- 4.Findley K, et al. Topographic diversity of fungal and bacterial communities in human skin. Nature. 2013;498:367–370. doi: 10.1038/nature12171. [DOI] [PMC free article] [PubMed] [Google Scholar]
- 5.Peters BM, Noverr MC. Candida albicans-Staphylococcus aureus Polymicrobial Peritonitis Modulates Host Innate Immunity. Infect. Immun. 2013;81:2178–2189. doi: 10.1128/IAI.00265-13. [DOI] [PMC free article] [PubMed] [Google Scholar]
- 6.Arumugam M, et al. Enterotypes of the human gut microbiome. Nature. 2011;473:174–180. doi: 10.1038/nature09944. [DOI] [PMC free article] [PubMed] [Google Scholar]
- 7.De Vlaminck I, et al. Temporal Response of the Human Virome to Immunosuppression and Antiviral Therapy. Cell. 2013;155:1178–1187. doi: 10.1016/j.cell.2013.10.034. [DOI] [PMC free article] [PubMed] [Google Scholar]
- 8.Handley SA, et al. Pathogenic Simian Immunodeficiency Virus Infection Is Associated with Expansion of the Enteric Virome. Cell. 2012;151:253–266. doi: 10.1016/j.cell.2012.09.024. [DOI] [PMC free article] [PubMed] [Google Scholar]
- 9.Qin J, et al. A metagenome-wide association study of gut microbiota in type 2 diabetes. Nature. 2012;490:55–60. doi: 10.1038/nature11450. [DOI] [PubMed] [Google Scholar]
- 10.Karlsson FH, et al. Gut metagenome in European women with normal, impaired and diabetic glucose control. Nature. 2013;498:99–103. doi: 10.1038/nature12198. [DOI] [PubMed] [Google Scholar]
- 11.Grice EA, et al. A diversity profile of the human skin microbiota. Genome Res. 2008 doi: 10.1101/gr.075549.107. [DOI] [PMC free article] [PubMed] [Google Scholar]
- 12.Consortium, T. H. M. P. Structure, function and diversity of the healthy human microbiome. Nature. 2012;486:207–214. doi: 10.1038/nature11234. [DOI] [PMC free article] [PubMed] [Google Scholar]
- 13.Tettelin H, et al. Genome analysis of multiple pathogenic isolates of Streptococcus agalactiae: Implications for the microbial ‘pan-genome’. Proc. Natl. Acad. Sci. U. S. A. 2005;102:13950–13955. doi: 10.1073/pnas.0506758102. [DOI] [PMC free article] [PubMed] [Google Scholar]
- 14.Von Eiff C, Becker K, Machka K, Stammer H, Peters G. Nasal Carriage as a Source of Staphylococcus aureus Bacteremia. N. Engl. J. Med. 2001;344:11–16. doi: 10.1056/NEJM200101043440102. [DOI] [PubMed] [Google Scholar]
- 15.Oh J, et al. The altered landscape of the human skin microbiome in patients with primary immunodeficiencies. Genome Res. 2013 doi: 10.1101/gr.159467.113. [DOI] [PMC free article] [PubMed] [Google Scholar]
- 16.Sommer MOA, Dantas G, Church GM. Functional Characterization of the Antibiotic Resistance Reservoir in the Human Microflora. Science. 2009;325:1128–1131. doi: 10.1126/science.1176950. [DOI] [PMC free article] [PubMed] [Google Scholar]
- 17.Forsberg KJ, et al. The Shared Antibiotic Resistome of Soil Bacteria and Human Pathogens. Science. 2012;337:1107–1111. doi: 10.1126/science.1220761. [DOI] [PMC free article] [PubMed] [Google Scholar]
- 18.Kong HH, et al. Temporal shifts in the skin microbiome associated with disease flares and treatment in children with atopic dermatitis. Genome Res. 2012;22:850–859. doi: 10.1101/gr.131029.111. [DOI] [PMC free article] [PubMed] [Google Scholar]
- 19.Jumpstart Consortium Human Microbiome Project Data Generation Working Group. Evaluation of 16S rDNA-Based Community Profiling for Human Microbiome Research. PLoS ONE. 2012;7:e39315. doi: 10.1371/journal.pone.0039315. [DOI] [PMC free article] [PubMed] [Google Scholar]
- 20.Howe AC, et al. Tackling soil diversity with the assembly of large, complex metagenomes. Proc. Natl. Acad. Sci. 2014 doi: 10.1073/pnas.1402564111. 201402564. [DOI] [PMC free article] [PubMed] [Google Scholar]
- 21.Schloss PD, et al. Introducing mothur: Open-Source, Platform-Independent, Community-Supported Software for Describing and Comparing Microbial Communities. Appl Env. Microbiol. 2009;75:7537–7541. doi: 10.1128/AEM.01541-09. [DOI] [PMC free article] [PubMed] [Google Scholar]
- 22.Matsen F, Kodner R, Armbrust EV. pplacer: linear time maximum-likelihood and Bayesian phylogenetic placement of sequences onto a fixed reference tree. BMC Bioinformatics. 2010;11:538. doi: 10.1186/1471-2105-11-538. [DOI] [PMC free article] [PubMed] [Google Scholar]
- 23.Langmead B, Salzberg SL. Fast gapped-read alignment with Bowtie 2. Nat. Methods. 2012;9:357–359. doi: 10.1038/nmeth.1923. [DOI] [PMC free article] [PubMed] [Google Scholar]
- 24.Francis OE, et al. Pathoscope: Species identification and strain attribution with unassembled sequencing data. Genome Res. 2013;23:1721–1729. doi: 10.1101/gr.150151.112. [DOI] [PMC free article] [PubMed] [Google Scholar]
- 25.Quinlan AR, Hall IM. BEDTools: a flexible suite of utilities for comparing genomic features. Bioinformatics. 2010;26:841–842. doi: 10.1093/bioinformatics/btq033. [DOI] [PMC free article] [PubMed] [Google Scholar]
- 26.Segata N, et al. Metagenomic microbial community profiling using unique clade-specific marker genes. Nat. Methods. 2012;9:811–814. doi: 10.1038/nmeth.2066. [DOI] [PMC free article] [PubMed] [Google Scholar]
- 27.Kanehisa M, Goto S. KEGG: kyoto encyclopedia of genes and genomes. Nucleic Acids Res. 2000;28:27–30. doi: 10.1093/nar/28.1.27. [DOI] [PMC free article] [PubMed] [Google Scholar]
- 28.Abubucker S, et al. Metabolic Reconstruction for Metagenomic Data and Its Application to the Human Microbiome. PLoS Comput Biol. 2012;8:e1002358. doi: 10.1371/journal.pcbi.1002358. [DOI] [PMC free article] [PubMed] [Google Scholar]
- 29.Edgar RC. Search and clustering orders of magnitude faster than BLAST. Bioinformatics btq461. 2010 doi: 10.1093/bioinformatics/btq461. [DOI] [PubMed] [Google Scholar]
- 30.Liu B, Pop M. ARDB—Antibiotic Resistance Genes Database. Nucleic Acids Res. 2009;37:D443–D447. doi: 10.1093/nar/gkn656. [DOI] [PMC free article] [PubMed] [Google Scholar]
- 31.Kaminski J, Segata N, Franzoza E, Huttenhower C. Fast and Accurate Metagenomic Search with ShortBRED. unpublished. [Google Scholar]
- 32.Schloissnig S, et al. Genomic variation landscape of the human gut microbiome. Nature. 2013;493:45–50. doi: 10.1038/nature11711. [DOI] [PMC free article] [PubMed] [Google Scholar]
- 33.Guindon S, et al. New Algorithms and Methods to Estimate Maximum-Likelihood Phylogenies: Assessing the Performance of PhyML 3.0. Syst. Biol. 2010;59:307–321. doi: 10.1093/sysbio/syq010. [DOI] [PubMed] [Google Scholar]
- 34.Delcher AL, Phillippy A, Carlton J, Salzberg SL. Fast algorithms for large-scale genome alignment and comparison. Nucleic Acids Res. 2002;30:2478–2483. doi: 10.1093/nar/30.11.2478. [DOI] [PMC free article] [PubMed] [Google Scholar]
- 35.Namiki T, Hachiya T, Tanaka H, Sakakibara Y. MetaVelvet: an extension of Velvet assembler to de novo metagenome assembly from short sequence reads. Nucleic Acids Res. 2012 doi: 10.1093/nar/gks678. [DOI] [PMC free article] [PubMed] [Google Scholar]
- 36.Zhu W, Lomsadze A, Borodovsky M. Ab initio gene identification in metagenomic sequences. Nucleic Acids Res. 2010;38:e132–e132. doi: 10.1093/nar/gkq275. [DOI] [PMC free article] [PubMed] [Google Scholar]
- 37.Stanke M, Schöffmann O, Morgenstern B, Waack S. Gene prediction in eukaryotes with a generalized hidden Markov model that uses hints from external sources. BMC Bioinformatics. 2006;7:62. doi: 10.1186/1471-2105-7-62. [DOI] [PMC free article] [PubMed] [Google Scholar]
- 38.Dongen S. van, Abreu-Goodger C. In: Bact. Mol. Netw. Helden J. van, Toussaint A, Thieffry D., editors. New York: Springer; 2012. pp. 281–295. at < http://link.springer.com/protocol/10.1007/978-1-61779-361-5_15>. [Google Scholar]
- 39.Benjamini Y, Hochberg Y. Controlling the False Discovery Rate: A Practical and Powerful Approach to Multiple Testing. J. R. Stat. Soc. Ser. B Methodol. 1995;57:289–300. [Google Scholar]
- 40.Clayton MK, Yue JC. A SIMILARITY MEASURE BASED ON SPECIES PROPORTIONS. Commun. Stat.-Theory Methods. 2005;34:2123–2131. [Google Scholar]
- 41.Liaw A, Wiener M. Classification and Regression by randomForest. R News. 2002;2:18–22. [Google Scholar]
Associated Data
This section collects any data citations, data availability statements, or supplementary materials included in this article.


