

Abstract
Both orbitofrontal cortex (OFC) and ventral striatum (vStr) have been identified as key structures that represent information about value in decision-making tasks. However, the dynamics of how this information is processed are not yet understood. We recorded ensembles of cells from OFC and vStr in rats engaged in the spatial adjusting delay-discounting task, a decision-making task that involves a trade-off between delay to and magnitude of reward. Ventral striatal neural activity signalled information about reward before the rat's decision, whereas such reward-related signals were absent in OFC until after the animal had committed to its decision. These data support models in which vStr is directly involved in action selection, but OFC processes decision-related information afterwards that can be used to compare the predicted and actual consequences of behaviour.
Keywords: orbitofrontal cortex, nucleus accumbens, decision-making, vicarious trial and error, neuroeconomics
1. Introduction
Whenever animals deliberately engage in choosing between differently valued options, several steps must take place: (i) determining what actions are available, (ii) valuation of each of the potential actions, (iii) selecting an action based on expectations of outcomes, (iv) evaluating how the outcome is compared with what was expected, and finally, (v) updating memory and future expectations. Experiments in human and animal subjects have identified candidate brain areas for performing these different computations [1–5], including the orbitofrontal cortex (OFC) and ventral striatum (vStr) [6–15].
Functional brain imaging studies in human subjects have repeatedly found that OFC and vStr are engaged during the anticipation of reward—step ii above [16–19]. Both OFC and vStr show activity that scales with the expected value (EV) of reward when subjects are offered the choice between differently valued reward options [18,20–22]. These two brain areas show a high degree of similarity in their activity as measured with functional magnetic resonance imaging (fMRI) [23,24]. Because OFC and vStr have overlapping functional activity, it remains to be determined exactly how their roles differ during reward-based decision-making. Differences in the timing of decision-making signals in OFC and vStr—at second or subsecond timescales—could reveal fundamentally distinct computations. In order to investigate these questions, we recorded neurons simultaneously from OFC and vStr using electrophysiological techniques, which offer high temporal resolution.
We performed dual-structure neural ensemble recordings in rats on a task in which they engage in spontaneous, deliberative behaviour, the spatial adjusting delay-discounting task [25]. During self-driven choices, rats sometimes hesitate at the decision point, turning back and forth as if considering their options. This process is termed ‘vicarious trial and error’ or VTE [26,27]. Non-VTE passes, in contrast, are those in which the rat just progresses straight through the choice point. VTE and non-VTE behaviours are thought to engage different decision-making systems [11]. VTE has been proposed as a behavioural correlate of deliberation and the consideration of alternatives [11,27–29], whereas non-VTE behaviours have been proposed as indicative of more automated processes.
In particular, the differences between VTE and non-VTE behaviours have similarities to the distinction between goal-directed and habitual decision-making. Deliberation entails representing the consequences of alternative actions, and choosing an action based on the expected value of those associated outcomes [11]. A similar definition has been proposed for goal-directed behaviour; namely, that there is an encoding of the relationship between actions and their consequences, and a similar set of brain structures has been implicated in goal-directed behaviour, including medial prefrontal cortex and vStr [11,30].
There is strong evidence that neural representations during VTE play a role in these deliberative, goal-directed behaviours. During VTE, the hippocampus shows representations of possible future actions [31], and reward-related activity in vStr [10] and OFC [13] represent the potential outcomes. In contrast, structures involved in non-deliberative behaviours, such as those involved in procedural action-selection processes, do not show these types of deliberative information processing (e.g. dorsolateral striatum [32–34]). VTE provides a natural way to look at the timing of decision-making during uncued behaviour. Separate recording studies have shown that vStr and OFC exhibit neural representations of reward during VTE events [10,13], pointing to a potentially similar role in valuation during deliberative behaviour. However, it is unknown whether OFC and vStr represent similar or distinct types of information during VTE. Because they have not been recorded simultaneously, the relative timing of ventral striatal and orbitofrontal representations during decision-making is not known.
If reward-related signals in OFC or vStr (or both) are involved in planning the animal's decision during deliberative behaviour, then they should appear on VTE passes before the rat has made its choice. Furthermore, the timing of OFC and vStr activities relative to the rat's decision provides clues to the information processing going on within each structure, and how that structure can contribute to decision-making. This requires simultaneous recordings from OFC and vStr on a task in which animals make both deliberative and non-deliberative decisions. To test these ideas, we recorded from OFC and vStr simultaneously on a task in which rats are known to show value-guided behaviour, and during which they engage in both deliberative and non-deliberative decision-making [25].
2. Material and methods
(a). Animals
Six adult male Fisher Brown Norway rats (Harlan, Indianapolis, IN) aged 7–12 months at the start of training were used in this experiment. Rats were housed on a 12 L : 12 D cycle and had ad libitum access to water in their home cages. Prior to training, rats were handled daily for two weeks in order to acclimate them to human contact. In the second week, they were introduced to the experimental food pellets (45 mg unflavoured food pellets: Research Diets, New Brunswick, NJ). Rats earned their daily food requirement on the maze and were maintained at all times above 80% of their original free-feeding weight.
(b). Maze training
Rats were trained on the spatial delay-discounting T-maze (figure 1a), identical to that used in Papale et al. [25], in daily sessions that lasted 1 h and occurred at the same time each day. Rats were first trained to run laps on the task with one side or the other blocked. Once the rats consistently ran 100 laps within the hour, they moved on to the delay-discounting task. Each rat ran a 30 day sequence on the spatial delay-discounting task before surgery in order to thoroughly learn the structure of the task. See Papale et al. [25] for task details.
Figure 1.

Task structure of the spatial adjusting delay-discounting maze and definition of VTE events. (a) At the beginning of a session, rats were placed at the start of the maze. Rats ran through the central stem and into the choice point zone (dashed lines). Tones commenced as soon as rats chose one side by exiting the choice point zone (either on the left or the right, orange/shaded bars) and counted down to reward delivery. The assignment of large and small reward sides varied randomly from session to session, but remained constant within a given session. The large reward side delivered a three pellet reward after a variable delay and the small reward side delivered a one pellet reward after 1 s. The session was stopped after the rat had run 100 laps, or after 1 h had passed, whichever came first. (b) Histogram of maximum curvature values from all laps. The degree of pause and look behaviour (VTE) was quantified with a metric called curvature (see Material and methods). High curvature values indicate pause and look behaviour at the choice point. Choice point passes with a maximum curvature >2 were classified as VTE laps. Blue (black in print), non-VTE laps; green (grey in print), VTE laps. (c,d) To determine the relationship between VTE events and alternation/non-alternation laps, we calculated the likelihood that a lap was an alternation or non-alternation lap given that the animal showed VTE or not on that lap. The histograms show the probability that a lap was an alternation lap given that the animal did not show VTE on that lap (non-VTE, c) or that the animal did show VTE (d). Non-VTE laps tended to be alternation laps (mean percentage alternation = 0.86), whereas VTE laps were as likely to be alternation as not (mean percentage alternation = 0.51). (Online version in colour.)
Briefly, the structure of the task was as follows: on each day, one feeder provided a small reward (one food pellet) after 1 s—the ‘non-delay side’—whereas the other feeder provided a large reward (three food pellets) after an adjustable delay—the ‘delay side’. The left or right position of the delay and non-delay sides changed from session to session, but was counterbalanced across the 30 day sequence. The initial delay was 1–30 s, drawn pseudo-randomly from a uniform distribution. During performance of the task, the length of the adjusting delay changed based on the behaviour of the animal. Successive laps to the delay side increased the adjusting delay by 1 s. Successive laps to the non-delay side decreased the adjusting delay by 1 s. Alternating from side to side kept the adjusting delay constant. When entering the non-delay side feeder zone, a tone signalled the delivery of reward 1 s later. When entering the delay side feeder zone, a series of tones descending in pitch provided a countdown to the moment of reward delivery. In addition, each feeder (Med-Associates, St. Albans, VT) made an audible click during delivery of each pellet. On leaving the choice point zone and entering the feeder zone, the rat was prevented from returning to the choice point during training. In all recorded sessions, rats always proceeded from choice point to feeder zone to start of maze. This task design encouraged animals to ‘titrate’ the adjusting delay to their preferred delay—the delay at which waiting for a three pellet reward was equal in value to an immediate one pellet reward [25]. See electronic supplementary material, figure S1a,b, for example sessions.
(c). Surgery
After the 30 day behaviour sequence, rats were chronically implanted with a ‘hyperdrive’ (Kopf, Tujunga, CA) that consisted of 12 tetrodes and two reference electrodes that could be individually lowered into the brain across days to the desired depth. All hyperdrives contained two separate bundles of tetrodes, one bundle targeting lateral OFC (coordinates: anteroposterior (AP) + 3.5, mediolateral (ML) + 2.5 mm relative to bregma), and one bundle targeting vStr (coordinates: AP + 1.8, ML + 2.0 mm relative to bregma). Rats had either six OFC tetrodes and six vStr tetrodes (n = 4 rats), or four OFC tetrodes and eight vStr tetrodes (n = 2 rats). Reference electrodes for vStr were placed in corpus callosum, and for OFC, they were placed in corpus callosum or a quiet region of cortex above OFC. Surgical procedures were performed as described previously [31,35].
(d). Electrophysiological recording
After recovering from surgery, rats once again performed maze training with one or the other side blocked off. This allowed them to acclimate to the weight of the implant and to ensure that they could run 100 laps within the 1 h session time limit. During this re-training period, which lasted between one and two weeks, tetrodes were advanced daily to their eventual target depths: OFC (approx. 3–3.5 mm below brain surface) and vStr (approx. 6.5–8 mm below brain surface) [36]. See electronic supplementary material, figure S2, for final tetrode positions. Once rats reliably ran 100 laps with the blocks in place, they began the 30 day sequence on the delay-discounting task while plugged in. After each recording session, tetrodes were either kept in place, or advanced in small increments (40–80 μm per day) to maximize ensemble size. During recording sessions, the position of the rat was tracked by an overhead camera (sampled at 60 Hz) using LEDs on the recording headstage. All position data were time-stamped by the Cheetah data acquisition system. Code for running the task was custom written in Matlab (Mathworks, Natick, MA).
Single unit and local field potential data were recorded using a 64-channel Cheetah recording system (Neuralynx, Bozeman, MT) using standard techniques [31,35]. Electrophysiological data were recorded to disk for offline analysis. Pre-clusters of putative single cells were estimated automatically using Klustakwik 1.7 [37] (available at http://klusta-team.github.io/klustakwik/). Final categorizations of single units were identified manually using the MClust 3.5 spike sorting software (A.D.R., software available at http://redishlab.neuroscience.umn.edu/mclust/MClust.html). Only cells with more than 100 spikes were included in analyses. Neurophysiological data were collected from 164 individual recording sessions. Although all six rats ran 30 days of the delay-discounting task after surgery, we did not begin recording after surgery until the rats were running close to 100 laps plugged in and the tetrodes were close to their final targets. The distribution of recording sessions is as follows: R206 = 24 sessions, R214 = 24 sessions, R224 = 29 sessions, R226 = 28 sessions, R235 = 30 sessions and R244 = 29 sessions.
After completion of the electrophysiological recording sequence, rats were sacrificed and their brains were sliced and stained using standard histological techniques [31,35]. Most electrode positions for the OFC tetrodes were confirmed to be within ventral and lateral OFC (electronic supplementary material, figure S2a). However, some of the OFC electrodes for one rat (R214) extended into the piriform cortex. For this reason, electrophysiological data from R214 (24 sessions) were not included in our analyses. For vStr, all but one of the electrode positions were within vStr, largely in the nucleus accumbens core region (electronic supplementary material, figure S2b).
One hundred and sixty-four sessions were available for behavioural analyses. For single unit electrophysiological analyses, R214 was excluded. This yielded 140 sessions (947 vStr cells and 1754 OFC cells) for single unit analyses. For Bayesian decoding analyses, we included sessions only with at least five cells each in vStr and OFC: 85 sessions (177 vStr cells, 681 OFC cells).
3. Data analysis
(a). Reward sensitivity
To determine the reward sensitivity of a neuron, we calculated its mean firing rate in a window from 0 to 4 s after feeder trigger events. This time window encompassed the approximate time of reward receipt and consumption. For each neuron, we determined reward sensitivity for the delay side feeder, the non-delay side feeder and for both feeders taken together. In each case, we calculated a bootstrap distribution by determining the firing rate of the same neuron at random times during the session, in 4-s windows, for as many laps as the rat made to that feeder(s). See electronic supplementary material, figure S3, for a schematic of this method. We created a bootstrap distribution (500 iterations) by running this same algorithm using random time windows instead of the feeder times. For example, if the rat visited the non-delay feeder 48 times during a session, this distribution tells us what to expect from averaging the firing rate for the same neuron over 48 random times within the session. Neurons were considered reward responsive if the neuron's mean firing rate during reward receipt was significantly different from the bootstrapped distribution (z-test, p < 0.05).
(b). Identification of vicarious trial and error
Headstage tracking with the LEDs allowed precise measurement of the head position of the rat during passes through the choice point. Position samples starting from the midpoint of the central stem of the maze and ending at the invisible line demarcating entry into the feeder zone defined the choice point window (figure 1a). The coordinates defining the choice point zone were identical from day to day. Only position data from the choice point zone were used to categorize laps as VTE or non-VTE. Episodes of VTE were identified by calculating the curvature of the trajectory through the choice point measured as the tortuosity of the trajectory [38]. In order to calculate the curvature at each moment in time, we started from the 〈x, y〉 sequence of position samples detected from the headstage via the camera in the ceiling and Neuralynx's position-tracking software. From this sequence, we calculated the velocity 〈dx, dy〉 by applying the Janabi-Sharifi algorithm to the position sequence [39,40]. From the velocity sequence, we calculated the acceleration 〈ddx, ddy〉 by applying the Janabi-Sharifi algorithm to the velocity sequence. We then calculated the curvature as the tortuosity measured as  [38]. A sequence of adjacent tracking points with consecutive curvature values greater than 2 defined a reorientation event.
The start of the reorientation event was found by taking the position that started 200 ms before the first position sample having a curvature value greater than 2. This ‘turn around’ point matched well with the qualitative judgement of the moment of reorientation (see electronic supplementary material, figure S4). When multiple, discrete reorientation events occurred within some individual choice point passes, only the first one was analysed. Any choice point pass with a maximum curvature value greater than 2 was defined as a VTE lap. Large curvature values reliably matched qualitative identifications of the pause and look behaviour that is characteristic of VTE (examples in the electronic supplementary material, figure S4c,d). Under this classification system, using all behavioural data, 2099 of 16 000 laps (13%) were classified as VTE laps (164 sessions). Figure 1b shows the distribution of maximum curvature values. For non-VTE laps, the half-way point (the ‘MidPoint’) of the trajectory through the choice point was taken as the point of alignment for all peri-event time histograms (PETHs) that compared VTE with non-VTE timing.
(c). Ensemble decoding
On our spatial task, reward receipt occurred only at the feeder sites in the maze. Thus, reward-related activity occurred only at those same feeder sites. In order to measure representations of those reward-receipt locations, we used a spatial decoding algorithm. It is important to note that the use of this algorithm does not imply (nor does it depend on) orbitofrontal or ventral striatal cells having any spatial firing correlates—reward-related correlates will ‘drag’ the spatial decoding to the reward sites [10,13]. All decoding analyses were performed using a one-step spatial Bayesian decoding algorithm [41] with a time step of 250 ms and a uniform spatial prior. We used a ‘leave-one-out’ procedure, so that the decoding was done lap by lap. For each lap, the training set for the decoder (derived from the tuning curves) was calculated from all activity excluding the current lap (i.e. using all other laps). In this way, the training set for the decoder did not include the test set being decoded.
In order to measure the reward-site representation, we first identified what positions the animal sampled during the 4 s (0–4 s) after reward receipt. For each session, we defined the feeder sites as those spatial bins where there was greater than zero occupancy during the reward response window (0–4 s after feeder fire). We then calculated the proportion of the posterior probability allocated to those feeder sites. Thus, our decoding method measured the probability that neural ensemble activity during the given time step decoded to the particular spatial locations occupied by the feeders on the maze. Note that this does not imply or require that vStr or OFC cells are spatial in nature. Rather, cells in vStr and OFC respond to specific events (i.e. reward receipt); they show reward tuning, and these events happen at specific spatial locations (i.e. at the feeders). Because reward cells tend to fire at the feeder sites, an algorithm initially designed to make predictions about the rat's position in space can also tell us the probability that the rat's neural activity at that moment is representing the reward sites [10,13].
For each time step, we defined pFeeders as the mean of the probabilities of all the bins that constituted the feeder sites. All analyses divided the positional tracking data into a grid of 32 × 32 spatial bins (this includes the maze and adjacent space within the camera's field of view). Because the absolute values of the probabilities obtained depended on the number of spatial bins used (e.g. 16 × 16 versus 32 × 32), we included a normalization factor that kept pFeeders values constant, independent of the number of spatial bins used. To normalize for bin number (and thus bin size), we multiplied the pFeeders values from each session by the number of bins in which the rat spent any time in that session (occupancy greater than zero). This normalization procedure meant that the expected pFeeders values from a uniform posterior would be 1. Values greater than 1 indicate higher than chance levels of decoding to the feeders; values less than 1 indicate lower than chance levels of decoding to the feeders. Comparisons shown in figure 3 are made to pFeeders values derived from shuffled data (in which the spike order of each individual cell was randomized, maintaining the first-order spiking dynamics of the cell) [42]. For Bayesian decoding analyses, sessions were used only if they had at least five cells in OFC and five cells in vStr (85 sessions).
Figure 3.

Ensemble decoding to reward sites. Each row shows PETHs of Bayesian ensemble decoding to the feeder sites (normalized pFeeders). Only sessions with at least five cells in each structure were included in this analysis (n = 85 sessions). Lines represent the average across sessions, with error bars representing the standard error of the mean (s.e.m.). (a,b) Decoding for laps when the rat chose the non-delay side. ‘ZE’ indicates feeder zone entry (which coincides with choice point exit) and ‘FF’ indicates when the feeder fires the pellet reward. (c,e) Feeder site decoding for laps when the rat chose the delay side, aligned to feeder zone entry. Decoding remained high during the delay. (d,f) Decoding aligned to feeder fire (FF) while the rat waited at the delayed feeder site. Note that pFeeders values were high at the end of the delay, but still peaked slightly after the feeder click and pellet delivery. (Online version in colour.)
4. Results
(a). Behavioural results
We ran six rats on the spatial adjusting delay-discounting task. Rats showed robust titration of the adjusting delay to a preferred indifference point (electronic supplementary material, figure S1c). Thus, rats were sensitive to delay and tracked the economic value of reward. Rats also showed prominent VTE behaviour—looking back and forth at the decision point before making their choice (see electronic supplementary material, figure S4c,d for examples). VTE has been proposed as an indicator of deliberation and evaluation of options [27–29].
On the spatial delay-discounting task, VTE occurred most often during titration segments, when animals were changing the adjusting delay, and decreased during the exploitation segment, when animals were alternating sides (which kept the delay constant) [25]. Examining the distribution of alternation laps (which kept the delay constant) and the distribution of repeating laps (which adjusted the delay), we found that VTE laps were evenly distributed between alternation and repeating laps (proportion of VTE laps that were alternation laps = 0.51). By contrast, non-VTE laps were primarily alternation laps (proportion of non-VTE laps that were alternation laps = 0.86; figure 1c,d). This means that during the non-VTE laps, simply knowing where the rat was coming from provided a high degree of information about where he was going to; however, during VTE laps, knowing where the rat was coming from provided no information about where he was going to.
Thus, the spatial adjusting delay-discounting task elicited periods of both deliberative and non-deliberative behaviour within single sessions, allowing us to compare neural activity during these contrasting behavioural modes.
(b). Reward response
Previous neural recordings in OFC and vStr have demonstrated robust changes in neural firing to reward-associated cues and to reward receipt [10,13,43–46]. Consistent with these reports, a large fraction of single units modulated their firing rate around the time of reward delivery: 70.2% (665/947) of neurons in vStr and 68.5% (1201/1754) of neurons in OFC showed significant firing rate modulation during reward receipt (both feeders taken together, figure 2e,f). Single cell examples are shown for cells that either increased (figure 2a,b) or decreased (figure 2c,d) firing rate significantly, compared with baseline. Electronic supplementary material, figure S5 shows the firing rate of all vStr and OFC single units around the time of reward receipt for both feeders combined and for each feeder taken separately. Cells are ordered by their z-scored firing rate for both feeders during the 0–4 s reward window after feeder fire.
Figure 2.

Examples of reward-responsive cells. Example single unit recordings from vStr (a) and OFC (b) that showed a significant increase in firing rate around the time of reward receipt. Other cells showed a significant decrease in their firing rate around the time of reward receipt (c,d). The distribution of firing rates around the time of reward receipt is shown for all cells in vStr (n = 947) (e) and OFC (n = 1754) (f) in blue (black in print) and red (dark grey in print), respectively. Cells that significantly changed their firing rate (z-test, p < 0.05) compared with a bootstrap distribution (see Material and methods) are overlaid in green (light grey in print). (Online version in colour.)
Bayesian population decoding provides a principled way of combining the information encoded within the population of all the cells in an ensemble [47]. Many reward-responsive cells in our dataset decreased their firing rate in response to reward. One advantage of Bayesian decoding in this context is that decreases in spiking activity also contribute information to the measure of interest. For example, reduced firing rates in cells inhibited by reward will increase decoding to the feeder sites. In order to capture the information from all neurons within the ensemble, we applied a Bayesian decoding analysis to quantify the population dynamics of reward-site representations. We call this value pFeeders, as it reflects the strength of representation for both of the feeder sites [10,13]. Both vStr and OFC showed a dramatic rise in feeder site representation after the cue signalling the countdown to reward delivery and a second peak at reward receipt. Importantly, pFeeders remained high during the adjusting delay, indicating a sustained representation of the impending reward (figure 3). Thus, our Bayesian decoding method indicates that both vStr and OFC responded strongly to both the anticipation of reward and to reward receipt.
Theories of OFC and vStr function emphasize their role in coding reward, [10,13,18,48], and specifically in coding the magnitude of reward [6,17,23,49]. To test these ideas, we compared the firing rates of cells during reward receipt at the two feeders separately. Again, both increases and decreases in firing rate can convey information about reward. Thus, we examined both types of firing rate modulation.
Figure 4a,b plots the z-scored firing rate of all cells in response to the small (one pellet) versus the large (three pellets) reward receipt. If neurons in vStr and OFC code for reward, they should show a change in firing rate in the same direction to both the small and the large rewards (illustrated in figure 4c). Most cells changed their firing rate in the same direction (increasing to both feeders, or decreasing to both feeders), indicating that the populations in vStr and OFC coded for reward in a consistent manner (figure 4e,f: ‘same’ versus ‘diff’; binomial test p < 0.05). Among reward-coding cells that changed their firing rate in the same direction (‘same’), we then asked whether these neurons also coded for differences in reward magnitude; that is, differences in value. In other words, do these reward-coding cells also show a greater change in firing rate to the large reward than to the small reward (illustrated in figure 4d)? We found that among reward-coding cells, a significantly larger number of cells changed their firing rate more for the large reward (figure 4e,f: ‘value’ versus ‘anti’; binomial test, p < 0.05), indicating that vStr and OFC populations as a whole did show value coding on this task.
Figure 4.

Single cells code for reward and for value. Firing rate in response to reward at each feeder location for all vStr cells (n = 947) (a) and all OFC cells (n = 1754) (b). Cells that did not show a significant change in firing rate are displayed in black. Significance was determined by comparing reward responses to a bootstrapped distribution (see Material and methods). For significance, blue denotes large reward; green, small reward; magenta , both rewards (cell counts for all blue, green or magenta cells are shown within each of the six sectors); black, non-significant. (c) Diagram showing what reward coding should look like. Axes as in (a,b). If single cells are responsive to reward, they should either increase their firing rate at both feeders, or decrease their firing rate at both feeders (c(i): ‘same’, upper right and lower left quadrants). Firing rate changes in the opposite direction are incompatible with reward coding (c(ii): ‘diff’, upper left and lower right quadrants). (d) Diagram showing what value coding should look like. Axes as in (a,b). If neurons code not only for reward in general but also for the specific value of reward, then changes in firing rate should be greater for the three pellet reward than for the one pellet reward (d(i): ‘value’, |large|>|small|). Firing rate changes in the opposite direction are incompatible with value coding (d(ii): ‘anti’, |small|>|large|). (e,f) The left side of each bar graph shows the percentage of reward-responsive cells classified as reward coding (‘same’ versus ‘diff’). The right half of each bar graph shows the percentage of cells that demonstrated value coding (‘value’ versus ‘anti’). In both structures, significantly more cells coded for reward than not and for value than not (binomial test, p < 0.05). (Online version in colour.)
(c). Covert representation of reward during vicarious trial and error
The rats showed robust VTE behaviour at the choice point on the task, suggesting that the spatial delay-discounting task elicited periods of deliberative decision-making [25]. We also observed a very strong and temporally specific reward response in both OFC and vStr at the reward sites on the task (figures 2 and 3). In order to investigate the timing of reward-related representations during deliberative behaviour, we employed a Bayesian decoding algorithm that calculated the mean strength of feeder site representations (pFeeders) at each moment during the session [10,13]. Previous work on other spatial navigation tasks have identified covert representations of reward in vStr [10] and OFC [13] during deliberative pauses at the choice point (VTE laps), but not during fast passes through the choice point (non-VTE laps).
We found a substantial increase in the feeder site representations in vStr during VTE passes, when compared with non-VTE passes (figure 5a), akin to that seen by van der Meer & Redish [10]. The increase in feeder site decoding occurred before the auditory cues that signalled temporal delay (which occurred at choice point exit), and at a location separate from the physical site of reward. Therefore, this increased decoding to the reward sites represents a ‘covert’ representation of future reward. Importantly, pFeeders for vStr was significantly higher on VTE passes compared with non-VTE passes prior to the time of TurnAround (figure 5a). This indicates that the vStr started to show a reward-related representation during VTE before the rat turned towards the chosen side. Decoding was also significantly higher in OFC on VTE passes compared with non-VTE passes, but largely only after the time of TurnAround (figure 5b).
Figure 5.
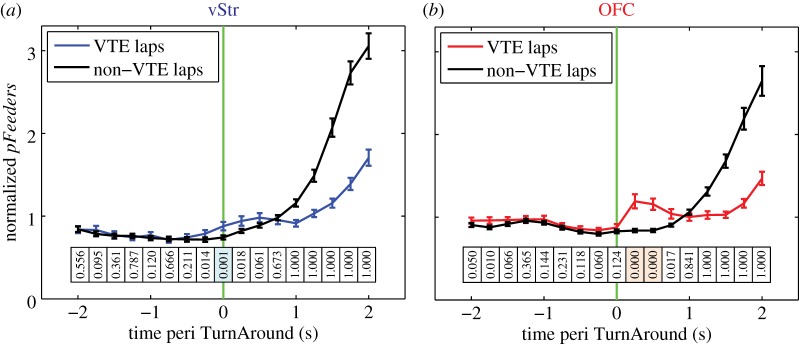
Increased decoding in vStr during VTE events. For each session with >5 cells in vStr and >5 cells in OFC (n = 85 sessions), we calculated the average decoding for VTE passes and for non-VTE passes within-session. Lines represent the average across sessions, with error bars representing the s.e.m. (a) Feeder site decoding for vStr. VTE passes are aligned to TurnAround (see Material and methods and electronic supplementary material, figure S4) and non-VTE passes are aligned to the MidPoint of the choice point trajectory. Statistics show paired t-test (right tailed) for each time bin, testing the hypothesis that VTE pFeeders was greater than non-VTE pFeeders, with a Bonferonni correction for 17 time bins and two conditions (VTE versus non-VTE) for α = 0.0015. p-Values are shown directly below each time bin in both (a) and (b). Time bins where VTE was significantly greater than non-VTE are indicated by blue and pink shading, for vStr and OFC, respectively. (b) Feeder site decoding for OFC. Statistical analysis as in (a). Decoding in OFC was significantly higher on VTE passes than on non-VTE passes, but only after the time of TurnAround and after the time of significant decoding in vStr. (Online version in colour.)
(d). Ventral striatum precedes orbitofrontal cortex in distinguishing the two feeder sites
Our data show an increase in pFeeders before the time of TurnAround in vStr, and after the time of TurnAround in OFC. This difference in timing of the feeder site representations between OFC and vStr suggests that vStr precedes OFC in outcome valuation during deliberative behaviour. However, a covert representation of reward does not necessarily indicate which action the rat ultimately will take (to go left or right). In order to determine whether the neural signals were informative of the rat's choices, we looked at the representation of each feeder site separately. If either vStr or OFC activity was more predictive of which action the rat would take, this difference should be reflected in differential representations of the chosen versus the unchosen feeder site.
The timing of these representational changes differed between VTE and non-VTE passes (figure 6). As noted in the behavioural results (above), non-VTE passes were almost exclusively alternating laps (figure 1c). As such, rats almost certainly already knew where they were going (to the opposite side) on non-VTE laps before starting the lap. Figure 6a shows that on non-VTE passes, the vStr representation preferentially encoded the chosen reward site over the unchosen reward site just after the MidPoint of the pass. Interestingly, vStr activity differentiated the zones before OFC activity did. As noted above, VTE passes were equally distributed between alternating and non-alternating (i.e. same-side, repeating/adjusting) laps (figure 1d). Figure 6b shows that on VTE laps, neither the vStr nor the OFC representation preferentially encoded the chosen reward site until after the rat had reoriented towards its final destination. However, vStr representations of the chosen outcome preceded OFC representations also in VTE passes.
Figure 6.
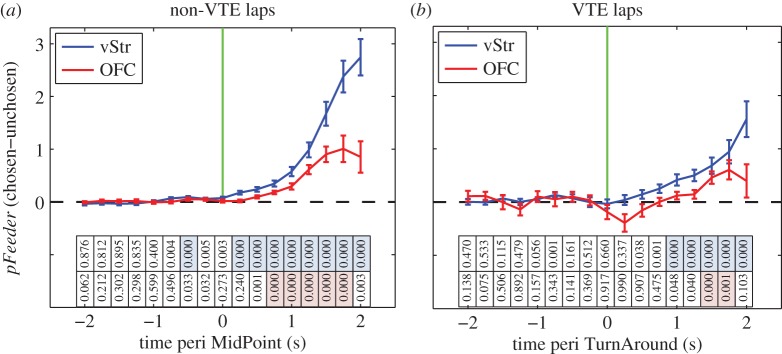
Separate feeder site representations during choice. Decoding values were averaged within session, as in figure 5. Lines represent the average across sessions, with error bars representing the s.e.m. (a) Decoding to the chosen feeder site minus decoding to the unchosen feeder site for non-VTE passes. The vertical green line marks the MidPoint time. Values above the dotted line indicate greater decoding to the chosen feeder site. Statistics show t-tests for each time bin, with the null hypothesis that pFeeder was not significantly greater than zero (right tailed), Bonferonni corrected for 17 time bins, two brain structures, and two behavioural conditions: α = 0.000735. p-Values are shown directly below each time bin in both (a) and (b). Time bins where pFeeder(chosen − unchosen) was significantly greater than zero are indicated by blue and pink shading, for vStr and OFC, respectively. (b) Chosen side minus unchosen side decoding for VTE passes. The vertical green line marks the TurnAround start time. Statistical analysis as in (a). Significant time bins for vStr preceded those for OFC on both non-VTE passes and VTE passes. (Online version in colour.)
Because the actual paths towards the final choice point may proceed through different spatial locations, any spatial information that is present in the vStr or OFC data could potentially generate the differences seen in figures 5 or 6. Although our previous analyses on similar spatial tasks have not found spatial information encoded within vStr or OFC ensembles [13,50], other experiments have found spatial relationships within vStr and OFC on other tasks [51,52]. In order to control for potential spatial confounds, we recalculated the covert reward analyses (figures 5 and 6) using the expected firing rate of each cell given the spatial location of the animal. (That is, we first calculated the spatial tuning curve of each cell, and then substituted the average firing rate of the cell at the current location of the rat for the actual firing rate of the cell in the Bayesian decoding analysis. This removed any information not derived from the actual location of the rat and controls for any spatial differences in the location of the rat during the pass through the choice point.) As can be seen in electronic supplementary material, figures S8 and S9, this spatial control removed the covert representations of reward during VTE passes and before TurnAround, implying that the increased representations of feeder sites was a covert representation of reward.
5. Discussion
We took dual-structure neural ensemble recordings from vStr and OFC as rats performed an economic decision-making task. Although others have found a great deal of overlap in the functional activity in vStr and OFC during decision-making [18,20,23,24], we found significant differences between the two structures in the timing of prospective reward-related and choice-related neural activity. We found that vStr exhibited a covert representation of reward before the moment of TurnAround during deliberative behavioural modes, akin to that seen by van der Meer & Redish [10]. We observed a similar increase for OFC, but it occurred after the moment of TurnAround, akin to that seen by Steiner & Redish [13]. Importantly, vStr also preceded OFC in distinguishing the two feeder sites before the animal made its choice. These results imply that vStr and OFC are engaged at different times during decision-making: vStr before the choice is made, and OFC afterwards. This dissociation in timing has implications for theories of orbitofrontal and ventral striatal function in decision-making.
On the spatial delay-discounting task, VTE behaviour occurred predominantly during early laps, when the rats were ‘titrating’ (changing) the adjusting delay. VTE frequency decreased later in the session as the rats' behaviour switched to an alternation strategy [25]. When VTE did occur, at whatever point in the session, rats chose a side with 50/50 probability (figure 1d); they were essentially undecided on entry into the choice point. This is in contrast to non-VTE laps, in which the rats almost always alternated sides (figure 1c). This pattern of behaviour allowed us to contrast deliberative with non-deliberative decision-making.
Comparing VTE with non-VTE passes, we observed an increase in the feeder site representation in vStr before the moment of TurnAround (figure 5a). This increase in feeder site representation during VTE supports the assertion that the vStr provides a covert reward signal selectively during deliberative decision-making [10]. In contrast to the timing of the covert reward signals in vStr, there was no increase in the feeder site representation in OFC until after the moment of TurnAround (figure 5b). Steiner & Redish found an increased feeder site representation in OFC immediately after reorientation events [13], in line with our results. Both experiments show that OFC representations of reward increased after the rat reoriented towards the goal. These data strongly suggest that OFC is signalling information about reward-related expectations after the animal has committed to its decision. Such a signal may represent information about the rat's choice after it has been made; for example, an expectation of reward [13], a representation of the state the animal is in [53,54] or a linkage between the chosen action and the eventual outcome [55]. Our data are consistent with human fMRI experiments that have found strong chosen-value signals in medial orbitofrontal cortex/ventromedial prefrontal cortex [56,57].
Covert reward-site representations during VTE were present before the moment of choice in vStr and after the moment of choice in OFC (figure 5). This suggests that information about the rat's impending action might also be differentially expressed in vStr and OFC. To address this question, we applied a second decoding analysis in order to compare the timing of choice-related signals in vStr and OFC. This analysis revealed that decoding to the chosen feeder site increased earlier in vStr than in OFC (figure 6), indicating that vStr first distinguished which feeder site the rat ultimately chose. This difference in timing is consistent with the previous result, namely that covert reward-related activity in vStr occurs before that seen in OFC. In both cases, neural activity reflecting the upcoming decision emerged earlier in vStr.
Our results about the role of OFC may seem at odds with established findings in the literature. Work by numerous laboratories have shown that OFC cells code for reward during a stimulus-sampling period [15,58,59]. In line with these results, a recent study found that the main effect of disturbing local circuitry in OFC (by blocking NMDA receptors) was to attenuate outcome-predictive activity specifically during the cue-sampling period [60]. On our task, reward-related representations in OFC emerged after the start of the TurnAround event, and presumably after the rat had made its decision to move to the chosen side.
An important difference between the above-mentioned studies and our task is that our task did not use conditioned stimuli to present the choice options—there was no experimenter-imposed stimulus-sampling period in the delay-discounting task. Because decisions can be made covertly, it is possible that the decision in these other tasks has already been made during the stimulus-sampling period, and the expectation encoded within OFC.
Our data do not exclude a role for OFC in generating reward expectancies in cued tasks. The reward-related signal in OFC in our data could also be considered an ‘expectancy’ of reward, which occurs after the animal has committed towards a goal. It may also be that OFC plays a different role in tasks such as ours that are largely instrumental (at least when considering choice point activity—before the tones), versus those that involve Pavlovian conditioned associations during the decision-making period [61]. However, our data do suggest that OFC is not merely involved in cue-based behaviour. The timing of OFC activity in our data provides a potential role for the OFC in signalling post-decisional information on an instrumental task.
Our data do not preclude a role for OFC in more complex value calculations, such as in sensory preconditioning [7] or devaluation [62] tasks. The value calculation in the delay-discounting task used here is relatively simple—it depends upon a single comparison between magnitude and delay. Our data imply that vStr value representations precede OFC value representations in this simple task. Whether this order might be reversed in more complicated value calculations is an intriguing but open question.
A factor worth considering that could impact our results is the anatomical location of our recordings. Recent studies have brought to light functional differences between the medial and lateral subregions of the OFC, in both the rat [63–65] and primate [66–68]. Our recordings were taken from lateral OFC. One theme that has emerged from the work on regionalization in OFC is that the lateral OFC seems to be more involved in reward-credit assignment; that is, linking action to subsequent reward [55,67]. Our data are consistent with this interpretation.
Our data are also consistent with the OFC playing a role in model-based behaviour. Work from the Schoenbaum laboratory has shown a role for OFC specifically in ‘model-based’ behaviour [7,9,69,70]—behaviour that requires knowledge about what state the animal is in (e.g. what phase of the task), and, importantly, explicit expectancies about the value of reward that should be anticipated from selecting different actions. Although we do not see covert reward signalling in OFC before the animal commits to its choice, we do see an increase in OFC after the time of commitment (figures 5 and 6), presumably entailing the rat entering a state of expectation. Our data and that from Steiner & Redish [13] are consistent with the OFC signalling an expectancy of reward during model-based (deliberative) behaviour, albeit after the moment of choice in these tasks. It is also consistent with evidence that OFC provides information to the ventral tegmental area about expected reward value of the chosen action that is essential for generating reward prediction errors during both model-free and model-based behaviour [53].
We found important differences in the timing of ventral striatal (vStr) and orbitofrontal (OFC) representations during decision-making processes. Covert reward-site representations during VTE emerged earlier in vStr than in OFC (figure 5). Additionally, signals informative of the animal's impending choice emerged earlier in vStr than in OFC (figure 6). The increase in feeder site representation in vStr during VTE supports the idea that vStr provides reward-related information during deliberative decision-making [9,10], and may be involved in an active look-ahead process; that is, evaluating potential rewards during outcome-guided decision-making [71]. Taken together, these results suggest that prospective decision variables are encoded by vStr. Signals in OFC emerged after the rat had made its decision, possibly encoding information about the value of the chosen action. These data emphasize the importance of vStr activity in planning actions during deliberative behaviour and argues for the incorporation of vStr into network models of deliberative decision-making.
Supplementary Material
Acknowledgements
We thank Chris Boldt and Kelsey Seeland for technical support, Andrew E. Papale for assistance with behavioural analyses and the other members of the Redish laboratory for useful discussion.
All procedures were conducted in accordance with the National Institutes of Health guidelines for animal care and approved by the Institutional Animal Care and Use Committee (IACUC) at the University of Minnesota.
Funding statement
This research was supported by: NIDA R01-DA030672.
References
- 1.Daw ND, Doya K. 2006. The computational neurobiology of learning and reward. Curr. Opin. Neurobiol. 16, 199–204. ( 10.1016/j.conb.2006.03.006) [DOI] [PubMed] [Google Scholar]
- 2.Haber SN, Knutson B. 2010. The reward circuit: linking primate anatomy and human imaging. Neuropsychopharmacology 35, 4–26. ( 10.1038/npp.2009.129) [DOI] [PMC free article] [PubMed] [Google Scholar]
- 3.Kable JW, Glimcher PW. 2009. The neurobiology of decision: consensus and controversy. Neuron 63, 733–745. ( 10.1016/j.neuron.2009.09.003) [DOI] [PMC free article] [PubMed] [Google Scholar]
- 4.Lee D, Seo H, Jung MW. 2012. Neural basis of reinforcement learning and decision making. Annu. Rev. Neurosci. 35, 287–308. ( 10.1146/annurev-neuro-062111-150512) [DOI] [PMC free article] [PubMed] [Google Scholar]
- 5.Rangel A, Camerer C, Montague PR. 2008. A framework for studying the neurobiology of value-based decision making. Nat. Rev. Neurosci. 9, 545–556. ( 10.1038/nrn2357) [DOI] [PMC free article] [PubMed] [Google Scholar]
- 6.van Duuren E, Lankelma J, Pennartz CMA. 2008. Population coding of reward magnitude in the orbitofrontal cortex of the rat. J. Neurosci. 28, 8590–8603. ( 10.1523/JNEUROSCI.5549-07.2008) [DOI] [PMC free article] [PubMed] [Google Scholar]
- 7.Jones JL, Esber GR, McDannald MA, Gruber AJ, Hernandez A, Mirenzi A, Schoenbaum G. 2012. Orbitofrontal cortex supports behavior and learning using inferred but not cached values. Science 338, 953–956. ( 10.1126/science.1227489) [DOI] [PMC free article] [PubMed] [Google Scholar]
- 8.Lansink CS, Goltstein PM, Lankelma JV, Joosten RN, McNaughton BL, Pennartz CM. 2008. Preferential reactivation of motivationally relevant information in the ventral striatum. J. Neurosci. 28, 6372–6382. ( 10.1523/JNEUROSCI.1054-08.2008) [DOI] [PMC free article] [PubMed] [Google Scholar]
- 9.McDannald MA, Lucantonio F, Burke KA, Niv Y, Schoenbaum G. 2011. Ventral striatum and orbitofrontal cortex are both required for model-based, but not model-free, reinforcement learning. J. Neurosci. 31, 2700–2705. ( 10.1523/JNEUROSCI.5499-10.2011) [DOI] [PMC free article] [PubMed] [Google Scholar]
- 10.van der Meer MA, Redish AD. 2009. Covert expectation-of-reward in rat ventral striatum at decision points. Front. Integr. Neurosci. 3, 1 ( 10.3389/neuro.07.001.2009) [DOI] [PMC free article] [PubMed] [Google Scholar]
- 11.van der Meer MA, Kurth-Nelson Z, Redish AD. 2012. Information processing in decision-making systems. The Neuroscientist 18, 342–359. ( 10.1177/1073858411435128) [DOI] [PMC free article] [PubMed] [Google Scholar]
- 12.Padoa-Schioppa C, Cai X. 2011. The orbitofrontal cortex and the computation of subjective value: consolidated concepts and new perspectives. Ann. NY Acad. Sci. 1239, 130–137. ( 10.1111/j.1749-6632.2011.06262.x) [DOI] [PMC free article] [PubMed] [Google Scholar]
- 13.Steiner AP, Redish AD. 2012. The road not taken: neural correlates of decision making in orbitofrontal cortex. Front. Neurosci. 6, 131 ( 10.3389/fnins.2012.00131) [DOI] [PMC free article] [PubMed] [Google Scholar]
- 14.van Duuren E, van der Plasse G, Lankelma J, Joosten RN, Feenstra MGP, Pennartz CMA. 2009. Single-cell and population coding of expected reward probability in the orbitofrontal cortex of the rat. J. Neurosci. 29, 8965–8976. ( 10.1523/JNEUROSCI.0005-09.2009) [DOI] [PMC free article] [PubMed] [Google Scholar]
- 15.van Duuren E, Escámez FAN, Joosten RN, Visser R, Mulder AB, Pennartz CMA. 2007. Neural coding of reward magnitude in the orbitofrontal cortex of the rat during a five-odor olfactory discrimination task. Learn. Mem. 14, 446–456. ( 10.1101/lm.546207) [DOI] [PMC free article] [PubMed] [Google Scholar]
- 16.Breiter HC, Aharon I, Kahneman D, Dale A, Shizgal P. 2001. Functional imaging of neural responses to expectancy and experience of monetary gains and losses. Neuron 30, 619–639. ( 10.1016/S0896-6273(01)00303-8) [DOI] [PubMed] [Google Scholar]
- 17.Knutson B, Adams CM, Fong GW, Hommer D. 2001. Anticipation of increasing monetary reward selectively recruits nucleus accumbens. J. Neurosci. 21, RC159. [DOI] [PMC free article] [PubMed] [Google Scholar]
- 18.Knutson B, Taylor J, Kaufman M, Peterson R, Glover G. 2005. Distributed neural representation of expected value. J. Neurosci. 25, 4806–4812. ( 10.1523/JNEUROSCI.0642-05.2005) [DOI] [PMC free article] [PubMed] [Google Scholar]
- 19.O'Doherty JP. 2004. Reward representations and reward-related learning in the human brain: insights from neuroimaging. Curr. Opin. Neurobiol. 14, 769–776. ( 10.1016/j.conb.2004.10.016) [DOI] [PubMed] [Google Scholar]
- 20.Kable JW, Glimcher PW. 2007. The neural correlates of subjective value during intertemporal choice. Nat. Neurosci. 10, 1625–1633. ( 10.1038/nn2007) [DOI] [PMC free article] [PubMed] [Google Scholar]
- 21.Levy I, Snell J, Nelson AJ, Rustichini A, Glimcher PW. 2010. Neural representation of subjective value under risk and ambiguity. J. Neurophysiol. 103, 1036–1047. ( 10.1152/jn.00853.2009) [DOI] [PubMed] [Google Scholar]
- 22.McClure SM, Laibson DI, Loewenstein G, Cohen JD. 2004. Separate neural systems value immediate and delayed monetary rewards. Science 306, 503–507. ( 10.1126/science.1100907) [DOI] [PubMed] [Google Scholar]
- 23.Diekhof EK, Kaps L, Falkai P, Gruber O. 2012. The role of the human ventral striatum and the medial orbitofrontal cortex in the representation of reward magnitude: an activation likelihood estimation meta-analysis of neuroimaging studies of passive reward expectancy and outcome processing. Neuropsychologia 50, 1252–1266. ( 10.1016/j.neuropsychologia.2012.02.007) [DOI] [PubMed] [Google Scholar]
- 24.Levy DJ, Glimcher PW. 2012. The root of all value: a neural common currency for choice. Curr. Opin. Neurobiol. 22, 1027–1038. ( 10.1016/j.conb.2012.06.001) [DOI] [PMC free article] [PubMed] [Google Scholar]
- 25.Papale AE, Stott JJ, Powell NJ, Regier PS, Redish AD. 2012. Interactions between deliberation and delay-discounting in rats. Cogn. Affect. Behav. Neurosci. 12, 513–526. ( 10.3758/s13415-012-0097-7) [DOI] [PMC free article] [PubMed] [Google Scholar]
- 26.Muenzinger KF. 1938. Vicarious trial and error at a point of choice. I. A general survey of its relation to learning efficiency. Pedagog. Semin. J. Genet. Psychol. 53, 75–86. ( 10.1080/08856559.1938.10533799) [DOI] [Google Scholar]
- 27.Tolman EC. 1939. Prediction of vicarious trial and error by means of the schematic sowbug. Psychol. Rev. 46, 318–336. ( 10.1037/h0057054) [DOI] [Google Scholar]
- 28.Tolman EC. 1948. Cognitive maps in rats and men. Psychol. Rev. 55, 189–208. ( 10.1037/h0061626) [DOI] [PubMed] [Google Scholar]
- 29.Johnson A, van der Meer MA, Redish AD. 2007. Integrating hippocampus and striatum in decision-making. Curr. Opin. Neurobiol. 17, 692–697. ( 10.1016/j.conb.2008.01.003) [DOI] [PMC free article] [PubMed] [Google Scholar]
- 30.Nicola SM. 2010. The flexible approach hypothesis: unification of effort and cue-responding hypotheses for the role of nucleus accumbens dopamine in the activation of reward-seeking behavior. J. Neurosci. 30, 16 585–16 600. ( 10.1523/JNEUROSCI.3958-10.2010) [DOI] [PMC free article] [PubMed] [Google Scholar]
- 31.Johnson A, Redish AD. 2007. Neural ensembles in CA3 transiently encode paths forward of the animal at a decision point. J. Neurosci. 27, 12 176–12 189. ( 10.1523/JNEUROSCI.3761-07.2007) [DOI] [PMC free article] [PubMed] [Google Scholar]
- 32.Yin HH, Knowlton BJ, Balleine BW. 2004. Lesions of dorsolateral striatum preserve outcome expectancy but disrupt habit formation in instrumental learning. Eur. J. Neurosci. 19, 181–189. ( 10.1111/j.1460-9568.2004.03095.x) [DOI] [PubMed] [Google Scholar]
- 33.Yin HH, Knowlton BJ. 2006. The role of the basal ganglia in habit formation. Nat. Rev. Neurosci. 7, 464–476. ( 10.1038/nrn1919) [DOI] [PubMed] [Google Scholar]
- 34.Graybiel AM. 2008. Habits, rituals, and the evaluative brain. Annu. Rev. Neurosci. 31, 359–387. ( 10.1146/annurev.neuro.29.051605.112851) [DOI] [PubMed] [Google Scholar]
- 35.Schmitzer-Torbert NC, Redish AD. 2004. Neuronal activity in the rodent dorsal striatum in sequential navigation: separation of spatial and reward responses on the multiple T task. J. Neurophysiol. 91, 2259–2272. ( 10.1152/jn.00687.2003) [DOI] [PubMed] [Google Scholar]
- 36.Paxinos G, Watson C. 1998. The rat brain: in stereotaxic coordinates, 4th edn New York, NY: Academic Press. [Google Scholar]
- 37.Kadir SN, Goodman DFM, Harris KD. 2013. High-dimensional cluster analysis with the masked EM algorithm http://arxiv.org/abs/1309.2848.
- 38.Hart WE, Goldbaum M, Côté B, Kube P, Nelson MR. 1999. Measurement and classification of retinal vascular tortuosity. Int. J. Med. Inf. 53, 239–252. ( 10.1016/S1386-5056(98)00163-4) [DOI] [PubMed] [Google Scholar]
- 39.Janabi-Sharifi F, Hayward V, Chen C. 2000. Discrete-time adaptive windowing for velocity estimation. IEEE Trans. Control Syst. Technol. 8, 1003–1009. ( 10.1109/87.880606) [DOI] [Google Scholar]
- 40.Masimore B, Schmitzer-Torbert NC, Kakalios J, Redish AD. 2005. Transient striatal gamma local field potentials signal movement initiation in rats. Neuroreport 16, 2021–2024. ( 10.1097/00001756-200512190-00010) [DOI] [PubMed] [Google Scholar]
- 41.Zhang K, Ginzburg I, McNaughton BL, Sejnowski TJ. 1998. Interpreting neuronal population activity by reconstruction: unified framework with application to hippocampal place cells. J. Neurophysiol. 79, 1017–1044. [DOI] [PubMed] [Google Scholar]
- 42.Jackson JC, Johnson A, Redish AD. 2006. Hippocampal sharp waves and reactivation during awake states depend on repeated sequential experience. J. Neurosci. 26, 12 415–12 426. ( 10.1523/JNEUROSCI.4118-06.2006) [DOI] [PMC free article] [PubMed] [Google Scholar]
- 43.Lavoie AM, Mizumori SJ. 1994. Spatial, movement- and reward-sensitive discharge by medial ventral striatum neurons of rats. Brain Res. 638, 157–168. ( 10.1016/0006-8993(94)90645-9) [DOI] [PubMed] [Google Scholar]
- 44.Roesch MR, Stalnaker TA, Schoenbaum G. 2007. Associative encoding in anterior piriform cortex versus orbitofrontal cortex during odor discrimination and reversal learning. Cereb. Cortex 17, 643–652. ( 10.1093/cercor/bhk009) [DOI] [PMC free article] [PubMed] [Google Scholar]
- 45.Schoenbaum G, Chiba AA, Gallagher M. 1998. Orbitofrontal cortex and basolateral amygdala encode expected outcomes during learning. Nat. Neurosci. 1, 155–159. ( 10.1038/407) [DOI] [PubMed] [Google Scholar]
- 46.Setlow B, Schoenbaum G, Gallagher M. 2003. Neural encoding in ventral striatum during olfactory discrimination learning. Neuron 38, 625–636. ( 10.1016/S0896-6273(03)00264-2) [DOI] [PubMed] [Google Scholar]
- 47.Rieke F, Warland D, de Ruyter van Steveninck R, Bialek W. 1997. Spikes: exploring the neural code. Cambridge, MA: MIT Press. [Google Scholar]
- 48.Gallagher M, McMahan RW, Schoenbaum G. 1999. Orbitofrontal cortex and representation of incentive value in associative learning. J. Neurosci. 19, 6610–6614. [DOI] [PMC free article] [PubMed] [Google Scholar]
- 49.Schultz W, Apicella P, Scarnati E, Ljungberg T. 1992. Neuronal activity in monkey ventral striatum related to the expectation of reward. J. Neurosci. 12, 4595–4610. [DOI] [PMC free article] [PubMed] [Google Scholar]
- 50.van der Meer MA, Johnson A, Schmitzer-Torbert NC, Redish AD. 2010. Triple dissociation of information processing in dorsal striatum, ventral striatum, and hippocampus on a learned spatial decision task. Neuron 67, 25–32. ( 10.1016/j.neuron.2010.06.023) [DOI] [PMC free article] [PubMed] [Google Scholar]
- 51.Feierstein CE, Quirk MC, Uchida N, Sosulski DL, Mainen ZF. 2006. Representation of spatial goals in rat orbitofrontal cortex. Neuron 51, 495–507. ( 10.1016/j.neuron.2006.06.032) [DOI] [PubMed] [Google Scholar]
- 52.German PW, Fields HL. 2007. Rat nucleus accumbens neurons persistently encode locations associated with morphine reward. J. Neurophysiol. 97, 2094–2106. ( 10.1152/jn.00304.2006) [DOI] [PubMed] [Google Scholar]
- 53.Takahashi YK, Roesch MR, Wilson RC, Toreson K, O'Donnell P, Niv Y, Schoenbaum G. 2011. Expectancy-related changes in firing of dopamine neurons depend on orbitofrontal cortex. Nat. Neurosci. 14, 1590–1597. ( 10.1038/nn.2957) [DOI] [PMC free article] [PubMed] [Google Scholar]
- 54.Wilson RC, Takahashi YK, Schoenbaum G, Niv Y. 2014. Orbitofrontal cortex as a cognitive map of task space. Neuron 81, 267–279. ( 10.1016/j.neuron.2013.11.005) [DOI] [PMC free article] [PubMed] [Google Scholar]
- 55.Walton ME, Behrens TE, Noonan MP, Rushworth MF. 2011. Giving credit where credit is due: orbitofrontal cortex and valuation in an uncertain world. Ann. NY Acad. Sci. 1239, 14–24. ( 10.1111/j.1749-6632.2011.06257.x) [DOI] [PubMed] [Google Scholar]
- 56.Wunderlich K, Rangel A, O'Doherty JP. 2009. Neural computations underlying action-based decision making in the human brain. Proc. Natl Acad. Sci. USA 106, 17 199–17 204. ( 10.1073/pnas.0901077106) [DOI] [PMC free article] [PubMed] [Google Scholar]
- 57.Larsen T, O'Doherty JP. 2014. Uncovering the spatio-temporal dynamics of value-based decision-making in the human brain: a combined fMRI–EEG study. Phil. Trans. R. Soc. B 369, 20130473 ( 10.1098/rstb.2013.0473) [DOI] [PMC free article] [PubMed] [Google Scholar]
- 58.Padoa-Schioppa C, Assad JA. 2006. Neurons in the orbitofrontal cortex encode economic value. Nature 441, 223–226. ( 10.1038/nature04676) [DOI] [PMC free article] [PubMed] [Google Scholar]
- 59.Tremblay L, Schultz W. 1999. Relative reward preference in primate orbitofrontal cortex. Nature 398, 704–708. ( 10.1038/19525) [DOI] [PubMed] [Google Scholar]
- 60.van Wingerden M, Vinck M, Tijms V, Ferreira IRS, Jonker AJ, Pennartz CMA. 2012. NMDA receptors control cue-outcome selectivity and plasticity of orbitofrontal firing patterns during associative stimulus-reward learning. Neuron 76, 813–825. ( 10.1016/j.neuron.2012.09.039) [DOI] [PubMed] [Google Scholar]
- 61.Ostlund SB, Balleine BW. 2007. Orbitofrontal cortex mediates outcome encoding in Pavlovian but not instrumental conditioning. J. Neurosci. 27, 4819–4825. ( 10.1523/JNEUROSCI.5443-06.2007) [DOI] [PMC free article] [PubMed] [Google Scholar]
- 62.West EA, DesJardin JT, Gale K, Malkova L. 2011. Transient inactivation of orbitofrontal cortex blocks reinforcer devaluation in macaques. J. Neurosci. 31, 15 128–15 135. ( 10.1523/JNEUROSCI.3295-11.2011) [DOI] [PMC free article] [PubMed] [Google Scholar]
- 63.Fuchs RA, Evans KA, Parker MP, See RE. 2004. Differential involvement of orbitofrontal cortex subregions in conditioned cue-induced and cocaine-primed reinstatement of cocaine seeking in rats. J. Neurosci. 24, 6600–6610. ( 10.1523/JNEUROSCI.1924-04.2004) [DOI] [PMC free article] [PubMed] [Google Scholar]
- 64.Mar AC, Walker ALJ, Theobald DE, Eagle DM, Robbins TW. 2011. Dissociable effects of lesions to orbitofrontal cortex subregions on impulsive choice in the rat. J. Neurosci. 31, 6398–6404. ( 10.1523/JNEUROSCI.6620-10.2011) [DOI] [PMC free article] [PubMed] [Google Scholar]
- 65.Stopper CM, Green EB, Floresco SB. 2014. Selective involvement by the medial orbitofrontal cortex in biasing risky, but not impulsive, choice. Cereb. Cortex 24, 154–162. ( 10.1093/cercor/bhs297) [DOI] [PubMed] [Google Scholar]
- 66.Walton ME, Behrens TEJ, Buckley MJ, Rudebeck PH, Rushworth MFS. 2010. Separable learning systems in the macaque brain and the role of orbitofrontal cortex in contingent learning. Neuron 65, 927–939. ( 10.1016/j.neuron.2010.02.027) [DOI] [PMC free article] [PubMed] [Google Scholar]
- 67.Noonan MP, Walton ME, Behrens TEJ, Sallet J, Buckley MJ, Rushworth MFS. 2010. Separate value comparison and learning mechanisms in macaque medial and lateral orbitofrontal cortex. Proc. Natl Acad. Sci. USA 107, 20 547–20 552. ( 10.1073/pnas.1012246107) [DOI] [PMC free article] [PubMed] [Google Scholar]
- 68.Noonan MP, Mars RB, Rushworth MFS. 2011. Distinct roles of three frontal cortical areas in reward-guided behavior. J. Neurosci. 31, 14 399–14 412. ( 10.1523/JNEUROSCI.6456-10.2011) [DOI] [PMC free article] [PubMed] [Google Scholar]
- 69.McDannald MA, Takahashi YK, Lopatina N, Pietras BW, Jones JL, Schoenbaum G. 2012. Model-based learning and the contribution of the orbitofrontal cortex to the model-free world. Eur. J. Neurosci. 35, 991–996. ( 10.1111/j.1460-9568.2011.07982.x) [DOI] [PMC free article] [PubMed] [Google Scholar]
- 70.Schoenbaum G, Roesch MR, Stalnaker TA, Takahashi YK. 2009. A new perspective on the role of the orbitofrontal cortex in adaptive behaviour. Nat. Rev. Neurosci. 10, 885–892. ( 10.1038/nrn2753) [DOI] [PMC free article] [PubMed] [Google Scholar]
- 71.van der Meer MA, Redish AD. 2010. Expectancies in decision making, reinforcement learning, and ventral striatum. Front. Neurosci. 4, 6 ( 10.3389/neuro.01.006.2010) [DOI] [PMC free article] [PubMed] [Google Scholar]
Associated Data
This section collects any data citations, data availability statements, or supplementary materials included in this article.