

Abstract
While there is a growing body of functional magnetic resonance imaging (fMRI) evidence implicating a corpus of brain regions in value-based decision-making in humans, the limited temporal resolution of fMRI cannot address the relative temporal precedence of different brain regions in decision-making. To address this question, we adopted a computational model-based approach to electroencephalography (EEG) data acquired during a simple binary choice task. fMRI data were also acquired from the same participants for source localization. Post-decision value signals emerged 200 ms post-stimulus in a predominantly posterior source in the vicinity of the intraparietal sulcus and posterior temporal lobe cortex, alongside a weaker anterior locus. The signal then shifted to a predominantly anterior locus 850 ms following the trial onset, localized to the ventromedial prefrontal cortex and lateral prefrontal cortex. Comparison signals between unchosen and chosen options emerged late in the trial at 1050 ms in dorsomedial prefrontal cortex, suggesting that such comparison signals may not be directly associated with the decision itself but rather may play a role in post-decision action selection. Taken together, these results provide us new insights into the temporal dynamics of decision-making in the brain, suggesting that for a simple binary choice task, decisions may be encoded predominantly in posterior areas such as intraparietal sulcus, before shifting anteriorly.
Keywords: decision-making, reinforcement learning, model based, EEG
1. Introduction
Considerable progress has been made in uncovering the brain systems involved in encoding predictions about future rewards and in using those predictions to guide behaviour [1–5]. Studies in both humans and other animals have identified contributions for a number of brain regions in valuation, learning and choice. Within the cortex, three regions that have received particular attention are the ventromedial prefrontal cortex (vmPFC) composed of medial orbital and adjacent medial prefrontal cortex, the lateral intraparietal sulcus (LIP) and the dorsomedial prefrontal cortex (dmPFC) extending from the anterior cingulate cortex dorsally along the medial wall. These regions have been found to encode value signals for decision options and actions [6–8], as well as signals corresponding to the difference in value between actions and/or options that are ultimately chosen versus those that are not [9–11]. However, the precise functions of these regions in the decision-making process remain controversial, particularly as regards where value signals from different options are ultimately compared in order to generate a choice. One possibility that has been proposed is that the vmPFC is involved in comparing stimulus values in order to generate a decision in at least certain types of choice processes [12]. Another viewpoint suggests that the comparison between the values of possible actions in order to yield a decision over which action to ultimately select is mediated within LIP [6,13], whereas yet another viewpoint has implicated the dmPFC in the choice process [10,11].
Distinguishing between these different possible accounts is challenging. One way to potentially address this question would be to determine when these different brain areas become engaged during the evolving temporal dynamics of the choice process. More specifically, if computational signals related to the choice process can be found to emerge earlier in one region than the other, this might provide relevant information about which brain region is initially involved in computing the choice. When using functional magnetic resonance imaging (fMRI), it is not feasible to determine reliable information about the relative timing of decision signals because of the relatively poor temporal resolution of the blood-oxygen-level dependent signal alongside confounding variability in neurohaemodynamic coupling between regions. Techniques such as electroencephalography (EEG, and magnetoencephalography, MEG) offer much better temporal resolution, and are therefore better candidates for non-invasive measurement of the temporal sequencing of decision-related signals [13–15]. However, such methods suffer from poor spatial resolution arising from pervasive difficulties in ascertaining the location of the underlying neural sources. One way to potentially resolve the spatial localization weakness of EEG is to combine this method with fMRI, and acquire both types of data in the same participants, using the spatial evidence acquired from the fMRI data to constrain the source localization of the EEG data, while acquiring the necessary evidence about the timing of neural processes from the EEG measurements.
In the present study, we use a computational model-based approach in combination with EEG measurements acquired from a group of participants performing a simple binary choice task to detect computational signals pertaining to the decision-process with sufficient temporal resolution to determine when these signals emerge in different brain areas. Furthermore, we used fMRI data acquired in the same group of participants to inform the spatial localization of the EEG data. Previous fMRI evidence from our own group found that the dmPFC showed evidence of value comparison signals that could underpin the decision process itself, whereas the vmPFC and LIP showed evidence of chosen value signals corresponding to the value of the option that is ultimately chosen [10,11]. On the basis of this fMRI evidence, we hypothesized that we would find evidence for similar signals in our EEG data, and that moreover these signals would emerge at different times in the choice process. The value comparison signal was predicted to emerge earlier in time within a trial, after the participant is presented with the options available but before the participant makes a behavioural choice, because this signal is a putative correlate of the actual choice process itself, whereas the chosen value signal was predicted to emerge later in the trial as such a signal reflects the consequence of the choice process. We further hypothesized on the basis of our prior fMRI evidence that the value comparison and chosen value signals would be differentially localized to the dmPFC and the vmPFC and LIP, respectively.
2. Methods
(a). Participants
Forty-one right-handed participants (19 males, average age 22) participated in the EEG experiment. The experiments were conducted at Trinity College Institute of Neuroscience, Trinity College Dublin, Ireland. Of those EEG participants, 35 (16 males) also participated in an fMRI study using exactly the same task. Nineteen of the 41 participants took part in the EEG experiment first, whereas the other 22 took part in the fMRI experiment first. The gap between the EEG and fMRI experiments was 13–15 days for most participants; however, for six participants, it was 20–21 days, and for two participants, it was 5 weeks.
(b). Task description
On each trial (figure 1), the participant is presented with two easily distinguishable decision options (coloured circles on black background), one on each side of a monitor, and is tasked with making a choice between them in order to obtain monetary rewards. To reduce the possibility that the participant makes a decision in advance of the options being presented on a particular trial, three decision options were used in total, two of which are then selected at random on a given trial. Thus, a participant does not know in advance which two decision options will be presented in advance of the onset of a particular decision trial.
Figure 1.
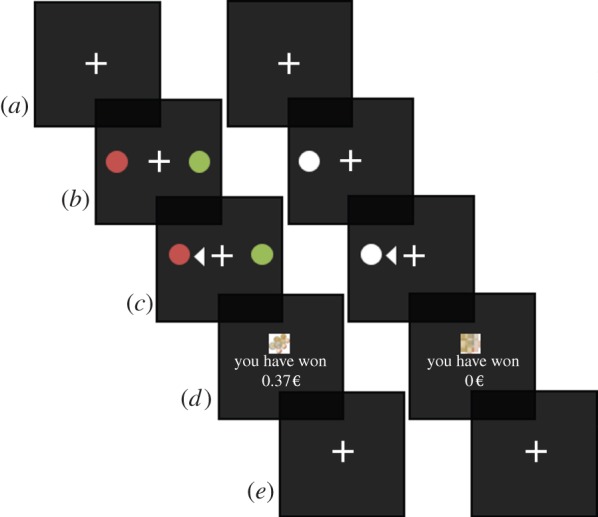
Task illustration. For both choice trials (left) and neutral no-choice trials (right) one trial of the task consists of four phases. (a,e) Intertrial interval (ITI) of 2–9 s uniformly distributed. (b) Choice(s) displayed on screen for maximum 2 s. (c) Participants make their choice and the choice is displayed for 2.5 s. (d) The outcome of the trial is displayed for 1 s with the winning amount in euros and a picture of either euro coins (win), euro coins crossed out (no win) or a scrambled image (no-choice trials). (2-Reaction time) (2-RT) seconds are added to the ITI to ensure mean trial time is 11 s. One block of trials consists of 72 choice trials and 24 no-choice trials totalling 17.6 min. Participants complete three blocks of trials. (Online version in colour.)
On each particular trial, the decision options presented on that trial are randomly presented on either the left or the right of the screen, so as to enable value signals to the decision options per se to be disambiguated from value signals pertaining to particular actions. For the purpose of obtaining a neutral baseline, on 25% of the trials, a single white target was presented, followed by non-rewarding outcome.
Each decision option has a drifting probability of reward independent of the others. To ensure that the underlying reward distributions attached to each decision option are distinguishable enough for the participants to learn independently, three sets of three drifting probabilities (one set per block of trials) were created as noisy sine waves with a period between π and 2π, and with starting points distributed evenly (for an example set, see figure 2a). The participant indicates his/her choice by pressing a button with their left or right hand. Left choices were made with the left hand, right choices with the right hand.
Figure 2.
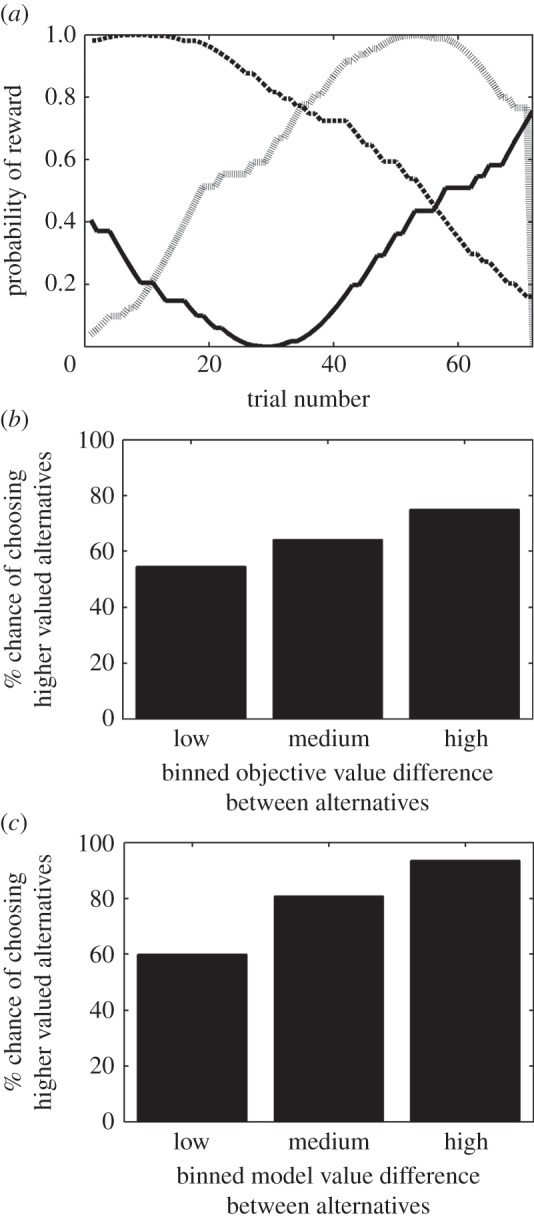
(a) Example of the reward contingencies used in the task for each of the alternatives (shown in different line types) over one block of trials. (b) Percentage of trials participants choose the objectively higher-valued alternative, binned by the difference in objective values between the two alternatives presented on a given trial. (c) Percentage of trials participants choose the subjectively higher-valued alternative, binned by difference in model-predicted values between the two alternatives on a given trial.
A single trial consists of the following (see figure 1 for more details):
(1) A fixation cross presented for 1 s with no targets present will indicate that a choice is coming up. After the first trial, this will be part of the intertrial interval (ITI) screen.
(2) A choice screen (maximum duration 2 s) during which the two decision options (or else the single option on the neutral trials) are presented. The participant is required to indicate their choice by means of a button press. The fixation cross remains present. If the participant fails to respond in 2 s, the trial terminates and the remaining trial time is added to the ITI.
(3) After a choice is made, a white triangle appears pointing in the direction of the chosen option, thereby signalling the choice made. This screen is shown for 2.5 s.
An outcome screen is then presented for 1 s. On trials in which rewards are obtained, the reward is denoted by text indicating the amount won alongside a small picture of some euro coins. The ‘non-reward’ screen is visually similar, but has a red cross over the euro coins. For the neutral trials, a scrambled euro picture is shown at the time of outcome presentation.
(4) An ITI follows, with a duration randomized between trials with a uniform distribution between 2 and 9 s. The fixation cross is present.
We ran two versions of the experiment. In the one version, participants were presented with a fixed outcome of 0.25 euros, on each trial in which a reward was delivered. The other version of the experiment involved variable reward outcomes, centred on 0.25, but drawn from a uniform distribution (range: 0.1–0.4). Twenty participants took part in the first version of the experiment, whereas 21 participants took part in the second version. The two experimental versions were otherwise identical. In order to maximize statistical power, and because the differences in the outcome distributions are not pertinent for the hypotheses tested in the present manuscript, we combined the data across both groups when performing the analyses and presenting the results shown here.
(c). EEG and fMRI recordings
The 512 Hz EEG data were acquired at Trinity College Institute of Neuroscience using a Biosemi 128 + 2 channel cap system with eight flat-type active electrodes (six facials, two mastoids). At the start of each recording session, each connection was stable with offsets within a ±25 mV range. Data were recorded unreferenced and unfiltered with ActiView software.
The fMRI data were acquired using a Philips Achieva 3T scanner, also located at Trinity College Institute of Neuroscience. Scan parameters were optimized to obtain robust signals in vmPFC, but also to allow whole brain coverage: 45 slices recorded at a 30° angle, repetition time (TR) = 2.5 s, echo time (TE) = 28 ms, voxel size 3 × 3 × 3.35 mm, 440 volumes for each of the three experimental sessions. In addition, a 1 mm isotropic T1-weighted structural scan was acquired for each participant to enable localization of the activations.
(d). Data analysis
(i). EEG pre-processing
All EEG datasets have been pre-processed with the FASTER-package (http://sourceforge.net/projects/faster/) which is a fully automated, unsupervised method for processing of high density EEG data by Nolan et al. [16] that has been shown to pre-process EEG data as well as human experimenters. The algorithm filters the data, removes overly noisy channels, performs independent component analysis and removes artefacts, epochs the data and removes epochs that are still noisy after artefact removal. After running each dataset through the FASTER algorithm, they were re-referenced to the average signal, 45 Hz low-pass filtered, and the data were then visually inspected to ensure that all artefacts were removed. This is done for each of the data time-locked to stimulus presentation, time of choice and time of outcome presentation. In this paper, we focus on the data time locked to the time of stimulus presentation. We time-locked to the time of stimulus onset as this analysis was maximally sensitive to detecting the earliest emergence of value signals pertaining to the chosen option following stimulus onset, as opposed to time-locking to the time of response which would have been most sensitive for detecting response-related activity, but not for detecting value signals emerging early in time within the trial.
(ii). Computational model
The subjects’ behavioural data were fitted to a simple SARSA-type reinforcement-learning (RL) model with discounted value for unchosen alternatives and a softmax choice rule
 |
where Vi(t) is the value of stimulus i at time t, α is the learning rate, r is the reward received at time t and γ is the discount rate. Pi(t) is the probability of choosing stimulus i at time t given the temperature parameter τ. This learning model combined with the softmax choice rule yields predictions of value for each stimulus at each time, and prediction error for each reward delivery (or lack thereof). The fitted parameters were learning rate, temperature for the softmax rule and the discounting rate.
(iii). Computational model-based EEG analysis
To implement the computational model-based EEG analysis, for each electrode separately, we first extracted EEG signals corresponding to each trial. We extracted data from 500 ms prior to the stimulus presentation, and to 1500 ms after. We then binned this high-frequency time series into 50 ms bins by averaging the EEG signal within each 50 ms timeframe. This binning process was conducted separately for each trial per electrode. Next, for each electrode separately, we concatenated the time bins covering similar time points in peristimulus time in each trial into a sequence corresponding to the average EEG signal within that time bin on each trial of the experiment. We repeated this for each time bin. Given that there are 128 electrodes, and 41 time bins, this gave us 5248 separate sequences. For each electrode therefore, we had sequences corresponding to each 50 ms interval within the trial which could subsequently be regressed on trial by trial value from our computational model. Next, we used the regress function in Matlab (Matlab. 2010b The MathWorks, Inc., Natick, MA) to regress each EEG time series against the relevant signals from our computational model, which are (i) the difference in value between the chosen and the unchosen decision options as predicted by the reinforcement-learning model and (ii) the value of the option that is ultimately chosen in the trial, also generated from the fitted reinforcement-learning. To avoid the potentially strong correlation between difference value and chosen value, the design matrix for the regression consists of chosen and unchosen values, separated into left and right choices, giving four regressors. The correlation with the difference and chosen value is then found through averaging together the appropriate regressors.
This generated parameter estimates corresponding to the degree to which the computational signals were correlated with the EEG data at that specific time point in the trial across the experiment in that particular electrode. This was repeated across all time bins, all electrodes and all participants. To obtain between subjects effects, we computed the T-score for each time bin within each electrode across subjects. We could then produce maps in electrode space plotting the degree of correlation of different electrodes with the relevant computational signals at each different time interval within the trial.
In order to derive a statistical threshold for the T-scores, we needed to correct for multiple comparisons. As Bonferroni correction assuming independence of electrode position and time window was deemed too stringent given considerable intrinsic spatial and temporal smoothing, we used a permutation test to derive an appropriate statistical threshold. To carry out the permutation test, we randomly permuted the order of the model values and reran the regression with each EEG sequence for each electrode. This way we found the threshold at which random data with the same variance show no correlation with 95% certainty. This allowed us to impose a corrected threshold of p < 0.05, while simultaneously adjusting for multiple comparisons across both the multiple electrodes and the multiple time-windows used in the EEG analysis.
To ensure that the EEG results generalize to the random effects level, we performed an additional permutation test where we randomly permuted the sign of the regression slopes for each participant before doing a between-subject comparison. The result of this analysis when thresholded at p < 0.05 corrected, gave qualitatively similar results to those reported for the results of the permutation test described earlier, in that all of the effects identified at the relevant time points remained significant.
(iv). fMRI analysis
The fMRI data were analysed in Statistical Parametric Mapping 8 (SPM8). Standard pre-processing involving realignment, co-registration of the functional data to each individual participant's structural scan and normalization to a standard echo planar imaging template was conducted.
For the statistical analysis of the fMRI data, we used a model-based approach [17]. For this, we separated the trials into different trial onset-regressors as a function of whether a left-hand choice or a right-hand choice was made, modelling the neutral control conditions as two additional onset regressors (separately for left- and right-hand control trials). The onsets were aligned to the time of stimulus presentation. Outcome events were also separately modelled.
In addition to the onset regressors, two parametric regressors were included for each of the left- and right-handed choice trials. These regressors correspond to the model-estimated values for the option chosen on that trial and the values for the option that is not chosen on those trials (similar to the analysis strategy used in [10]). By splitting the regressors this way, we can make contrasts looking at various combinations of chosen and unchosen value signals at the time of stimulus presentation. In this manuscript, we focus on the value of the chosen alternative, and the difference in value between the chosen and unchosen alternative.
We also included two regressors at the time of outcome, one to capture the magnitude of outcome received and another to capture prediction errors at outcome time. The results from the outcome time are not included in the present manuscript and will be presented elsewhere.
Finally, motion parameters were included as effects of no-interest to account for variance in the fMRI data induced by participant motion.
(v). fMRI-based localization of EEG data
To perform this source localization, we first divided each participants' trials into six conditions according to their appropriate model values. Then, each condition was averaged, and a contrast [−5 −3 −1 1 3 5] was set up to identify electrodes where the EEG amplitude in peristimulus time were linearly increasing with increasing model values. To maximize the likelihood of finding areas that are common between subjects, we used the group inversion method described in Litvak and Friston [18] as implemented in SPM8 (Wellcome Department of Imaging Neuroscience, UCL, UK) to localize the common brain areas that increased in activity with increasing model values. The group inversion method uses a canonical mesh in combination with a hierarchical Bayesian algorithm to find the most likely distribution of sources given the observed data. Because we also obtained fMRI data in the same group of participants (barring six participants who were scanned with EEG only), we could use the fMRI data to inform the source localization of the EEG data. For this, the statistical maps, coming from the fMRI results (see the electronic supplementary material, figure S1) for a particular contrast (thresholded at p < 0.005 (uncorrected)), were entered into the source localization as a prior probability. After the result of each participant was inverted, the final result was obtained by summarizing the regionally specific correlates of value that were conserved over subjects. Other inversion parameters used were: GS model, no PST Hanning, 0 Hz high-pass, 48 Hz low-pass, no solution restriction, no time-frequency contrast.
4. Results
(a). Behavioural findings and model-fitting
In order to establish whether participants had learned the task, we examined the extent to which participants chose the best available option on a given trial, both relative to the objective reward probabilities and to the modelled subjective reward probabilities. We found that for the EEG study, participants selected the objectively best option on 63% of trials, and the subjectively best option on 68% of trials, both of which is significantly better than chance at  , as estimated from a Monte Carlo simulation. Furthermore, for the fMRI study, participants selected the objectively best option on 68%, and subjectively best option on 76% of trials, both of which are significantly better than chance at
  .
.
We also found that the participants in both the EEG and the fMRI study increasingly chose the better option as the value difference between options increased, both for the objectively (figure 2b) and subjectively (figure 2c) best option. We compared the model fit with both a null model and with a model without the discount parameter, and the model we used outperformed the others according to the Akaike information criterion.
(b). EEG results
(i). Motor-action-related EEG responses
To validate our analysis approach, we first tested for EEG-related activity elicited by the motor response. When using an F-test to compare motor responses elicited to right-handed choices versus those elicited to left-handed choices in native electrode space, we observed significant differences in event-related potentials at 100 ms prior to motor response with right- versus left-sided scalp distributions peaking centrally (figure 3a).
Figure 3.

In order to validate our analytical approach, we tested for electrodes that correlate with the generation of a motor response, and source-localized the activity to motor cortex. (a) Electrodes correlating with responses in the time window −100 to 0 ms before button press. Electrodes shown show significance at a p < 0.05 corrected threshold determined through permutation test. (b) EEG activity for motor responses source-localized as comparisons of left versus right choices without an fMRI-based prior probability map. (Online version in colour.)
Next, we applied source localization for the EEG activity without using a prior probability map generated from the fMRI data (see Methods for details). When examining the localized results for the same time window (100 to 0 ms) prior to the motor action using a non-directional F-test, the EEG activity was found to be localized to primary motor cortex in the vicinity of the hand area (figure 3b; Montreal Neurological Institute coordinates, left: [−54, −20, 28], z = 4.34; right: [56, −22, 26], z = 4.44).
(ii). Chosen values
In order to find out where in the brain the decision first emerges, we tested for chosen value signals, a type of signal that by definition must emerge after but not before a decision has been rendered. Thus, detecting where and when this signal arises in the EEG data, should enable us to ascertain where and when in the brain the decision first emerges.
To characterize when and where this signal arises, we regressed our chosen value regressor (derived from the RL-model) with each of the electrodes in each of the 50 ms time bins as mentioned above. To ensure that the correlation was exclusively with chosen value and not with the value difference (chosen minus unchosen) or otherwise, we excluded any time bins/electrodes in which there was even a modest correlation (at p < 0.2) with the value of the unchosen alternative. In a plot of electrodes showing significant chosen-value-related responses (at p < 0.05 corrected) analysed separately for each 50 ms window after stimulus presentation (figure 4), we found evidence for an initial emergence of the chosen-value signal predominantly over a posterior scalp location in the range of 200–450 ms following the trial onset, as well as much more weakly (albeit still significantly) in an anterior scalp location. The initially posterior-located chosen-value signal then appears to propagate forward through the brain, emerging centrally 500–650 ms after stimulus presentation, and finally emerging anteriorly in the brain 850–1150 ms after stimulus presentation.
Figure 4.
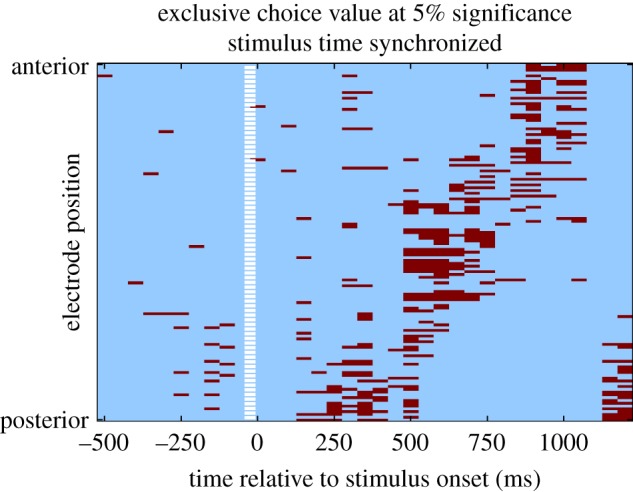
Results of the analysis of the chosen value. Each row in the result-map represents an electrode, and each column a 50 ms time bin. Electrodes are arranged according to anterior position, so that the most anterior electrodes are at the top of the map, and the most posterior at the bottom. The white-dashed line represents the time of stimulus. Red (dark in print version) indicates significant correlation with chosen value at p < 0.05 corrected for multiple comparisons, as well as no significant correlation with unchosen value set at the p < 0.20 level (so as to exclude any electrode showing even a modest trend to represent the unchosen value). (Online version in colour.)
To further aid in localization of this signal, in figure 5a–c, we plot the correlating electrodes (thresholded at p < 0.05 corrected) on scalp maps for each time-period showing significant correlations. In addition to showing the posterior-to-anterior trend, the plots also indicate that the activity at 200–450 ms is strongest medially, the activity at 500–650 ms is more lateral and that the activity at 850–1150 ms after stimulus presentation has both a strong medial and a strong lateral component.
Figure 5.

Results of the analysis of the chosen value (a–c). Same data as in figure 4, but aggregated over time windows and plotted on scalp maps. Top row shows transverse view, bottom row coronal view. Bigger dots mean more significant time bins in the time window. (Online version in colour.)
This posterior-to-anterior progression of chosen values is also seen by dividing the trials into high and low chosen value trials, and then plotting the scalp maps of the difference wave (see the electronic supplementary material, figure S2).
Next, we implemented source localization for the chosen-value signals using SPM8. For this, we used the fMRI data acquired from the same task as a prior probability map for the source localization. The fMRI results revealed significant chosen-value-related activity in areas reported in a number of previous fMRI studies, including lateral parietal cortex, lateral orbitofrontal and vmPFC (see electronic supplementary material, figure S1).
Source-localized results revealed activity in four principle locations for chosen-value: a region of intraparietal sulcus ([−24, −46, 64], z = 3.58, figure 6 top), middle temporal gyrus ([64, −20, 2], z = 3.90), lateral prefrontal cortex ([48, 36, 6], z = 4.23) and vmPFC ([−6, 62,4], z = 5.18, figure 6 bottom).
Figure 6.
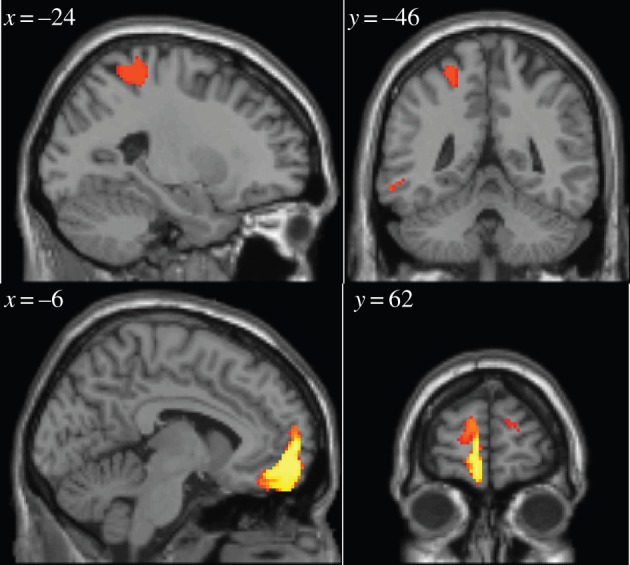
fMRI-informed source localization of chosen value with threshold set at p < 0.0005 (unc). (Online version in colour.)
(iii). Value difference
Next, we tested for EEG signals correlating with the difference in values between the options that are chosen and not-chosen on each trial. In previous studies by our group, we have found neural correlates of the difference between the unchosen and chosen value in a region of dmPFC, which we suggested represented the output of the decision process as predicted by models of decision-making such as the drift–diffusion model [10,11]. Consequently, we aimed to test for the presence of such a signal in the EEG data across electrodes and time post-trial onset. We found that this signal appears to emerge predominantly 1050–1200 ms after trial onset in a central scalp location (figures 7 and 8). The source localization of the unchosen minus chosen value (figure 9) revealed significant effects of the value difference in dmPFC, most strongly in a more posterior part of the dmPFC ([8, 16, 62], z = 5.93), but also extending more anteriorly ([−24, 54, 22], z = 4.12). There are two very important features of these value difference results. First, the timing: this value difference signal appears to emerge substantially later in time than does the value chosen signal (approx. 850 ms later). Given that the value chosen signal can only emerge as a consequence and not as a precursor of the decision process, the decision clearly must be made substantially earlier within the trial before the emergence of the value difference signal. As a consequence, it appears that this signal may not be critically related to the formation or immediate aftermath of the decision process itself, but instead must relate to some post-decision process. Second, the localization of the value difference most prominently to the dmPFC in the fMRI-constrained EEG data, is strongly consistent with the results of a number of previous fMRI studies that have localized this signal to the same region of dmPFC [10,11].
Figure 7.
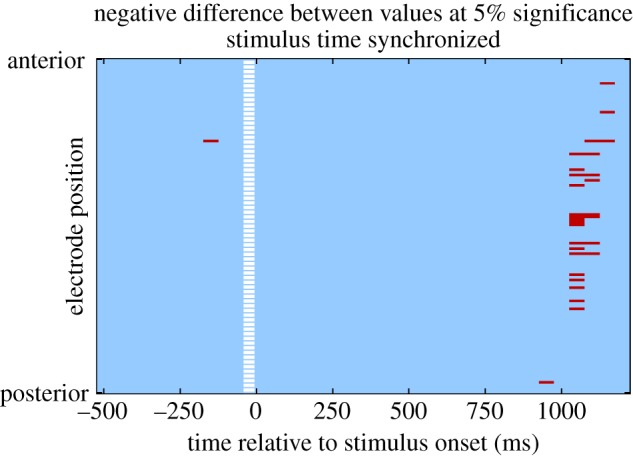
Results from the analysis of the value difference between unchosen and chosen options. Each row in the result map represents an electrode, and each column a 50 ms time bin. Electrodes are ordered according to anterior position, so that the most anterior electrodes are at the top of the map, and the most posterior at the bottom. The white-dashed line represents the time of stimulus. Red (dark in print version) indicates significant correlation with value difference at p < 0.05 corrected. (Online version in colour.)
Figure 8.
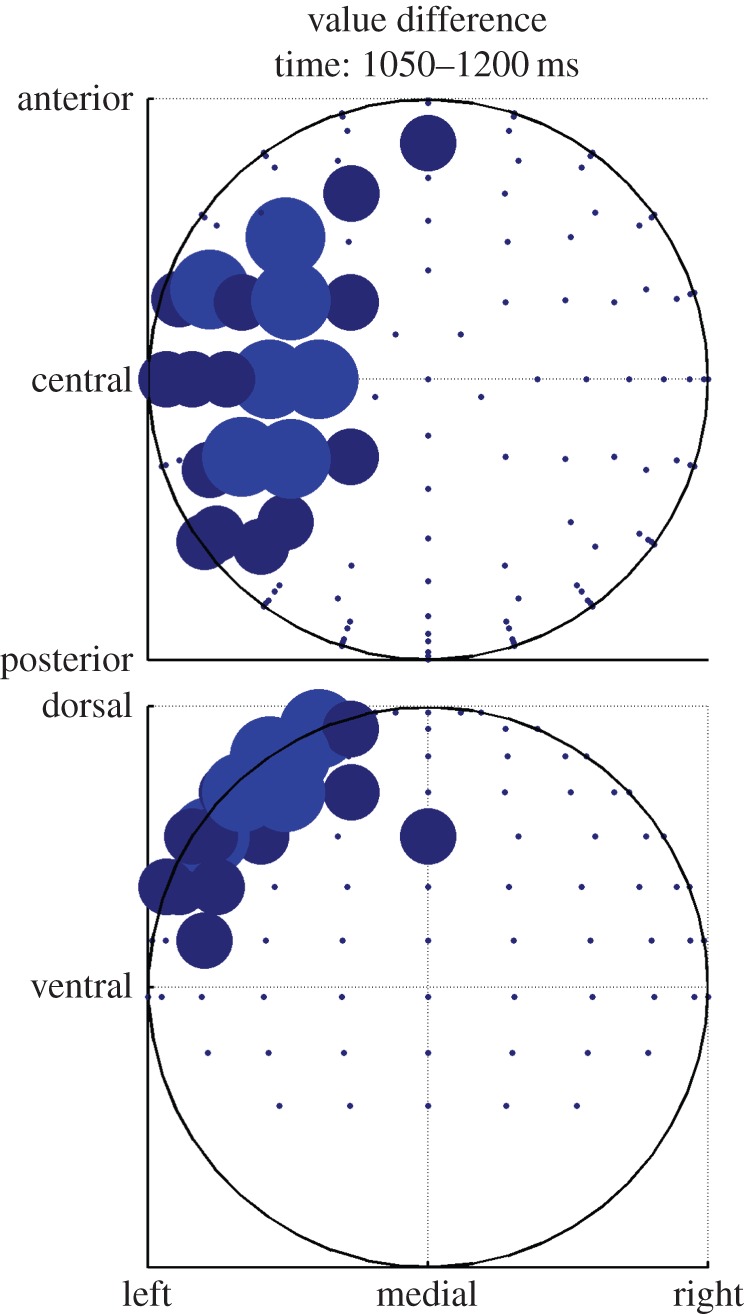
Same data as in figure 7, but aggregated over the time window showing significant correlation and plotted on a scalp map. Top shows transverse view, bottom coronal view. Bigger dots mean more significant time bins in the time window. (Online version in colour.)
Figure 9.
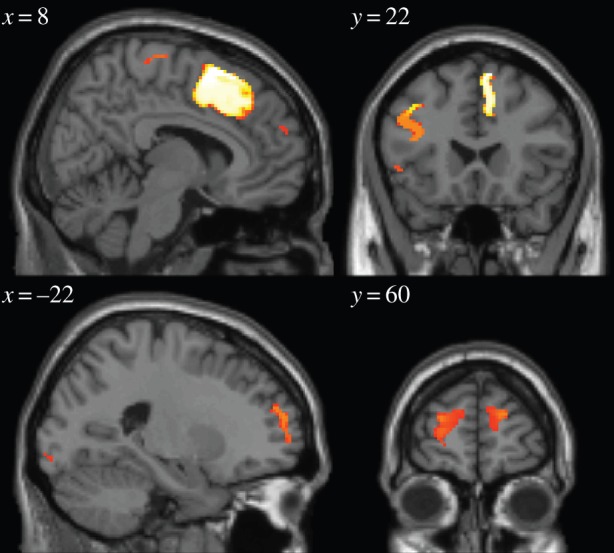
fMRI-informed source localization of value difference, with threshold set at p < 0.0005. (Online version in colour.)
5. Discussion
In the present study, we used computational model-based EEG analysis in combination with model-based fMRI data acquired from an overlapping group of participants in order to ascertain the timing and localization of decision-related variables as estimated through a reinforcement-learning model.
In the present study, we used a very simple type of reinforcement-learning algorithm (SARSA) to estimate trial-by-trial value signals [19]. We note that this class of ‘model-free’ algorithm does have limitations, in particular when it comes to situations where a decision problem has higher-order structure, or where the value of an outcome to an agent changes across time [20,21]. A number of other types of algorithm have been proposed for this situation, including model-based reinforcement learning and Bayesian models [20–23]. However, in the present situation, the task was designed so that value signals could be adequately captured with even a simple reinforcement-learning model, because the reward distributions associated with each action were kept independent, and can thus be learned relatively efficiently by means of a ‘model-free’ reward prediction error. Furthermore, model-based and model-free RL algorithms will likely make very similar trial-by-trial predictions in the present case. Future extensions of this work could involve using more complex tasks in order to distinguish the temporal signatures of ‘model-based’ and ‘model-free’ value signals.
The results of this study provide several important new insights into how simple binary value-related decisions are made in the human brain. Specifically, we show that chosen value signals, which are by definition a consequence of the decision process [5,10], appear to initially emerge predominantly in a posterior location in the brain, with a weaker signal present also at an anterior locus. Using fMRI-informed source localization, we found that the posterior signal was localized to the vicinity of the lateral–intraparietal cortex and posterior lateral temporal lobe cortex. Such signals emerge as soon as 200 ms after the trial onset, suggesting that the decision itself may be computed very early on in the trial. The predominantly posteriorly localized chosen value signal then appears to propagate more anteriorly over the course of several hundred milliseconds, emerging in a central location around 500 ms, and then finally in a more anterior location around 850 ms post-trial onset. In our fMRI-guided EEG source localization, these more anterior areas may correspond to the lateral prefrontal cortex and vmPFC, respectively.
These findings show that the consequence of the decision itself (for at least this type of simple reward-related choice) is represented very early on (only 200 ms after stimulus onset) most prominently in posterior parts of the brain such as LIP. A possible implication of these findings could be that posterior brain regions such as LIP are responsible for the formation of the initial decision, before this information is propagated anteriorly for the purposes of action selection. However, the fact that the chosen-value activity was also found in an anterior scalp location early on in the trial, albeit much more faintly than the posterior locus, suggests that such a conclusion may be premature on the basis of the current findings.
A more balanced interpretation would be that the decision process may emerge as a result of integrative interactions between anterior and posterior regions. It has been proposed that the decision process can be viewed in a hierarchical setting, with more anterior regions such as vmPFC playing a role in the selection or ranking of goals, and more posterior dorsal regions such as LIP playing a role in the selection of actions to obtain goals (see [5]). The degree to which these different regions contribute to the decision process for a given decision-making problem may depend on the extent to which the decision that needs to be made is weighted towards goal selection or action selection. For example, in a situation where the goal is the same over all the actions (i.e. to win money), we might expect less contribution from vmPFC to the decision process and more contribution of LIP and other dorsal cortical areas. Conversely, if the decision task involves selection over different types of goal outcomes (e.g. deciding whether to opt for a glass of soda or glass of milk), where each goal involves similar actions (i.e. a grasping movement), this type of decision might depend more on the vmPFC. Decisions that tax both goal selection and action selection might depend heavily on both brain areas. In the present case because the goal was the same for both actions (to win money), yet the actions differed and the probability of reward available on those actions differed, perhaps a greater initial dependence on posterior regions for computing the decision might pertain, as observed in our results.
The rapid emergence of chosen value signals in the vicinity of the lateral intraparietal cortex is particularly notable given prior literature implicating this region in decision-making in non-human primates [7,13,24–26]. In particular, neural signals have been found in these regions that are suggested to correspond to evidence integration processes in both perceptual and value-based decision-making [6,27–29]. It is also striking that the timing of emergence of decision signals in monkey LIP neurons is very compatible with the timing of the emergence of chosen value signals in the present study. In both the monkey studies and our study, around 200 ms post-stimulus, LIP appears to have a very robust representation of the option that ultimately is chosen.
Besides the lateral intraparietal cortex and vmPFC, another region that has previously been implicated in the decision process is the dmPFC [4,10,11,30]. This region has previously been found to encode the difference between unchosen and chosen values, which has been hypothesized to emerge as a consequence of the type of evidence integration process that may underpin decision-making at the neural level. When we tested for unchosen minus chosen value signals we found them to be localized predominantly to regions of dmPFC, as found in those previous studies. However, these signals appear to emerge 1050 ms into the trial, approximately 850 ms after the chosen values signals are first observed elsewhere. A strong interpretation of these results is that value difference signals in the dmPFC are not involved in the implementation of the decision process itself, but instead emerge later on in the trial at the point when action selection is being implemented. One possibility, on which we speculated in the original fMRI study by Wunderlich et al. [10] that first reported this signal, is that the dmPFC may contribute to the implementation of the action selection by inhibiting selection of the action that is not taken on a particular trial.
In addition to the late emergence of value-difference signals, it is also notable that chosen value signals also occur mid to late in the trial (in the range of 850–1050 ms post-trial onset), localized predominantly to anterior brain regions such as vmPFC and lateral prefrontal cortex. What purpose could such late emerging signals serve? One possibility is that such chosen value signals are used in order to generate prediction errors, which correspond to the difference between actual and expected (chosen) outcomes [5]. Alternatively, chosen values might be used to motivate action selection, i.e. to increase response-vigour towards higher-valued actions relative to chosen actions that are less highly valued. Finally, chosen value signals could be used to modulate action-monitoring, so that actions leading to more highly valued outcomes are monitored more closely than actions resulting in less valuable outcomes.
One important caveat of our findings is that the fMRI constrained localization results we report here does depend on the assumption that fMRI data and EEG data are generated by the same underlying neural sources, an assumption that may not always hold true [31]. Nevertheless, the brain regions identified in our source localization have been previously identified as having neural activity that is strongly implicated in value-related learning using direct neural recordings from those areas [7,8,32]. Thus, it is unlikely that the results we observe are an artefact of the assumption underlying fMRI-informed EEG localization.
In conclusion, the present findings provide us with valuable insights into the temporal and spatial processes underpinning human value-based decision-making for binary options. We show that value signals related to the consequence of the decision emerge within 200 ms after onset of the decision trial, most predominantly in posterior locations in the vicinity of the LIP as well as in posterior temporal lobe cortex, but also less prominently in an anterior cortical locus. These findings suggest an important role for posterior brain regions including the LIP in the generation of the decision itself, perhaps through cortical interactions with more anterior regions such as vmPFC. Furthermore, while dmPFC was found to report the difference in value between unchosen and chosen options as in a number of previous studies, this signal did not emerge until much later in the trial, approximately 1050 ms after the initial stimulus presentation, and 850 ms after the first emergence of the value signals reflecting the consequence of the decision (chosen value signals). These findings suggest that dmPFC may not play a consequential role in the initial formation of the decision itself, but rather may contribute at a later stage during the process of implementation of action selection.
Supplementary Material
Acknowledgements
The authors thank Simon Dunne and Teresa Furey for their help running the experiment, and Dr Paul Dockree for his advice and suggestions.
Funding statement
This work was supported by grants from Science Foundation Ireland and the Gordon and Betty Moore Foundation to J.O.D.
References
- 1.O'Doherty J. 2004. Reward representations and reward-related learning in the human brain: insights from human neuroimaging. Curr. Opin. Neurobiol. 14, 769–776. ( 10.1016/j.conb.2004.10.016) [DOI] [PubMed] [Google Scholar]
- 2.Lau B, Glimcher PW. 2007. Action and outcome encoding in the primate caudate nucleus. J. Neurosci. 27, 14 502–14 514. ( 10.1523/JNEUROSCI.3060-07.2007) [DOI] [PMC free article] [PubMed] [Google Scholar]
- 3.Gläscher J, Hampton AN, O'Doherty JP. 2009. Determining a role for ventromedial prefrontal cortex in encoding action-based value signals during reward-related decision making. Cerebr. Cortex 19, 483–495. ( 10.1093/cercor/bhn098) [DOI] [PMC free article] [PubMed] [Google Scholar]
- 4.Rangel A, Hare T. 2010. Neural computations associated with goal-directed choice. Curr. Opin. Neurobiol. 20, 262–270. ( 10.1016/j.conb.2010.03.001) [DOI] [PubMed] [Google Scholar]
- 5.O'Doherty JP. 2011. Contributions of the ventromedial prefrontal cortex to goal-directed action selection. Ann. N.Y. Acad. Sci. 1239, 118–129. ( 10.1111/j.1749-6632.2011.06290.x) [DOI] [PubMed] [Google Scholar]
- 6.Platt ML, Glimcher PW. 1999. Neural correlates of decision variables in parietal cortex. Nature 400, 233–238. ( 10.1038/22268) [DOI] [PubMed] [Google Scholar]
- 7.Sugrue LP, Corrado GS, Newsome WT. 2004. Matching behavior and the representation of value in the parietal cortex. Science 304, 1782–1787. ( 10.1126/science.1094765) [DOI] [PubMed] [Google Scholar]
- 8.Padoa-Schioppa C, Assad JA. 2006. Neurons in the orbitofrontal cortex encode economic value. Nature 441, 223–226. ( 10.1038/nature04676) [DOI] [PMC free article] [PubMed] [Google Scholar]
- 9.Boorman ED, Behrens TE, Woolrich MW, Rushworth MF. 2009. How green is the grass on the other side? Frontopolar cortex and the evidence in favor of alternative courses of action. Neuron 62, 733–743. ( 10.1016/j.neuron.2009.05.014) [DOI] [PubMed] [Google Scholar]
- 10.Wunderlich K, Rangel A, O'Doherty JP. 2009. Neural computations underlying action-based decision making in the human brain. Proc. Natl Acad. Sci. USA 106, 17 199–17 204. ( 10.1073/pnas.0901077106) [DOI] [PMC free article] [PubMed] [Google Scholar]
- 11.Hare TA, Schultz W, Camerer CF, O'Doherty JP, Rangel A. 2011. Transformation of stimulus value signals into motor commands during simple choice. Proc. Natl Acad. Sci. USA 108, 18 120–18 125. ( 10.1073/pnas.1109322108) [DOI] [PMC free article] [PubMed] [Google Scholar]
- 12.Noonan MP, Walton ME, Behrens TEJ, Sallet J, Buckley MJ, Rushworth MFS. 2010. Separate value comparison and learning mechanisms in macaque medial and lateral orbitofrontal cortex. Proc. Natl Acad. Sci. USA 107, 20 547–20 552. ( 10.1073/pnas.1012246107) [DOI] [PMC free article] [PubMed] [Google Scholar]
- 13.Shadlen MN, Newsome WT. 2001. Neural basis of a perceptual decision in the parietal cortex (area LIP) of the rhesus monkey. J. Neurophysiol. 86, 1916–1936. [DOI] [PubMed] [Google Scholar]
- 14.Harris A, Adolphs R, Camerer C, Rangel A. 2011. Dynamic construction of stimulus values in the ventromedial prefrontal cortex. PLoS ONE 6, e21074 ( 10.1371/journal.pone.0021074) [DOI] [PMC free article] [PubMed] [Google Scholar]
- 15.Hunt LT, Kolling N, Soltani A, Woolrich MW, Rushworth MF, Behrens TE. 2012. Mechanisms underlying cortical activity during value-guided choice. Nat. Neurosci. 15, 470–476. ( 10.1038/nn.3017) [DOI] [PMC free article] [PubMed] [Google Scholar]
- 16.Nolan H, Whelan R, Reilly RB. 2010. FASTER: fully automated statistical thresholding for EEG artifact rejection. J. Neurosci. Methods 192, 152–162. ( 10.1016/j.jneumeth.2010.07.015) [DOI] [PubMed] [Google Scholar]
- 17.O'Doherty JP, Hampton A, Kim H. 2007. Model-based fMRI and its application to reward learning and decision making. Ann. N.Y. Acad. Sci. 1104, 35–53. ( 10.1196/annals.1390.022) [DOI] [PubMed] [Google Scholar]
- 18.Litvak V, Friston K. 2008. Electromagnetic source reconstruction for group studies. Neuroimage 42, 1490–1498. ( 10.1016/j.neuroimage.2008.06.022) [DOI] [PMC free article] [PubMed] [Google Scholar]
- 19.Sutton RS, Barto AG. 1998. Reinforcement learning: an introduction. Cambridge, MA: MIT Press. [Google Scholar]
- 20.Daw ND, Niv Y, Dayan P. 2005. Uncertainty-based competition between prefrontal and dorsolateral striatal systems for behavioral control. Nat. Neurosci. 8, 1704–1711. ( 10.1038/nn1560) [DOI] [PubMed] [Google Scholar]
- 21.Hampton AN, Bossaerts P, O'Doherty JP. 2006. The role of the ventromedial prefrontal cortex in abstract state-based inference during decision making in humans. J. Neurosci. 26, 8360–8367. ( 10.1523/JNEUROSCI.1010-06.2006) [DOI] [PMC free article] [PubMed] [Google Scholar]
- 22.Wunderlich K, Dayan P, Dolan RJ. 2012. Mapping value based planning and extensively trained choice in the human brain. Nat. Neurosci. 15, 786–791. ( 10.1038/nn.3068) [DOI] [PMC free article] [PubMed] [Google Scholar]
- 23.Friston K, Schwartenbeck P, Fitzgerald T, Moutoussis M, Behrens T, Dolan RJ. 2013. The anatomy of choice: active inference and agency. Front. Hum. Neurosci. 7, 598 ( 10.3389/fnhum.2013.00598) [DOI] [PMC free article] [PubMed] [Google Scholar]
- 24.Gold JI, Shadlen MN. 2002. Banburismus and the brain: decoding the relationship between sensory stimuli, decisions, and reward. Neuron 36, 299–308. ( 10.1016/S0896-6273(02)00971-6) [DOI] [PubMed] [Google Scholar]
- 25.Roitman JD, Shadlen MN. 2002. Response of neurons in the lateral intraparietal area during a combined visual discrimination reaction time task. J. Neurosci. 22, 9475–9489. [DOI] [PMC free article] [PubMed] [Google Scholar]
- 26.Dorris MC, Glimcher PW. 2004. Activity in posterior parietal cortex is correlated with the relative subjective desirability of action. Neuron 44, 365–378. ( 10.1016/j.neuron.2004.09.009) [DOI] [PubMed] [Google Scholar]
- 27.Bendiksby MS, Platt ML. 2006. Neural correlates of reward and attention in macaque area LIP. Neuropsychologia 44, 2411–2420. ( 10.1016/j.neuropsychologia.2006.04.011) [DOI] [PubMed] [Google Scholar]
- 28.Kiani R, Hanks TD, Shadlen MN. 2008. Bounded integration in parietal cortex underlies decisions even when viewing duration is dictated by the environment. J. Neurosci. 28, 3017–3029. ( 10.1523/JNEUROSCI.4761-07.2008) [DOI] [PMC free article] [PubMed] [Google Scholar]
- 29.Rorie AE, Gao J, McClelland JL, Newsome WT. 2010. Integration of sensory and reward information during perceptual decision-making in lateral intraparietal cortex (LIP) of the macaque monkey. PLoS ONE 5, e9308 ( 10.1371/journal.pone.0009308) [DOI] [PMC free article] [PubMed] [Google Scholar]
- 30.Rushworth MFS, Walton ME, Kennerley SW, Bannerman DM. 2004. Action sets and decisions in the medial frontal cortex. Trends Cogn. Sci. 8, 410–417. ( 10.1016/j.tics.2004.07.009) [DOI] [PubMed] [Google Scholar]
- 31.Nunez PL, Silberstein RB. 2000. On the relationship of synaptic activity to macroscopic measurements: does co-registration of EEG with fMRI make sense? Brain Topogr. 13, 79–96. ( 10.1023/A:1026683200895) [DOI] [PubMed] [Google Scholar]
- 32.Lee D, Seo H, Jung MW. 2012. Neural basis of reinforcement learning and decision making. Annu. Rev. Neurosci. 35, 287–308. ( 10.1146/annurev-neuro-062111-150512) [DOI] [PMC free article] [PubMed] [Google Scholar]
Associated Data
This section collects any data citations, data availability statements, or supplementary materials included in this article.