

Abstract
After synthesis and release from cells, prostaglandin E2 (PGE2) undergoes reuptake by the prostaglandin transporter (PGT), followed by cytoplasmic oxidation. Although genetic inactivation of PGT in mice and humans results in distinctive phenotypes, and although experiments in localized environments show that manipulating PGT alters downstream cellular events, a direct mechanistic link between PGT activity and PGE2 (EP) receptor activation has not been made. Toward this end, we created two reconstituted systems to examine the effect of PGT expression on PGE2 signaling via two of its receptors (EP1 and EP4). In human embryonic kidney cells engineered to express the EP1 receptor, exogenous PGE2 induced a dose-dependent increase in cytoplasmic Ca2+. When PGT was expressed at the plasma membrane, the PGE2 dose–response curve was right-shifted, consistent with reduction in cell surface PGE2 availability; a potent PGT inhibitor acutely reversed this shift. When bradykinin was used to induce endogenous PGE2 release, PGT expression similarly induced a reduction in Ca2+ responses. In separate experiments using Madin–Darby Canine Kidney cells engineered to express the PGE2 receptor EP4, bradykinin again induced autocrine PGE2 signaling, as judged by an abrupt increase in intracellular cAMP. As in the EP1 experiments, expression of PGT at the plasma membrane caused a reduction in bradykinin-induced cAMP accumulation. Pharmacological concentrations of exogenous PGE2 induced EP4 receptor desensitization, an effect that was mitigated by PGT. Thus, at an autocrine/paracrine level, plasma membrane PGT regulates PGE2 signaling by decreasing ligand availability at cell surface receptors.
Keywords: Eicosanoids, G-protein-coupled receptors, prostaglandins, signal transduction, SLCO2A1
Introduction
In recent years, mechanisms mediating prostaglandin E2 (PGE2) signal termination have become increasingly clear. Following synthesis, release, and binding to its cognate receptors (EP1-4), PGE2 is metabolically inactivated by a two-step process, consisting first of energetically active uptake across the plasma membrane by the prostaglandin transporter (PGT) (SLCO2A1) (Kanai et al. 1995), and then cytoplasmic oxidative inactivation by 15-OH prostaglandin dehydrogenase (HPGD) (Tai et al. 2002). PGE2 influx across the plasma membrane by PGT is rate limiting for this inactivation, because heterologous expression of HPGD without PGT is insufficient to result in PGE2 oxidation (Nomura et al. 2004).
Based on this model, our laboratory has advanced the hypothesis that PGE2 signaling is akin to synaptic signaling (Nomura et al. 2005). Notably, both neurotransmitters and prostanoids are synthesized by inducible enzymes (Saadat et al. 1989; Smith et al. 2000; Stichtenoth et al. 2001; Murakami and Kudo 2004); both systems involve triggered release of ligand into the extracellular compartment (Greengard 2001; Kudo and Murakami 2002); both sets of G-protein coupled receptors (GPCRs) utilize similar molecular signaling and regulatory mechanisms (Lefkowitz 1993; Neuschafer-Rube et al. 2004); and both sets of ligands undergo reuptake by plasma membrane carriers that are located on the ligand-releasing cell (Kanai et al. 1995; Bao et al. 2002; Nomura et al. 2005; Gether et al. 2006; Kristensen et al. 2011).
Despite the attractiveness of this hypothesis, it has not been shown definitively that PGE2 reuptake by PGT can control signaling at a local level. Although genetic inactivation of PGT in mice results in patent ductus arteriosus (Chang et al. 2010), and humans who are homozygous null at the PGT locus have pachydermoperiostosis (Busch et al. 2012; Diggle et al. 2012; Sasaki et al. 2012; Seifert et al. 2012; Zhang et al. 2012), in both cases systemic levels of PGE2 are increased, and ancillary studies suggest that these phenotypes might result from elevated circulating PGE2 acting as a hormone (Ueda et al. 1980; Ringel et al. 1982; Drvaric et al. 1989; Cattral et al. 1994; Letts et al. 1994; Reese et al. 2000). Moreover, although experiments using localized (autocrine/paracrine) model systems have been interpreted to indicate that PGT alters PGE2 signaling, the biological events measured in these studies were considerably distal to the EP receptors (Henry et al. 2005; Gordon et al. 2008; Subbaramaiah et al. 2011). Thus, a direct mechanistic link between cell surface PGT activity and EP receptor activation has not been made.
Here, we coexpressed either of two representative PGE2 (“EP”) receptors, along with the prostaglandin reuptake carrier PGT, in kidney cell lines. We then acutely manipulated cell surface PGT function and directly measured either signaling through the receptors or ligand-induced receptor desensitization. Our results demonstrate that plasma membrane PGT modulates the concentration of cell surface PGE2 in an autocrine/paracrine signaling mode. As a result, PGT directly modulates ligand access to, and activation of, EP1 and EP4 receptors.
Materials and Methods
Cell lines
Wild-type human embryonic kidney-293 cells (WT-HEK), wild-type Madin–Darby Canine Kidney (WT-MDCK) cells, and MDCK cells expressing green fluorescence protein-tagged PGT (PGT-GFP-MDCK) (Endo et al. 2002) were cultured in Dulbecco's modified Eagle's medium supplemented with 10% fetal bovine serum (FBS) and 1% penicillin/streptomycin. HEK cells stably expressing the EP1 receptor (EP1-HEK) (Peti-Peterdi et al. 2003) were cultured in F12 medium supplemented with 10% FBS, 1% P/S, 1.2 g/L NaHCO3, and 0.05 mg/mL G418. We generated a derivative of the EP1-HEK line stably expressing PGT (PGT-EP1-HEK) by transfecting EP1-HEK cells with human PGT cloned into the pcDNA3.1/Hygro (+) vector (Invitrogen, Grand Island, NY), followed by selection with hygromycin (0.25 mg/mL) in F12 media as described for EP1-HEK.
mRNA quantification
EP1, PGT, and glyceraldehyde phosphate dehydrogenase (GAPDH) mRNAs in EP1-HEK cells and in PGT-EP1-HEK cells were quantified by qRT-PCR using the SYBR system (Invitrogen). The EP1 (mouse) primers used were: 5′-CATCCGCTAGGCTCAGGTTA-3′ (forward) and 5′-AGCAGGAGCCAAGTTCCAG-3′ (backward). The PGT (human) primers used were: 5′-TGTACAGGAGTTGGCAGAGC-3′ (forward) and 5′-AGCGACACCTCTACTAGCCG-3′ (backward). The GAPDH (human) primers used were: 5′-AATGAAGGGGTCATTGATGG-3′ (forward) 5′-AAGGTGAAGGTCGGAGTCAA-3′ (backward).
Measurement of PGT function
PGT-mediated 3H-PGE2 uptake was measured using methods previously described (Kanai et al. 1995; Chi et al. 2006).
Protein quantification by Western blotting
Protein extraction and quantification by Western blotting were conducted using methods previously described (Syeda et al. 2012). EP1 was probed with an anti-EP1 polyclonal antibody (Cayman Chemical, Ann Arbor, MI) overnight at 4°C, with a goat anti-rabbit IgG horseradish peroxidase (HRP)-conjugated antibody as secondary antibody.
Measurements of intracellular Ca2+ transients
Changes in cytosolic Ca2+ levels were measured in cells loaded with the ratiometric Ca2+ indicator Fura-2 AM (Molecular Probes, Grand Island, NY) and imaged on an epifluorescence microscope as previously described (Suadicani et al. 2004, 2006). Experiments were performed with cells bathed in Tyrode solution ([in mmol/L] 137.0 NaCl, 2.7 KCl, 0.5 MgCl2, 1.8 CaCl2, 12.0 NaHCO3, 0.5 NaH2PO4, 5.5 glucose, and 5 HEPES; pH 7.4). Values of intracellular Ca2+ levels were obtained from Fura-2 ratio images using an in vitro calibration curve.
EP4 cell surface expression
WT-MDCK and PGT-GFP-MDCK cells were transiently transfected with a human EP4-expressing cDNA (UMR cDNA Resource Center, http://www.cdna.org) using lipofectamine reagent (Invitrogen) 48 h after being seeded. At 24 h after transfection, the cells were treated with exogenous PGE2 so as to obtain immediate medium PGE2 concentrations of 0, 10, 20, 30, or 50 nmol/L. These experiments were performed in the absence or presence of the PGT inhibitor T26A (Chi et al. 2011) (5 μmol/L) at 37°C for 10 min. Immediately before harvesting the cells, media were collected to determine the result of contact with the cell monolayers on extracellular PGE2 concentrations. Cells were then collected and lysed with buffer containing 10 mmol/L Tris-HCl, pH 7.4, 1 mmol/L EDTA, 10 mmol/L MgCl2, 0.1 mmol/L PSF, and 20 μmol/L indomethacin to inhibit any further PGE2 synthesis. Cell surface EP4 receptor expression was quantified by [3H]-PGE2 binding as previously described (Nishigaki et al. 1996). Briefly, the harvested cells were homogenized using a Potter–Elvehjem homogenizer in an ice-cold lysing buffer. The homogenate was centrifuged at 800 rpm for 5 min, and the supernatant was further centrifuged at 19,500 rpm for 45 min at 4°C. The pellet was washed once and then resuspended in 100 μL buffer A (20 mmol/L HEPES-NaOH, pH 7.4, 1 mmol/L EDTA, 10 mmol/L MgCl2) containing 4 nmol/L [3H]-PGE2 (170,000 dpm) and incubated at 30°C for 1 h. One milliliter cold buffer A was then added to stop binding. The mixture was filtered through a glass fiber which was then transferred to a scintillation vial. Ten milliliter scintillation solution was added to the vial and [3H]-PGE2 was counted by scintillation counting. Nonspecific binding was determined using a 1000-fold excess of unlabeled PGE2 in the incubation mixture. The specific binding was calculated by subtracting the nonspecific binding value from the total binding value.
PGE2 measurement
Extracellular PGE2 concentrations were quantified using an enzyme-linked immunoassay kit (Cayman Chemical) according to the manufacturer's protocol.
cAMP measurement
WT-MDCK and PGT-GFP-MDCK cells were transfected with the EP4-expressing vector 24 h after being seeded onto six-well plates. Twenty-four hours after transfection, they were incubated with the cAMP/cGMP phosphodiesterase inhibitor 3-isobutyl-1-methylxanthine (IBMX, 250 μmol/L) for an additional 18 h. Cells were then stimulated either with 10 μmol/L bradykinin or with various concentrations of exogenous PGE2 (0, 10, 20, 30, or 50 nmol/L), in the absence or presence of T26A (5 μmol/L), at 37°C for 30 and/or 10 min, respectively. Thereafter, cells were washed twice with phosphate-buffered saline (PBS) and were lysed with PBS containing 0.1 mol/L HCl and 0.1% triton-X 100 (250 μL/well) at room temperature for 15 min. Cell lysates were centrifuged (10,000g, 4°C for 10 min), and cAMP in the supernatants was measured using an enzyme-linked immunoassay (ELISA) kit from Cayman Chemical according to the manufacturer's protocol.
Results
Generation of a cell line coexpressing PGT and EP1
To investigate functional interplay between the PGT transporter and EP1 receptors, we began with a cell line that stably overexpresses the mouse EP1 receptor, “EP1-HEK” (Peti-Peterdi et al. 2003). From this, we generated a new cell line, “PGT-EP1-HEK,” which stably overexpresses both mouse EP1 and human PGT. Figure 1A shows that PGT mRNA expression in PGT-EP1-HEK cells is about 140-fold that of EP1-HEK cells. Figure 1B shows that PGT-EP1-HEK cells exhibit significant tracer PGE2 uptake, whereas EP1-HEK cells exhibit almost no PGE2 uptake. Figure 1C and D show that EP1 mRNA and protein expression in PGT-EP1-HEK cells were not different from that in the original EP1-HEK cells.
Figure 1.
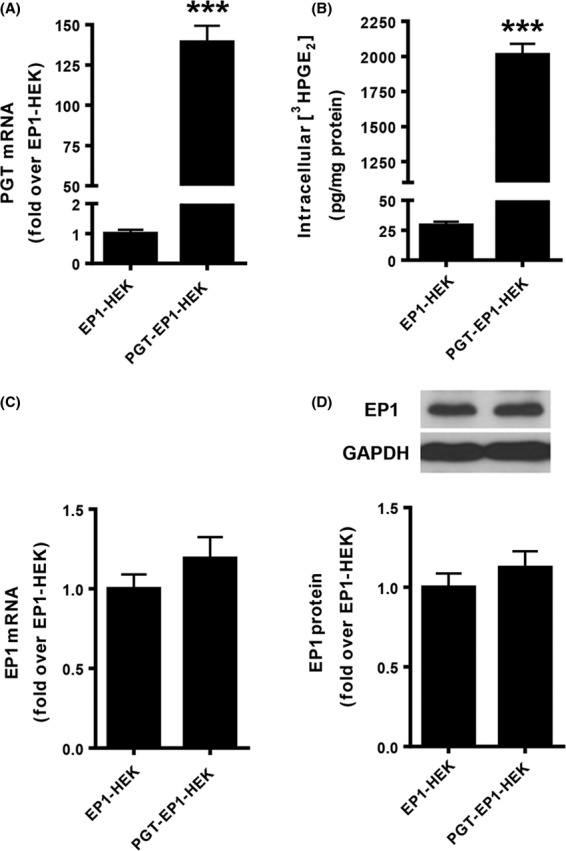
Properties of EP1-HEK and PGT-EP1-HEK cell lines. (A and C) PGT and EP1 mRNA expression levels in EP1-HEK and PGT-EP1-HEK cell lines. Cells were seeded onto six-well plates and harvested 72 h after seeding. Total RNA was extracted and mRNA was determined by qRT-PCR. PGT-EP1-HEK cells expressed ∼140-fold more PGT mRNA than EP1-HEK cells, whereas EP1-HEK and PGT-EP1-HEK cells expressed comparable levels of EP1 mRNA. (B) 3H-PGE2 uptake in EP1-HEK and PGT-EP1-HEK cell lines. Cells were seeded onto 24-well plates and 3H-PGE2 uptake was measured 72 h after seeding. PGT-expressing cells exhibited 60- to 70-fold more 3H-PGE2 uptake than EP1-HEK control cells. (D) EP1 protein expression levels in EP1-HEK and PGT-EP1-HEK cell lines. Cells were seeded onto 10-cm plates and harvested 72 h after seeding. Protein was extracted and quantified by Western blot. Upper panel shows a representative immunoblot; lower panel shows quantitation of three blots. EP1-HEK and PGT-EP1-HEK cells exhibited no difference in EP1 protein expression. Values are mean ± SEM (n = 3 for each experiment). ***P < 0.0001 by t-test.
PGT modulates EP1-mediated Ca2+ release in response to exogenously applied PGE2
EP1 receptor activation triggers intracellular Ca2+ release (Sugimoto and Narumiya 2007). Indeed, in both EP1-HEK and PGT-EP1-HEK cells, activation of EP1 by exogenous PGE2 (0.3 nmol/L to 3 μmol/L) induced a concentration-dependent rise in intracellular Ca2+ levels (Fig. 2A). However, in PGT-EP1-HEK cells, which express the PGT reuptake carrier, the dose–response curve for PGE2 was significantly right-shifted (Fig. 2A). The EC50 (half-maximal effective concentration) value for PGE2 in EP1-HEK cells was 12.8 nmol/L (95% CI = 7.2–22.8 nmol/L, n = 37 cells), whereas in PGT-EP1-HEK cells it was 86.9 nmol/L (95% CI = 51.7–146.0 nmol/L, n = 211 cells) (P < 0.01). Of note, this rightward shift of the PGE2 dose–response curve cannot be attributed to differing levels of EP1 expression (see Fig. 1C and D). The maximal response to PGE2 was slightly but not significantly lower in PGT-EP1-HEK compared to EP1-HEK cells (Fig. 2A).
Figure 2.
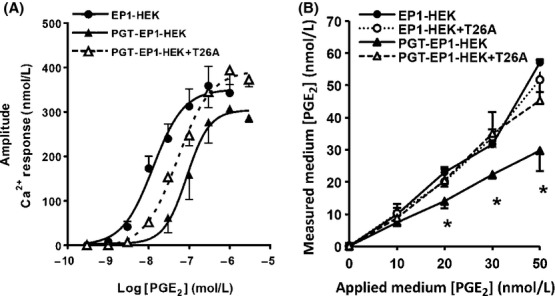
PGT modulates PGE2-induced Ca2+ responses and medium PGE2 levels. (A) Dose-dependent responses of the increase in intracellular Ca2+ concentration induced by PGE2 stimulation of EP1-HEK (n = 37 cells), and of PGT-EP1-HEK cells in the absence (n = 211 cells) and presence of the PGT blocker T26A (5 μmol/L, n = 340 cells). PGT shifted the PGE2/Ca2+ dose–response curve to the right; PGT inhibition by T26A reversed this effect (see text for statistical analyses). (B) Final PGE2 concentration in media following 10 min exposure to EP1-HEK or PGT-EP1-HEK monolayers in the presence and absence of T26A (5 μmol/L). PGT expression lowered the medium PGE2 concentration. Values are mean ± SEM (n = 3 for each experiment). *P < 0.05.
Acute inhibition of PGT transport in PGT-EP1-HEK cells with T26A (5 μmol/L) resulted in significantly higher maximal Ca2+ responses to PGE2 (P < 0.05) compared to nontreated PGT-EP1-HEK cells (Fig. 2A). T26A shifted the PGE2 dose–response curve directionally, albeit not statistically significantly, back toward that of EP1-HEK cells (EC50 = 51.8 nmol/L; 95% CI = 36.3–73.9 nmol/L, n = 324). Given the known effect of PGT to mediate PGE2 uptake from the extracellular compartment (Nomura et al. 2004), the data of Figure 2A suggest that, at any given concentration of PGE2 added to the culture medium, plasma membrane PGT lowers the PGE2 concentration at the cell surface, as revealed by a reduction in EP1 receptor activation.
To test this hypothesis further, we added exogenous PGE2 to EP1-HEK and PGT-EP1-HEK cell monolayers so as to achieve initial PGE2 concentrations of 0, 10, 20, 30, and 50 nmol/L. We then measured PGE2 concentrations in the bathing media after 10 min exposure to the monolayers. As shown in Figure 2B, in EP1-HEK cell monolayers, the medium PGE2 concentrations at 10 min were not different from the initial concentrations, indicating that, in the absence of PGT, the added PGE2 remained in the extracellular compartment. Treatment with T26A (5 μmol/L) did not affect medium PGE2 levels in EP1-HEK cells. However, in PGT-EP1-HEK cells, the medium PGE2 concentration after 10 min exposure to the monolayer was significantly reduced compared to that of control cells and, in these cells, acute inhibition of PGT with T26A returned medium PGE2 levels at 10 min to levels similar to those in EP1-HEK cells (Fig. 2B). Taken together, the data of Figure 2 indicate that PGT expression at the cell membrane affects both PGE2 availability for signaling at the cell surface as well as the bulk-fluid phase PGE2 concentration.
PGT controls endogenous PGE2 bioavailability and modulates autocrine/paracrine PGE2 signaling via the EP1 receptor
Cells synthesize and release endogenous PGE2 in response to diverse stimuli, such as bradykinin (Miller 2006). We have shown previously that PGT modulates the net release of PGE2 into the bulk cell culture medium in MDCK cells in response to bradykinin (Nomura et al. 2005). Here, we confirmed these results in HEK cells. We treated EP1-HEK and PGT-EP1-HEK cells with bradykinin (10 μmol/L) in the absence and presence of the PGT blocker T26A (5 μmol/L). As shown in Figure 3A, although bradykinin-induced PGE2 release from both EP1-HEK and PGT-EP1-HEK cells, the PGE2 concentration in the medium bathing PGT-EP1-HEK cells was significantly lower than that in the medium bathing EP1-HEK cells. Inhibiting PGT with T26A blocked the effect of PGT to lower PGE2 in the medium (Fig. 3A). These results thus confirm those we reported previously using MDCK monolayers (Nomura et al. 2005).
Figure 3.
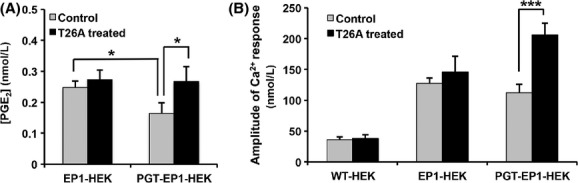
PGT modulates EP1 Ca2+ responses induced by autocrine/paracrine PGE2 signaling. (A) PGE2 concentrations in media of EP1-HEK and PGT-EP1-HEK cells treated with 10 μmol/L bradykinin in the absence or presence of 5 μmol/L T26A for 30 min at 37°C. Medium [PGE2] was lower in cells expressing PGT, but not when PGT was inhibited with T26A. Values are mean ± SEM (n = 3 for each experiment). *P < 0.05. (B) Bradykinin-induced EP1 signaling (Ca2+ responses) in WT-HEK, EP1-HEK, and PGT-EP1-HEK cells. EP1-expressing cells had a Ca2+ response to bradykinin above that of wild-type cells. In cells that were also expressing PGT, the PGT inhibitor T26A doubled the degree of signaling via EP1. Data are mean ± SEM (n ≥ 4 for each experiment), with >100 cells analyzed per experiment and per experimental condition. *P < 0.05, ***P < 0.001.
Next, we examined the ramifications of this PGT effect on autocrine EP1 signaling. Bradykinin induces intracellular Ca2+ release in HEK 293 cells by activating B2 receptors (Kramarenko et al. 2009). All three cell lines (WT-HEK, EP1-HEK, and PGT-EP1-HEK) responded to bradykinin with an increase in intracellular Ca2+ levels, although the amplitude of the response was about threefold higher (P < 0.05) in the two cell lines overexpressing the EP1 receptor compared to wild-type cells (Fig. 3B). Thus, most of the bradykinin-induced Ca2+ response in EP1-HEK and PGT-EP1-HEK cells results from signaling through EP1. The amplitude of the Ca2+ response to bradykinin in PGT-EP1-HEK cells doubled when these cells were treated with the PGT blocker T26A (Fig. 3B). Taken together, the data of Figure 3 indicate that PGT controls the concentration of extracellular PGE2 in this autocrine signaling system, and that the resulting cell surface PGE2 concentration is reflected in the degree of signaling through EP1 receptors.
PGT modulates autocrine/paracrine signaling through the EP4 receptor
In addition to Ca2+, another important second messenger for PGE2 is intracellular cAMP, resulting from activation of either the EP2 or EP4 receptor by PGE2. We tested the hypothesis that, as with the EP1 receptor, PGT regulates EP4-mediated autocrine/paracrine signaling. We constructed a cell system consisting of wild-type MDCK cells (“WT-MDCK”) or MDCK cells that were stably transfected with PGT tagged with GFP (green fluorescent protein) at the carboxyl terminus (“PGT-GFP-MDCK”) (Endo et al. 2002). These cell lines were then transiently transfected with an EP4 receptor-expressing cDNA. As above, we stimulated both cell lines with bradykinin so as to induce acute, autocrine/paracrine signaling of EP4 receptors by endogenous PGE2.
As shown in Figure 4A, although bradykinin-induced the net release of PGE2 from both cell lines, expression of PGT significantly reduced the extracellular PGE2 concentration compared to control, whereas blocking PGT activity with T26A (5 μmol/L) reversed this reduction. As shown in Figure 4B, bradykinin-induced intracellular cAMP production was significantly lower in PGT-GFP-MDCK cells compared to controls, and T26A treatment reversed this effect. These findings demonstrate that, as with EP1 signaling via intracellular Ca2+, PGT regulates autocrine/paracrine signaling by the EP4 receptor via cAMP.
Figure 4.
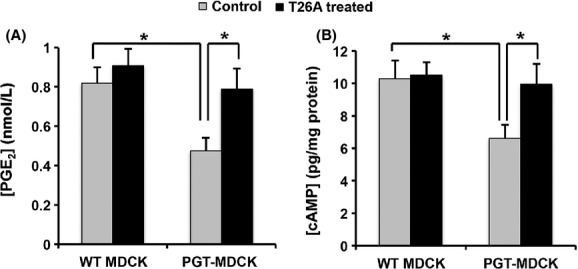
PGT regulates cAMP accumulation in response to autocrine/paracrine EP4-mediated PGE2 signaling. WT-MDCK and PGT-GFP-MDCK cells were transiently transfected with the EP4 receptor cDNA for 24 h, then incubated for 18 h with 250 μmol/L IBMX, and afterward treated with 10 μmol/L bradykinin in the absence or presence of 5 μmol/L T26A for 30 min. (A) PGE2 concentrations in the media. (B) Intracellular cAMP accumulation. PGT expression reduced both the concentration of PGE2 in the medium and the accumulation of intracellular cAMP in response to 30 min exposure to bradykinin. Both of these PGT effects were reversed by the PGT inhibitor T26A. Values are mean ± SEM (n = 3 for each experiment). *P < 0.05.
PGT modulates homologous desensitization of the EP4 receptor in response to exogenous PGE2
The EP2, EP3, and EP4 receptors undergo homologous desensitization in response to pharmacological addition of extracellular PGE2 (Negishi et al. 1993; Nishigaki et al. 1996; Ashby 1998). To test the hypothesis that PGT modulates agonist-induced EP4 desensitization, we transiently transfected WT-MDCK cells and PGT-GFP-MDCK cells with the human EP4 receptor cDNA and determined cell surface EP4 expression by a ligand-binding assay in response to exogenous PGE2 (0–50 nmol/L).
As shown in Figure 5A, in WT-MDCK cells (“WT”), exogenous PGE2 caused dose-dependent EP4 desensitization, such that exposure to 50 nmol/L PGE2 induced desensitization of about 50% of cell surface EP4 receptors. In contrast, in cells expressing PGT (“PGT-MDCK”), PGE2-induced EP4 desensitization was significantly abrogated. Although, T26A (5 μmol/L) had no effect on PGE2-induced EP4 desensitization in WT-MDCK cells, it inhibited PGT-mediated EP4 retention on the cell surface.
Figure 5.
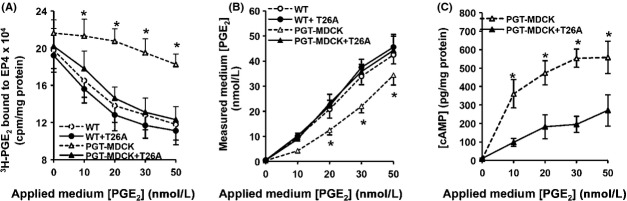
PGT regulates EP4 receptor desensitization in response to exogenous PGE2. Wild-type MDCK (“WT”) and PGT-GFP-MDCK (“PGT-MDCK”) cells were transiently transfected with the EP4-expressing cDNA, and 24 h later were exposed to pharmacological concentrations of exogenous PGE2 (0–50 nmol/L, “applied medium [PGE2]”) in the presence or absence of 5 μmol/L T26A. After 10 min, media were collected for determining residual extracellular PGE2 concentrations by ELISA, and cells were harvested for quantifying the amount of cell surface EP4 receptor using a binding assay. (A) Cell surface EP4 receptor. Exogenous PGE2 caused a reduction in cell surface EP4 (i.e., desensitization) in wild-type MDCK cells (open circles); T26A had no effect on this desensitization (closed circles). When PGT was expressed, it abrogated the ability of PGE2 to cause EP4 desensitization (open triangles), an effect that was reversed by the PGT inhibitor T26A (closed triangles). (B) Media [PGE2] at the conclusion of 10 min exposure to cell monolayers. PGT reduced the concentration of PGE2 in the media (open triangles) compared to the lack of change in wild-type cells (open circles) or wild- type cells exposed to T26A (closed circles). T26A reversed the ability of PGT to lower media [PGE2] (closed triangles). (C) Intracellular cAMP accumulation. PGT-GFP-MDCK cells (“PGT-MDCK”) were transfected with EP4 as above, treated with 250 μmol/L IBMX for 18 h, and exposed to exogenous PGE2 ± T26A for 10 min at various doses as above. Cells expressing uninhibited PGT (absent T26A, open triangles) exhibited a robust cAMP dose-response to PGE2, whereas PGT-MDCK cells in which PGT was inhibited by T26A (open triangles) exhibited a significantly blunted cAMP response to exogenous PGE2. Values are mean ± SEM (n = 3 for each experiment). *P < 0.05.
PGT-mediated modulation of EP4 desensitization involves PGT-mediated removal of exogenous PGE2, as shown in Figure 5B. The measured PGE2 concentration in the medium 10 min after PGE2 addition to the cell monolayer was significantly lower in PGT-GFP-MDCK cells compared to that in WT-MDCK cells. When PGT was acutely inhibited by T26A, extracellular PGE2 levels measured in media exposed to PGT-GFP-MDCK cells were not different from those observed using WT-MDCK cells (Fig. 5B).
The downstream signaling consequences of these changes in EP4 receptor desensitization are shown in Figure 5C. In PGT-GFP-MDCK cells, PGE2 increased intracellular cAMP accumulation in a dose-dependent manner to a degree that was significantly greater when PGT was active than when it was inhibited (Fig. 5C).
Together, the data presented in Figure 5 suggest a model in which plasma membrane PGT determines the cell surface PGE2 concentration which, in turn, determines the degree of short-term, agonist-induced desensitization. The degree of desensitization, in turn, determines the degree of intracellular cAMP accumulation in response to exogenous PGE2.
Discussion
The present studies show that the PGT modulates PGE2 signaling by altering ligand concentration at cell surface receptors. Our findings provide a molecular mechanism for several recent reports in which acute or chronic manipulation of PGT transporter activity altered downstream physiological events. These include relaxation of tracheal smooth muscle by stimulants of protease-activated receptor-2 (Henry et al. 2005), astrocyte-mediated cerebral vasodilation (Gordon et al. 2008), regulation of preadipocyte aromatase activity by PGE2 (Subbaramaiah et al. 2011), and maintenance of a functional corpus luteum (Lee et al. 2013).
Our results may also provide insight into the mechanisms underlying failure of postnatal closure of the ductus arteriosus in mice (Chang et al. 2010), and of pachydermoperiostosis in humans, both of which result from homozygous null PGT alleles (Busch et al. 2012; Diggle et al. 2012; Sasaki et al. 2012; Seifert et al. 2012; Zhang et al. 2012). Although, as described above, an argument can be made that these phenotypes represent PGE2 acting systemically as a hormone, the present results suggest that at least some of the vascular, skeletal, and/or dermal phenotypes resulting from PGT inactivation may represent abnormal autocrine/paracrine PGE2 signaling.
The ability of the PGT transporter to compete with EP receptors for ligand is dependent on the respective abilities of the transporter and the receptors to bind, and turn over, the ligand. The binding constant of PGE2 to PGT is about 90 nmol/L (Kanai et al. 1995), and that of PGE2 for EP1 and EP4 is in the range of 2–20 nmol/L (Narumiya et al. 1999). Although PGT binds PGE2 more weakly than does EP1 or EP4, it is apparently able to compete for the ligand even when EP receptors are overexpressed, suggesting that PGT likely turns over PGE2 faster than do the receptors.
EP1 signaling is mediated by intracellular Ca2+ release. Regardless of whether the source of PGE2 was endogenous (i.e., postbradykinin) or exogenous, PGT lowered the amount of cell surface PGE2 and reduced EP1 signaling (Figs. 2, 3). Similarly, PGT reduced EP4-mediated intracellular cAMP accumulation when the source of PGE2 was endogenous (postbradykinin) (Fig. 4). However, when exogenous PGE2 in pharmacological concentrations was introduced, EP4 exhibited rapid desensitization in accord with prior studies (Nishigaki et al. 1996). In that case, PGT reduced cell surface PGE2 and abrogated EP4 desensitization, resulting in an increase in cAMP formation (Fig. 5). Thus, in the case of EP4 signaling, the net result of competition for ligand between PGT and the EP4 receptor depends on the source, timing, and concentration of the cell surface PGE2.
As above, we have previously drawn an analogy between neurotransmitter release/reuptake at the synapse and PG release/reuptake by cells engaged in autocrine/paracrine PG signaling (Nomura et al. 2005). The present studies allow us to extend this analogy insofar as we now show that PGT, like neurotransmitter reuptake carriers, regulates availability of ligand for its GPCR. The analogy is of further interest in that both neurotransmitter and PG reuptake carriers are regulated by their respective ligands. Thus, dopamine activates the dopamine reuptake carrier through dopamine receptors (Zapata et al. 2007), and the PGT substrate PGF2α inhibits PGT through the FP receptor (Vezza et al. 2001).
In the same way that inhibitors of neurotransmitter reuptake have been useful in the management of psychiatric diseases (Mann 2005), inhibitors of prostaglandin reuptake, by raising endogenous PG levels (Chi et al. 2011; Syeda et al. 2012), might be medicinally applicable for conditions in which exogenous prostaglandins are currently used, such as glaucoma (Stjernschantz 2004), pulmonary artery hypertension (Gomberg-Maitland and Olschewski 2008), and vascular insufficiency (Amendt 2005). Because we found that the PGT inhibitor T26A increased autocrine/paracrine signaling through EP1 and EP4 receptors only in the presence of PGT, it appears that T26A does not interact directly with these two PGE2 receptors. Thus, T26A or its derivatives may offer a small-molecule approach to raising endogenous prostaglandin levels.
Finally, we note that there are currently approximately 120 orphan GPCRs (Civelli 2005; Oh et al. 2006) and 90 orphan SLC transporters (Dahlin et al. 2009; Schlessinger et al. 2010), all with unassigned ligands. The present findings show that regulatory competition between GPCRs and SLC carriers occurs outside of the synaptic cleft, and thus may represent a more general phenomenon than previously appreciated.
Acknowledgments
We thank David Spray (Albert Einstein College of Medicine) for helpful discussions and Janos Peti-Peterdi (University of Southern California, CA) for the EP1-HEK cells.
Glossary
- DMEM
Dulbecco's modified Eagle's medium
- EP1-HEK
HEK cells stably expressing the PGE2 receptor EP1
- EP
prostaglandin E2 receptor
- FBS
fetal bovine serum
- Fura-2 AM
fura-2 acetoxymethyl ester
- G418
geneticin
- GAPDH
glyceraldehyde phosphate dehydrogenase
- GFP
green fluorescence protein
- GPCR
G-protein-coupled receptor
- HEK
human embryonic kidney
- HPGD
15-hydroxyprostaglandin dehydrogenase
- HRP
horseradish peroxidase
- MDCK
Madin–Darby Canine Kidney
- P/S
penicillin/streptomycin
- PBS
phosphate-buffered saline
- PGE2
prostaglandin E2
- PGF2α
prostaglanding F2α
- PG
prostaglandin
- PGT-EP1-HEK
HEK cells stably expressing both the PGE2 receptor EP1 and the prostaglandin transporter PGT
- PGT-GFP-MDCK
MDCK cells stably expressing GFP-tagged PGT
- PGT
prostaglandin transporter
- PSF
phenylmethyl sulfonyl fluoride
- SLC
solute carrier
- T26A
N-(2-(2-(2-azidoethoxy)ethoxy)ethyl)-4-((4-((2-(2-(2-benzamidoethoxy) ethoxy)ethyl)amino)-6-((4-hydroxyphenyl)amino)-1,3,5-triazin-2-yl)amino)benzamide
- WT-HEK
wild-type HEK cell line
Disclosures
None declared.
References
- Amendt K. PGE1 and other prostaglandins in the treatment of intermittent claudication: a meta-analysis. Angiology. 2005;56:409–415. doi: 10.1177/000331970505600408. [DOI] [PubMed] [Google Scholar]
- Ashby B. Co-expression of prostaglandin receptors with opposite effects: a model for homeostatic control of autocrine and paracrine signaling. Biochem Pharmacol. 1998;55:239–246. doi: 10.1016/s0006-2952(97)00241-4. [DOI] [PubMed] [Google Scholar]
- Bao Y, Pucci ML, Chan BS, Lu R, Ito S, Schuster VL. Prostaglandin transporter PGT is expressed in cell types that synthesize and release prostanoids. Am J Physiol Renal Physiol. 2002;282:F1103–F1110. doi: 10.1152/ajprenal.00152.2001. [DOI] [PubMed] [Google Scholar]
- Busch J, Frank V, Bachmann N, Otsuka A, Oji V, Metze D, et al. Mutations in the prostaglandin transporter SLCO2A1 cause primary hypertrophic osteoarthropathy with digital clubbing. J Invest Dermatol. 2012;132:2473–2476. doi: 10.1038/jid.2012.146. [DOI] [PubMed] [Google Scholar]
- Cattral MS, Altraif I, Greig PD, Blendis L, Levy GA. Toxic effects of intravenous and oral prostaglandin E therapy in patients with liver disease. Am J Med. 1994;97:369–373. doi: 10.1016/0002-9343(94)90305-0. [DOI] [PubMed] [Google Scholar]
- Chang HY, Locker J, Lu R, Schuster VL. Failure of postnatal ductus arteriosus closure in prostaglandin transporter-deficient mice. Circulation. 2010;121:529–536. doi: 10.1161/CIRCULATIONAHA.109.862946. [DOI] [PMC free article] [PubMed] [Google Scholar]
- Chi Y, Khersonsky SM, Chang YT, Schuster VL. Identification of a new class of prostaglandin transporter inhibitors and characterization of their biological effects on prostaglandin E2 transport. J Pharmacol Exp Ther. 2006;316:1346–1350. doi: 10.1124/jpet.105.091975. [DOI] [PubMed] [Google Scholar]
- Chi Y, Min J, Jasmin JF, Lisanti MP, Chang YT, Schuster VL. Development of a high affinity inhibitor of the prostaglandin transporter PGT. J Pharmacol Exp Ther. 2011;339:633–641. doi: 10.1124/jpet.111.181354. [DOI] [PMC free article] [PubMed] [Google Scholar]
- Civelli O. GPCR deorphanizations: the novel, the known and the unexpected transmitters. Trends Pharmacol Sci. 2005;26:15–19. doi: 10.1016/j.tips.2004.11.005. [DOI] [PubMed] [Google Scholar]
- Dahlin A, Royall J, Hohmann JG, Wang J. Expression profiling of the solute carrier gene family in the mouse brain. J Pharmacol Exp Ther. 2009;329:558–570. doi: 10.1124/jpet.108.149831. [DOI] [PMC free article] [PubMed] [Google Scholar]
- Diggle CP, Parry DA, Logan CV, Laissue P, Rivera C, Restrepo CM, et al. Prostaglandin transporter mutations cause pachydermoperiostosis with myelofibrosis. Hum Mutat. 2012;33:1175–1181. doi: 10.1002/humu.22111. [DOI] [PubMed] [Google Scholar]
- Drvaric DM, Parks WJ, Wyly JB, Dooley KJ, Plauth WH, Jr, Schmitt EW. Prostaglandin-induced hyperostosis. A case report. Clin Orthop Relat Res. 1989;246:300–304. [PubMed] [Google Scholar]
- Endo S, Nomura T, Chan BS, Lu R, Pucci ML, Bao Y, et al. Expression of PGT in MDCK cell monolayers: polarized apical localization and induction of active PG transport. Am J Physiol Renal Physiol. 2002;282:F618–F622. doi: 10.1152/ajprenal.00150.2001. [DOI] [PubMed] [Google Scholar]
- Gether U, Andersen PH, Larsson OM, Schousboe A. Neurotransmitter transporters: molecular function of important drug targets. Trends Pharmacol Sci. 2006;27:375–383. doi: 10.1016/j.tips.2006.05.003. [DOI] [PubMed] [Google Scholar]
- Gomberg-Maitland M, Olschewski H. Prostacyclin therapies for the treatment of pulmonary arterial hypertension. Eur Respir J. 2008;31:891–901. doi: 10.1183/09031936.00097107. [DOI] [PubMed] [Google Scholar]
- Gordon GR, Choi HB, Rungta RL, Ellis-Davies GC, MacVicar BA. Brain metabolism dictates the polarity of astrocyte control over arterioles. Nature. 2008;456:745–749. doi: 10.1038/nature07525. [DOI] [PMC free article] [PubMed] [Google Scholar]
- Greengard P. The neurobiology of slow synaptic transmission. Science. 2001;294:1024–1030. doi: 10.1126/science.294.5544.1024. [DOI] [PubMed] [Google Scholar]
- Henry PJ, D'Aprile A, Self G, Hong T, Mann TS. Inhibitors of prostaglandin transport and metabolism augment protease-activated receptor-2-mediated increases in prostaglandin E2 levels and smooth muscle relaxation in mouse isolated trachea. J Pharmacol Exp Ther. 2005;314:995–1001. doi: 10.1124/jpet.105.086124. [DOI] [PubMed] [Google Scholar]
- Kanai N, Lu R, Satriano JA, Bao Y, Wolkoff AW, Schuster VL. Identification and characterization of a prostaglandin transporter. Science. 1995;268:866–869. doi: 10.1126/science.7754369. [DOI] [PubMed] [Google Scholar]
- Kramarenko II, Bunni MA, Morinelli TA, Raymond JR, Garnovskaya MN. Identification of functional bradykinin B(2) receptors endogenously expressed in HEK293 cells. Biochem Pharmacol. 2009;77:269–276. doi: 10.1016/j.bcp.2008.09.027. [DOI] [PMC free article] [PubMed] [Google Scholar]
- Kristensen AS, Andersen J, Jorgensen TN, Sorensen L, Eriksen J, Loland CJ, et al. SLC6 neurotransmitter transporters: structure, function, and regulation. Pharmacol Rev. 2011;63:585–640. doi: 10.1124/pr.108.000869. [DOI] [PubMed] [Google Scholar]
- Kudo I, Murakami M. Phospholipase A2 enzymes. Prostaglandins Other Lipid Mediat. 2002;68–69:3–58. doi: 10.1016/s0090-6980(02)00020-5. [DOI] [PubMed] [Google Scholar]
- Lee J, McCracken JA, Banu SK, Arosh JA. Intrauterine inhibition of prostaglandin transporter protein blocks release of luteolytic PGF2alpha pulses without suppressing endometrial expression of estradiol or oxytocin receptor in ruminants. Biol Reprod. 2013;89:27. doi: 10.1095/biolreprod.112.106427. [DOI] [PubMed] [Google Scholar]
- Lefkowitz RJ. G protein-coupled receptor kinases. Cell. 1993;74:409–412. doi: 10.1016/0092-8674(93)80042-d. [DOI] [PubMed] [Google Scholar]
- Letts M, Pang E, Simons J. Prostaglandin-induced neonatal periostitis. J Pediatr Orthop. 1994;14:809–813. doi: 10.1097/01241398-199414060-00023. [DOI] [PubMed] [Google Scholar]
- Mann JJ. The medical management of depression. N Engl J Med. 2005;353:1819–1834. doi: 10.1056/NEJMra050730. [DOI] [PubMed] [Google Scholar]
- Miller SB. Prostaglandins in health and disease: an overview. Semin Arthritis Rheum. 2006;36:37–49. doi: 10.1016/j.semarthrit.2006.03.005. [DOI] [PubMed] [Google Scholar]
- Murakami M, Kudo I. Recent advances in molecular biology and physiology of the prostaglandin E2-biosynthetic pathway. Prog Lipid Res. 2004;43:3–35. doi: 10.1016/s0163-7827(03)00037-7. [DOI] [PubMed] [Google Scholar]
- Narumiya S, Sugimoto Y, Ushikubi F. Prostanoid receptors: structures, properties, and functions. Physiol Rev. 1999;79:1193–1226. doi: 10.1152/physrev.1999.79.4.1193. [DOI] [PubMed] [Google Scholar]
- Negishi M, Sugimoto Y, Irie A, Narumiya S, Ichikawa A. Two isoforms of prostaglandin E receptor EP3 subtype. Different COOH-terminal domains determine sensitivity to agonist-induced desensitization. J Biol Chem. 1993;268:9517–9521. [PubMed] [Google Scholar]
- Neuschafer-Rube F, Hermosilla R, Rehwald M, Ronnstrand L, Schulein R, Wernstedt C, et al. Identification of a Ser/Thr cluster in the C-terminal domain of the human prostaglandin receptor EP4 that is essential for agonist-induced beta-arrestin1 recruitment but differs from the apparent principal phosphorylation site. Biochem J. 2004;379:573–585. doi: 10.1042/BJ20031820. [DOI] [PMC free article] [PubMed] [Google Scholar]
- Nishigaki N, Negishi M, Ichikawa A. Two Gs-coupled prostaglandin E receptor subtypes, EP2 and EP4, differ in desensitization and sensitivity to the metabolic inactivation of the agonist. Mol Pharmacol. 1996;50:1031–1037. [PubMed] [Google Scholar]
- Nomura T, Lu R, Pucci ML, Schuster VL. The two-step model of prostaglandin signal termination: in vitro reconstitution with the prostaglandin transporter and prostaglandin 15 dehydrogenase. Mol Pharmacol. 2004;65:973–978. doi: 10.1124/mol.65.4.973. [DOI] [PubMed] [Google Scholar]
- Nomura T, Chang HY, Lu R, Hankin J, Murphy RC, Schuster VL. Prostaglandin signaling in the renal collecting duct: release, reuptake, and oxidation in the same cell. J Biol Chem. 2005;280:28424–28429. doi: 10.1074/jbc.M408286200. [DOI] [PubMed] [Google Scholar]
- Oh DY, Kim K, Kwon HB, Seong JY. Cellular and molecular biology of orphan G protein-coupled receptors. Int Rev Cytol. 2006;252:163–218. doi: 10.1016/S0074-7696(06)52003-0. [DOI] [PubMed] [Google Scholar]
- Peti-Peterdi J, Komlosi P, Fuson AL, Guan Y, Schneider A, Qi Z, et al. Luminal NaCl delivery regulates basolateral PGE2 release from macula densa cells. J Clin Invest. 2003;112:76–82. doi: 10.1172/JCI18018. [DOI] [PMC free article] [PubMed] [Google Scholar]
- Reese J, Paria BC, Brown N, Zhao X, Morrow JD, Dey SK. Coordinated regulation of fetal and maternal prostaglandins directs successful birth and postnatal adaptation in the mouse. Proc Natl Acad Sci USA. 2000;97:9759–9764. doi: 10.1073/pnas.97.17.9759. [DOI] [PMC free article] [PubMed] [Google Scholar]
- Ringel RE, Brenner JI, Haney PJ, Burns JE, Moulton AL, Berman MA. Prostaglandin-induced periostitis: a complication of long-term PGE1 infusion in an infant with congenital heart disease. Radiology. 1982;142:657–658. doi: 10.1148/radiology.142.3.7199748. [DOI] [PubMed] [Google Scholar]
- Saadat S, Sendtner M, Rohrer H. Ciliary neurotrophic factor induces cholinergic differentiation of rat sympathetic neurons in culture. J Cell Biol. 1989;108:1807–1816. doi: 10.1083/jcb.108.5.1807. [DOI] [PMC free article] [PubMed] [Google Scholar]
- Sasaki T, Niizeki H, Shimizu A, Shiohama A, Hirakiyama A, Okuyama T, et al. Identification of mutations in the prostaglandin transporter gene SLCO2A1 and its phenotype-genotype correlation in Japanese patients with pachydermoperiostosis. J Dermatol Sci. 2012;68:36–44. doi: 10.1016/j.jdermsci.2012.07.008. [DOI] [PubMed] [Google Scholar]
- Schlessinger A, Matsson P, Shima JE, Pieper U, Yee SW, Kelly L, et al. Comparison of human solute carriers. Protein Sci. 2010;19:412–428. doi: 10.1002/pro.320. [DOI] [PMC free article] [PubMed] [Google Scholar]
- Seifert W, Kuhnisch J, Tuysuz B, Specker C, Brouwers A, Horn D. Mutations in the prostaglandin transporter encoding gene SLCO2A1 cause primary hypertrophic osteoarthropathy and isolated digital clubbing. Hum Mutat. 2012;33:660–664. doi: 10.1002/humu.22042. [DOI] [PubMed] [Google Scholar]
- Smith WL, DeWitt DL, Garavito RM. Cyclooxygenases: structural, cellular, and molecular biology. Annu Rev Biochem. 2000;69:145–182. doi: 10.1146/annurev.biochem.69.1.145. [DOI] [PubMed] [Google Scholar]
- Stichtenoth DO, Thoren S, Bian H, Peters-Golden M, Jakobsson PJ, Crofford LJ. Microsomal prostaglandin E synthase is regulated by proinflammatory cytokines and glucocorticoids in primary rheumatoid synovial cells. J Immunol. 2001;167:469–474. doi: 10.4049/jimmunol.167.1.469. [DOI] [PubMed] [Google Scholar]
- Stjernschantz J. Studies on ocular inflammation and development of a prostaglandin analogue for glaucoma treatment. Exp Eye Res. 2004;78:759–766. doi: 10.1016/j.exer.2003.11.016. [DOI] [PubMed] [Google Scholar]
- Suadicani SO, Flores CE, Urban-Maldonado M, Beelitz M, Scemes E. Gap junction channels coordinate the propagation of intercellular Ca2+ signals generated by P2Y receptor activation. Glia. 2004;48:217–229. doi: 10.1002/glia.20071. [DOI] [PMC free article] [PubMed] [Google Scholar]
- Suadicani SO, Brosnan CF, Scemes E. P2X7 receptors mediate ATP release and amplification of astrocytic intercellular Ca2+ signaling. J Neurosci. 2006;26:1378–1385. doi: 10.1523/JNEUROSCI.3902-05.2006. [DOI] [PMC free article] [PubMed] [Google Scholar]
- Subbaramaiah K, Hudis CA, Dannenberg AJ. The prostaglandin transporter regulates adipogenesis and aromatase transcription. Cancer Prev Res (Phila) 2011;4:194–206. doi: 10.1158/1940-6207.CAPR-10-0367. [DOI] [PubMed] [Google Scholar]
- Sugimoto Y, Narumiya S. Prostaglandin E receptors. J Biol Chem. 2007;282:11613–11617. doi: 10.1074/jbc.R600038200. [DOI] [PubMed] [Google Scholar]
- Syeda MM, Jing X, Mirza RH, Yu H, Sellers RS, Chi Y. Prostaglandin transporter modulates wound healing in diabetes by regulating prostaglandin-induced angiogenesis. Am J Pathol. 2012;181:334–346. doi: 10.1016/j.ajpath.2012.03.012. [DOI] [PubMed] [Google Scholar]
- Tai HH, Ensor CM, Tong M, Zhou H, Yan F. Prostaglandin catabolizing enzymes. Prostaglandins Other Lipid Mediat. 2002;68–69:483–493. doi: 10.1016/s0090-6980(02)00050-3. [DOI] [PubMed] [Google Scholar]
- Ueda K, Saito A, Nakano H, Aoshima M, Yokota M, Muraoka R, et al. Cortical hyperostosis following long-term administration of prostaglandin E1 in infants with cyanotic congenital heart disease. J Pediatr. 1980;97:834–836. doi: 10.1016/s0022-3476(80)80282-4. [DOI] [PubMed] [Google Scholar]
- Vezza R, Rokach J, Fitzgerald GF. Prostaglandin F2alpha receptor-dependent regulation of prostaglandin transport. Mol Pharmacol. 2001;59:1506–1513. doi: 10.1124/mol.59.6.1506. [DOI] [PubMed] [Google Scholar]
- Zapata A, Kivell B, Han Y, Javitch JA, Bolan EA, Kuraguntla D, et al. Regulation of dopamine transporter function and cell surface expression by D3 dopamine receptors. J Biol Chem. 2007;282:35842–35854. doi: 10.1074/jbc.M611758200. [DOI] [PubMed] [Google Scholar]
- Zhang Z, Xia W, He J, Ke Y, Yue H, Wang C, et al. Exome sequencing identifies SLCO2A1 mutations as a cause of primary hypertrophic osteoarthropathy. Am J Hum Genet. 2012;90:125–132. doi: 10.1016/j.ajhg.2011.11.019. [DOI] [PMC free article] [PubMed] [Google Scholar]