Summary
The ability of mammals to produce urine hyperosmotic to plasma requires the generation of a gradient of increasing osmolality along the medulla from the corticomedullary junction to the papilla tip. Countercurrent multiplication apparently establishes this gradient in the outer medulla, where there is substantial transepithelial reabsorption of NaCl from the water-impermeable thick ascending limbs of the loops of Henle. However, this process does not establish the much steeper osmotic gradient in the inner medulla, where there are no thick ascending limbs of the loops of Henle and the water-impermeable ascending thin limbs lack active transepithelial transport of NaCl or any other solute. The mechanism generating the osmotic gradient in the inner medulla remains an unsolved mystery, although it is generally considered to involve countercurrent flows in the tubules and vessels. A possible role for the three-dimensional interactions between these inner medullary tubules and vessels in the concentrating process is suggested by creation of physiologic models that depict the three-dimensional relationships of tubules and vessels and their solute and water permeabilities in rat kidneys and by creation of mathematical models based on biologic phenomena. The current mathematical model, which incorporates experimentally determined or estimated solute and water flows through clearly defined tubular and interstitial compartments, predicts a urine osmolality in good agreement with that observed in moderately antidiuretic rats. The current model provides substantially better predictions than previous models; however, the current model still fails to predict urine osmolalities of maximally concentrating rats.
Introduction
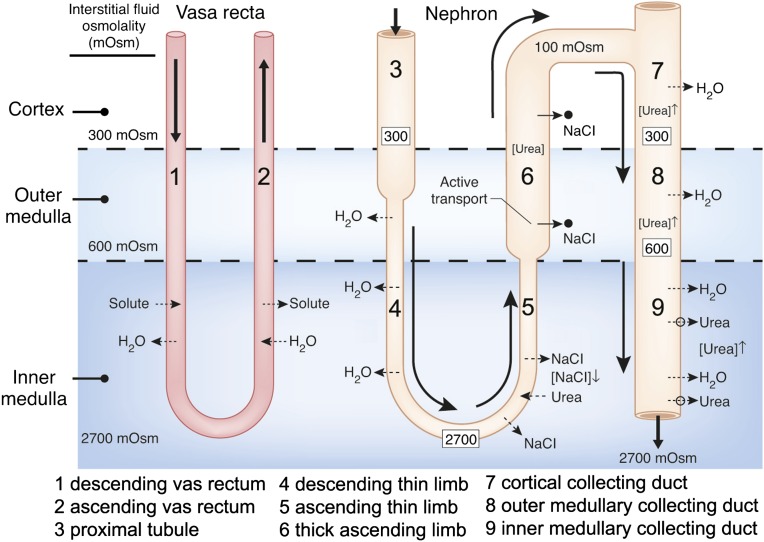
Humans, like most mammals, are capable of producing urine that is hyperosmotic to their plasma, thereby enabling them to excrete solutes with a minimal loss of water, a process clearly essential to human health and normal daily activity. This urine-concentrating process involves generation of a gradient of increasing osmolality along the renal medulla from the corticomedullary junction to the tip of the papilla (as illustrated for the rat kidney in Figure 1) (1–3). This osmotic gradient is formed by the accumulation of solutes, primarily NaCl and urea, in the cells, interstitium, tubules, and vessels of the medulla (4–6). In the presence of antidiuretic hormone (arginine vasopressin), the osmotic water permeability of the collecting duct (CD) epithelium increases, water moves from the CDs into the more concentrated interstitium, and the osmolality of the CD fluid increases, nearly equaling the osmolality of the surrounding interstitium in maximum antidiuresis.
Figure 1.
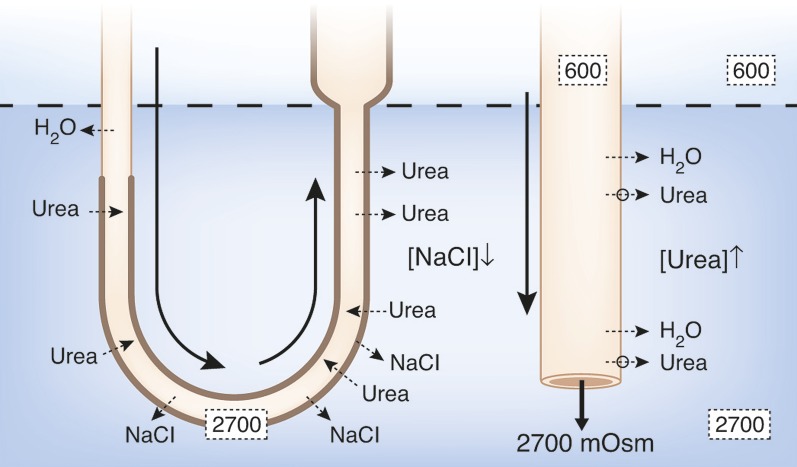
Diagram of a single vas rectum and single long-looped nephron, illustrating how classic countercurrent multiplication could produce the osmotic gradient in the outer medulla, and how the “passive mechanism” was proposed to produce the osmotic gradient in the inner medulla (23,24). In the outer medulla, active transport of NaCl out of the water-impermeable thick ascending limb (indicated by solid arrows and black dots) creates the small osmotic pressure difference between that limb and the descending limb sufficient for classic countercurrent multiplication to generate the osmotic gradient (approximate osmolalities for rat kidney given by numbers in the black boxes). For the proposed “passive” mechanism in the inner medulla, urea ([urea]) is concentrated ([urea]↑) in urea-impermeable cortical and outer medullary collecting ducts by reabsorption of NaCl and water (broken arrows indicate passive movement). Urea then moves passively out of the inner medullary collecting ducts via vasopressin-regulated urea transporters (UT-A1, UT-A3; open circles and broken lines) into the surrounding inner medulla interstitium. This increased concentration of urea in the inner medullary interstitium draws water from descending thin limbs (DTLs) and inner medullary collecting ducts (IMCDs), thereby reducing inner medullary interstitial concentration of NaCl ([NaCl]↓). These processes result in a urea concentration in the interstitium that is higher than the urea concentration in the ascending thin limbs (ATLs) and a NaCl concentration in the ATLs that is higher than the NaCl concentration in the interstitium. NaCl will then tend to diffuse out of the ATLs (broken arrows) and urea will tend to diffuse into the ATLs (broken arrows). If the permeability of the ATLs to NaCl is sufficiently high and to urea sufficiently low, the interstitial fluid will be concentrated (producing the osmotic gradient) as the ATL fluid is being diluted. Countercurrent exchange of solutes and water helping to preserve this gradient is indicated in the vas rectum. Segments are numbered according to key.
The mechanism by which the medullary osmotic gradient is generated is only partially understood. Between 1940 and 1960, a series of experimental and theoretical studies (6–9) appeared to provide a mechanism for generating this gradient. These studies indicated that a small osmotic pressure difference between the ascending and descending limbs of the loops of Henle, generated by net transport of solute, unaccompanied by water, out of the ascending limbs could be multiplied by countercurrent flow in the loops to generate the corticopapillary osmotic gradient (Figure 1). Washout of this gradient would be mitigated by countercurrent exchange in the vasa recta. The processes of countercurrent multiplication and countercurrent exchange for generating and maintaining the medullary osmotic gradient, respectively, are emphasized in most texts on renal physiology.
The classic concept of countercurrent multiplication, although recently challenged (10), has been widely accepted as generating the osmotic gradient in the outer medulla. Here, the well documented active transport of NaCl out of the water-impermeable thick ascending limbs (TALs) (11,12) has been shown to be theoretically sufficient to generate the observed gradient (13) (Figure 1).
The classic countercurrent multiplication hypothesis, however, has not been accepted for the inner medulla (IM), where the steepest part of the osmotic gradient is generated (Figure 1) but where there are no TALs of the loops of Henle. Although the ascending thin limbs (ATLs) in the IM, like the TALs in the outer medulla, have essentially no transepithelial osmotic water permeability (14–17), they also have no known active transepithelial transport of NaCl or any other solute (16,18–21). If this steep osmotic gradient in the IM is not generated by the same mechanism as the gradient in the outer medulla, how, then, is it generated? Most scientists who study the urine-concentrating process believe that some form of countercurrent multiplication involving the thin limbs generates the gradient. However, there is no accepted mechanism for how a countercurrent multiplication system might work.
The most influential and frequently cited explanation of the urine-concentrating mechanism in the IM is the “passive mechanism” hypothesis proposed simultaneously and independently in 1972 by Kokko and Rector (22) and Stephenson (23). They hypothesized that separation of NaCl from urea by active transport of NaCl (without urea or water) out of the TAL in the outer medulla provides a source of potential energy for generating an osmotic gradient in the IM (Figure 1). They suggested that urea, which has been concentrated in the CDs in the cortex and outer medulla by reabsorption of NaCl and water, diffuses out of the inner medullary CDs (IMCDs) into the surrounding inner medullary interstitium. This increased inner medullary interstitial urea concentration, in turn, draws water from the descending thin limbs (DTLs) and IMCDs, thereby reducing the inner medullary interstitial concentration of NaCl. These processes result in a urea concentration in the interstitium that is higher than the urea concentration in the ATLs, and a NaCl concentration in the ATLs that is higher than the NaCl concentration in the interstitium. NaCl will then tend to diffuse out of the ATLs into the interstitium, and urea will tend to diffuse from the interstitium into the ATLs. If the permeability of the ATLs to NaCl is sufficiently high and to urea sufficiently low, the interstitial fluid will be concentrated as the ATL fluid is being diluted. The increased interstitial osmolality will, in turn, cause water to move out of the CDs, thereby concentrating the urine. We consider this a “solute-separation, solute-mixing” mechanism: “solute-separation” referring to active NaCl reabsorption without urea in TALs in the outer medulla, and “solute-mixing” referring to mixing of urea diffusing from CDs with NaCl diffusing from the ATLs in the IM (24) (Figure 1).
This appears to be an elegant model and is described in most renal texts, but its function, as noted above, depends critically on the transepithelial permeabilities of the ATLs to NaCl and urea. Unfortunately, using available measurements of the urea permeabilities, no one has been able to develop a mathematical model that generates a significant axial osmotic gradient in the IM with this initial version of the “passive” mechanism (25).
This failure of the initial passive model has led to the development of many other hypothetical mechanisms and associated mathematical models for urine concentration in the IM. Wexler and colleagues explored, without significant success, hypothetical mathematical models representing increasing structural complexity, including three-dimensional considerations (26–29). Jen and Stephenson (30) demonstrated mathematically that it was theoretically possible for the accumulation of a newly produced or “external” osmolyte in the inner medullary interstitium or vasculature to function as a concentrating agent, and Thomas and his colleagues (31,32) suggested that lactate might serve such a function. However, such a mechanism is probably insufficient to account completely for the magnitude of the gradient found experimentally (31). Moreover, no experimental data support the production or addition of such an osmolyte in the IM. Schmidt-Nielsen (33) suggested that contractions of the pelvic wall could serve as a source of energy for the inner medullary concentrating process, and Knepper and his colleagues (34) postulated that hyaluronan could act as a transducer to convert the mechanical energy of the contractions into a concentrating effect. However, this conversion has not yet been shown to be thermodynamically feasible, and there are no experimental measurements of such a process in the IM.
We believe, whatever the specific mechanism by which the urine is concentrated in the IM, that it must take into account the three-dimensional interactions between the tubular and vascular elements within the IM. Although, as noted above, an earlier model failed to demonstrate the significance of the three-dimensional structure (28), this model was based on very limited knowledge of that structure. Therefore, during the past decade, we have worked to develop a detailed understanding of the three-dimensional relationships of the tubules and vessels in the IM of the rat kidney by analysis of digital reconstructions of these structures produced from 1-μm serial sections (35–42). For this purpose, we labeled the various tubules and vessels with antibodies to structure- and segment-specific proteins, usually transporters or channels. We also measured the transepithelial water and urea permeabilities of specific segments of isolated, perfused thin limbs of the loops of Henle (15,43). We used the rat kidney in our work because of the enormous amount of physiologic data, including data on the concentrating mechanism, available for this species. However, our preliminary work and studies by others (44,45) suggest that the three-dimensional relationships in the mouse renal medulla are similar to those in the rat. Our preliminary studies also indicate that rodent and human inner medullary architecture share fundamental similarities. Finally, we have developed several mathematical models to determine how these physiologic and structural features might relate to the concentrating mechanism (24,46–48). In this paper, we briefly review some of the main findings and put them into context with regard to the concentrating mechanism.
Three-Dimensional Reconstructions of Thin Limbs of the Loops of Henle in the Rat Inner Medulla
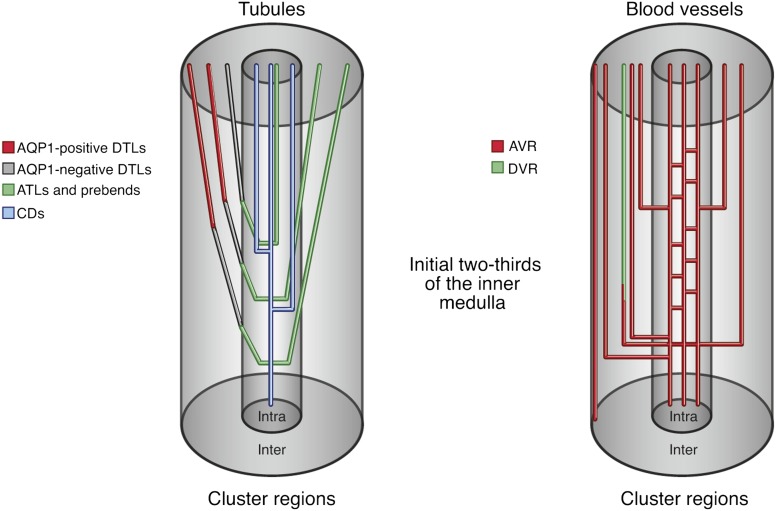
Our reconstructions of the thin limbs of the loops of Henle extending into the IM (37) revealed unexpected structural and functional features. First, although previous studies had assumed that the DTLs in the IM were highly permeable to water, we found that the DTLs of those loops that have their bends within the first millimeter of the IM (about 40% of the inner medullary loops) fail to express the constitutive water channel, aquaporin-1 (AQP1), throughout their length, and that the DTLs of the longer loops (the remaining 60% of the loops) express AQP1 only for the first 40% of their length; they fail to express it over the remaining 60% (Figures 2 and 3). Studies with isolated, perfused tubules show, as expected, that segments expressing AQP1 have very high osmotic water permeability, whereas segments failing to express AQP1 have little or no osmotic water permeability (15). Therefore, a substantial portion of each DTL in the IM is relatively impermeable to water.
Figure 2.
Diagram of nephron and blood vessel architecture in the initial two thirds of the rat inner medulla. Collecting ducts (CDs) coalesce as they descend the corticopapillary axis, forming the intracluster region. DTLs and descending vasa recta (DVR) reside within the intercluster region. ATLs and ascending vasa recta (AVR) lie within the intercluster and intracluster regions. Modified from reference 22 with permission. AQP1, aquaporin-1.
Figure 3.
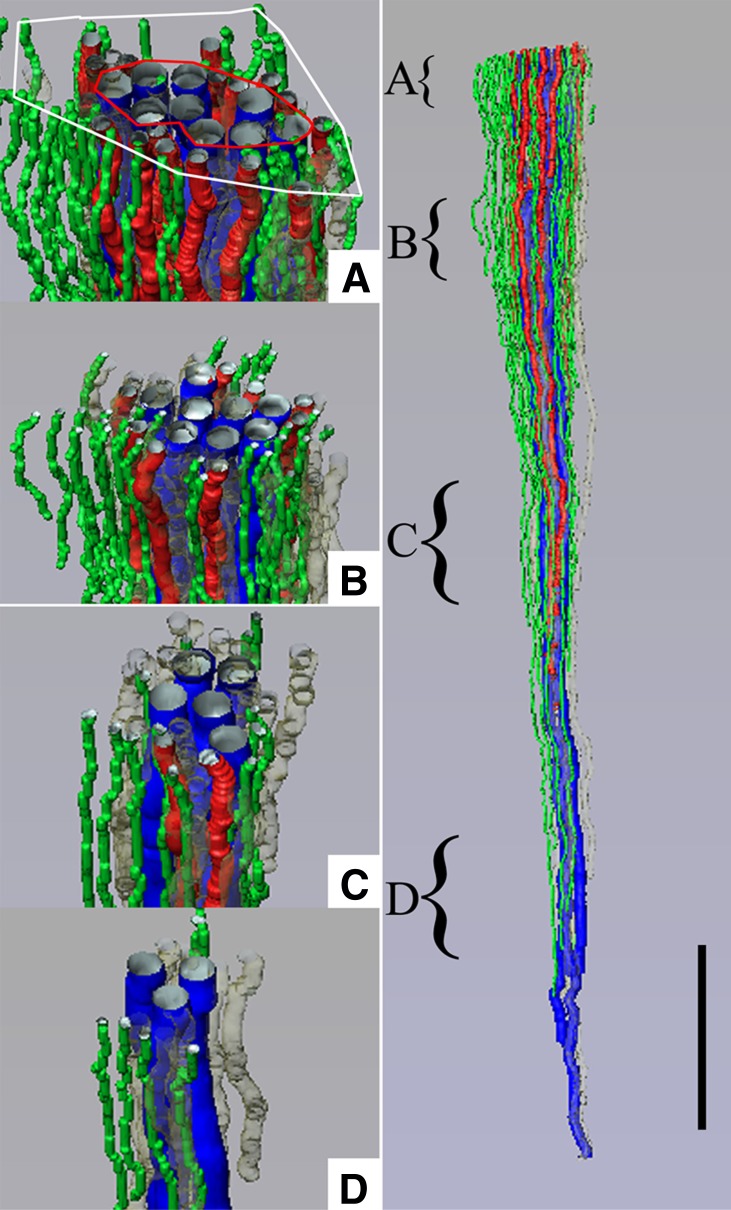
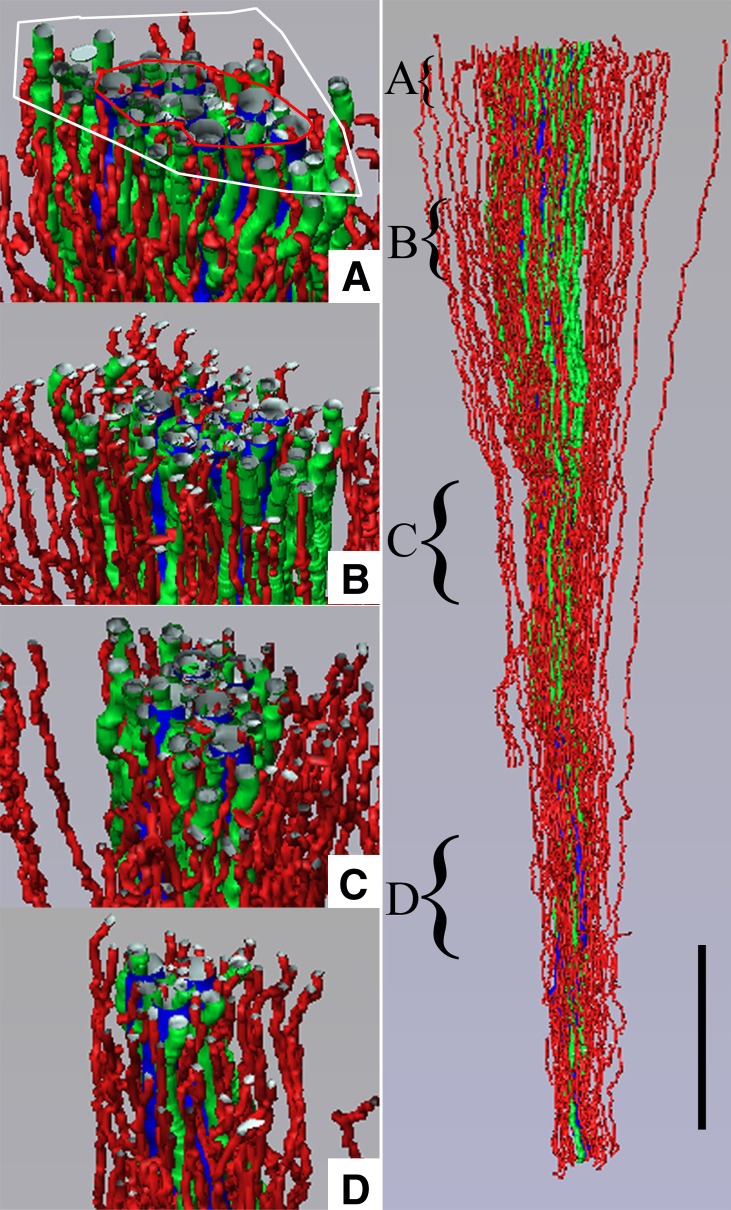
Three-dimensional reconstruction showing spatial relationships of DVR (green tubules) and DTLs (red tubules) to CDs (blue tubules) for a single CD cluster. DTL segments that do not express AQP1 are shown in gray. DTLs and DVR lie at the periphery of the central core of CDs, within the intercluster region, and A–D show that this relationship continues along the entire axial length of the CD cluster. Axial positions of A–D are indicated by the curly brackets in the right panel. Tubules are oriented in a corticopapillary direction, with the upper edge of the image near the outer medullary–inner medullary border. The interstitial area within the red boundary line is the “intracluster” region, and the interstitial area between the red and white boundary lines is the “intercluster” region. Scale bar, 500 μm. Reproduced from reference 39 with permission.
Second, the chloride channel ClC-K1 (the rat homolog of human ClC-Ka) begins to be expressed abruptly in the AQP1-negative portion of each DTL about 150–200 μm above the bend, thereby defining a prebend segment, and continues to be expressed throughout the ATL (Figure 2) (37). The expression of ClC-K1 throughout each ATL apparently reflects the extremely high chloride permeability found in this segment (16). We assume that the prebend segment has a similar high chloride permeability. AQP1 is not expressed in the prebend segments or ATLs, reflecting the complete lack of osmotic water permeability in the ATLs (15,16,42) and, we assume, in the prebend segments as well. Both the DTLs and the ATLs have now been shown to have very high permeabilities to urea, but there is no evidence of known urea transporters to account for these (43,49).
Three-Dimensional Lateral and Vertical Relationships of Tubules and Vessels in the Initial Two Thirds of the Rat Inner Medulla
The tubules and vessels within the initial two thirds of the IM are arranged in a highly organized three-dimensional pattern, which we believe is related to their function in the urine-concentrating process. Coalescing clusters of CDs form the organizing motif for the arrangement of both loops of Henle and vasa recta as they descend through the IM (Figure 3, right panel). DTLs and descending vasa recta (DVR) are arranged outside each CD cluster in the intercluster region between the clusters (Figures 2, 3A, and 4). They tend to lie about as far as possible from any CD in any cluster. This arrangement continues as tubules and blood vessels descend along the corticopapillary axis (Figure 3, B–D) (35,37,39,41,42). In contrast, the ATLs and ascending vasa recta (AVR) are arranged both inside (intracluster region) and outside (intercluster region) each CD cluster (Figures 2, 4, and 5A) (39,40). In addition, the prebend region of each DTL (which is the same as the ATL in terms of water and solute permeability) is always in the intracluster region (Figure 2) (36,50). About 50% of the AVR lie outside the CD clusters, and about 50% lie inside the clusters (41,42). About half of those AVR outside the clusters lie next to DVR in an arrangement that appears to facilitate countercurrent exchange, thereby helping to maintain any osmotic gradient established. The other half of the AVR outside the clusters appear to be arranged to move water and solute toward the outer medulla.
Figure 4.
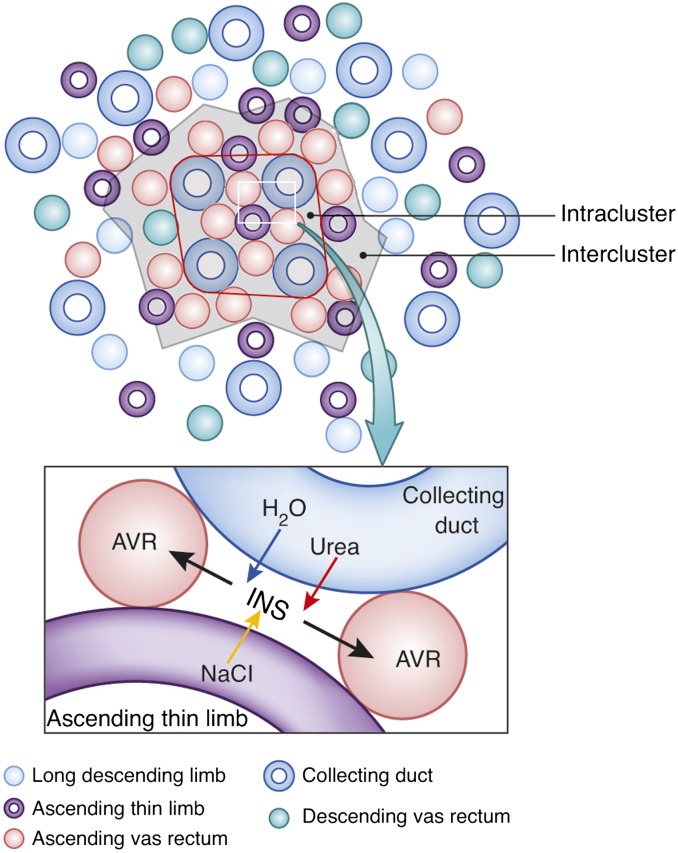
Diagram of tubular organization in the rat renal medulla. Upper: cross-section through the outer two thirds of the inner medulla, where tubules and vessels are organized around a collecting duct cluster. Lower: schematic configuration of a CD, AVR, an ATL, and an interstitial nodal space (INS). This illustrates the targeted delivery of NaCl from the ATL to the interstitial nodal space, where it can mix with urea and water from the CD. Modified from reference 48 with permission.
Figure 5.
Three-dimensional reconstruction showing spatial relationships of AVR (red tubules) and ATLs (green tubules) to CDs (blue tubules) for the same CD cluster shown in Figure 3. ATLs and AVR reside within both the intercluster and intracluster regions, and A–D show that this relationship continues along the entire axial length of the CD cluster. Axial positions of A–D are indicated by the curly brackets in the right panel. Tubules are oriented in a corticopapillary direction, with the upper edge of the image near the base of the inner medulla. The interstitial area within the red boundary line is the “intracluster” region and the interstitial area between the red and white boundary lines is the “intercluster” region. Scale bar, 500 μm. Reproduced from reference 39 with permission.
The 50% of the AVR that lie in the intracluster region are arranged in a way that suggests that they have a function quite different from that of the 50% that lie in the intercluster region (39,41,42). Almost all of these intracluster AVR closely abut a CD and lie parallel to it for a considerable distance along the corticopapillary axis (39). About four AVR on average are arranged symmetrically around each CD (Figures 4 and 6) so that about 55% of the surface of each CD is closely apposed to AVR. These AVR, in contrast to those in the intercluster region, have many small capillary branches connecting them to each other and sometimes to AVR in the intercluster region that lie closest to the intracluster region (Figure 2). This arrangement facilitates moving absorbate from the CDs in the cortical direction.
Figure 6.
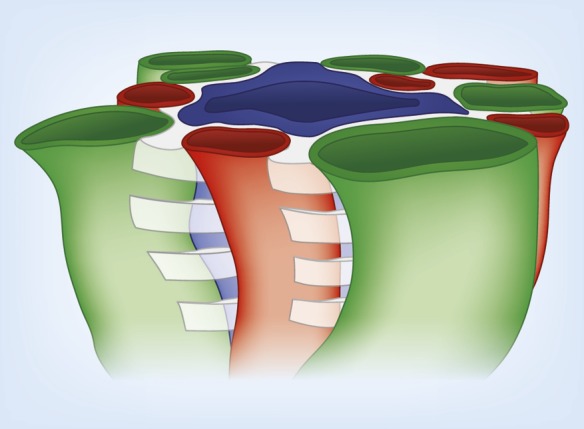
Three-dimensional model illustrating stacks of interstitial nodal spaces (white) surrounding a single CD. Interstitial nodal spaces are separated by interstitial cells (not shown) with axial thickness of 1–10 μm. Green, ATL; red, AVR; blue, CD.
In the IM overall, there are about four times as many AVR as DVR (42). The excess AVR facilitate a vasa recta outflow from the IM that exceeds the inflow. This excess outflow returns the water absorbed from the IMCDs during the concentrating process to the cortex (42).
In the intracluster region, the arrangement of AVR, ATLs, and CDs, when viewed in a cross-section, form microdomains of interstitial space, or “interstitial nodal spaces” (Figures 4 and 6) (39). As shown, each of these spaces is bordered on one side by a CD (in which axial flow is toward the papilla tip), on the opposite side by one or more ATLs (in which axial flow is toward the outer medulla [OM]), and on the other two sides by AVR (in which flow is toward the OM). These spaces also appear to be bordered above and below by interstitial cells (51–53), making them discrete units about 1–10 μm thick. Therefore, these interstitial nodal spaces are probably arranged in stacks along the corticopapillary axis (Figure 6) (39). These confined spaces appear well configured for localized mixing of urea from the CDs with NaCl from the ATLs, and for the movement of these mixed and concentrated solutes to higher regions via the AVR (54) (Figure 4) (see below).
Three-Dimensional Relationships of Tubules and Vessels in the Terminal Third of the Rat Inner Medulla
The three-dimensional organization of the tubules and vessels differs substantially in the terminal third of the IM from that in the initial two thirds. In the terminal third of the IM, the organization around the CD clusters markedly diminishes as the CDs continue to coalesce. All the blood vessels show the same structural characteristics. Therefore, except for the vessels that closely abut CDs, which can clearly be identified as AVR, vessels with ascending flow cannot be differentiated from those with descending flow without direct measurements (38). Moreover, there is no clear arrangement of parallel vessels that would suggest countercurrent exchange (38). As CDs coalesce and increase in diameter, the number of AVR abutting them increases so that about 55% of the surface area of each CD continues to be closely apposed to AVR (38). Interstitial nodal spaces still appear to exist, but they decrease in number and increase in size as fewer and fewer loops reach into this region (38).
At the very tip of the papilla, CD clusters have disappeared as just a few remaining large CDs dominate the region and coalesce to form the terminal ducts of Bellini (38). The most striking feature in this region, however, is the arrangement of the bends of the loops of Henle. Throughout most of the length of the IM, descending loop segments form a U-shaped configuration, or hairpin bend, immediately before ascending toward the OM, but at the tip of the papilla only about half the loops have this hairpin bend (38). The remaining loops extend transversely, perpendicular to the corticopapillary axis, before ascending toward the OM. In some loops, this transverse extension literally wraps around the large CDs just before they merge with the papillary surface to form the terminal ducts of Bellini (38). These wide bends have 5- to 10-fold greater transverse length than the hairpin bends and markedly increase the total loop-bend surface area relative to the CD surface area. This architecture could play a significant role in NaCl delivery and the development of the high osmolality at the papilla tip (55).
Mathematical Model Relating Structural and Permeability Findings to the Urine-Concentrating Process in the Inner Medulla
Over the past 10 years, we have developed a series of mathematical models of the urine-concentrating mechanism in the IM, which have incorporated the new information on the three-dimensional relationships of the vessels and tubules, the sites of transporters and channels, and the tubule permeabilities as this information became available (24,48,56–58). Here, we consider only the most recent version of these models (46).
This model has the following features: (1) the loop bends are distributed densely along the corticopapillary axis to approximate loops turning back at all levels along this axis. (2) Interconnected regions represent the lateral and vertical relationships of tubules and vessels described above. (3) The high osmotic water permeability along the upper 40% of each DTL, the lack of osmotic water permeability along the lower 60% of each DTL and along the entire length of each ATL, the high NaCl permeability along each prebend and the complete length of each ATL, and the high urea permeability along the complete length of each DTL and ATL are represented (Figure 7). (4) The wide-bend loops at the tip of the papilla are also represented.
Figure 7.
Modification of Figure 1 to illustrate the unique permeabilities and solute fluxes of current solute-separation, solute-mixing passive model for concentrating urine. Thick tubule border indicates AQP1-null, water-impermeable segment of DTL as well as water-impermeable ATL and TAL. All arrows and symbols are as defined in Figure 1. The AQP1-null segment of the DTL is essentially impermeable to inorganic solutes and water. In this model, both the ATLs and the DTLs (including the AQP1-null segment) are highly permeable to urea. In contrast to the original passive model, passive NaCl reabsorption without water begins with the prebend segment and is most significant around the loop bend. Also, in contrast to previous models, urea moves passively into the entire DTL and early ATL, but as this urea-rich fluid further ascends in the ATL, it reaches regions of lower interstitial urea concentration and diffuses out of the ATL again. Thus, the loops act as countercurrent exchangers for urea.
In the operation of the model, urea and water diffuse out of the CDs, as in the original Kokko and Rector (22) and Stephenson (23) model (Figure 7). Also, as in that model, this reduces the NaCl concentration in the interstitium, establishing a gradient for NaCl diffusion out of the loops of Henle (Figure 7). However, in contrast to the original model, this diffusion of NaCl occurs primarily out of the prebend regions and to a similar distance up the ATLs (Figure 7). The delivery of NaCl into the interstitium at the tip of the papilla occurs from the wide-bend loops over a very short axial distance. The diffusion of urea and water from the CDs and of NaCl from the prebends and ATLs occurs in the intracluster region, with the mixing of solutes occurring in the interstitial nodal spaces (Figure 4). This mixed and concentrated absorbate is then moved to less concentrated spaces at higher levels via the AVR bordering these spaces (Figure 4).
In contrast to the original model, there is no movement of NaCl or water into the lower 60% of each DTL (Figure 7). However, the high urea permeability of both thin limbs results in significant diffusion of urea into the DTLs and the lower part of the ATLs and out of the upper part of the ATLs so that the loops act as countercurrent exchangers (Figure 7).
This model predicts a urine osmolality (∼1200 mOsmol/kg H2O), Na+ concentration, urea concentration, and flow rate in reasonable agreement with those measured in moderately antidiuretic rats (59) (Table 1). The model also predicts an osmolality at the tip of the longest loop in the IM similar to that in the urine and essentially equal to that measured experimentally (Table 1). In these respects, the model predictions are substantially better than the original passive model. However, this model, as long as it incorporates the high urea permeabilities measured in the thin limbs, does not predict the known increasing axial Na+ gradient along the loops. This leads to a predicted urea concentration higher than the Na+ concentration at the tip of the longest loop, the opposite of the relationship measured experimentally (Table 1). Moreover, neither this model nor any other has yet been capable of generating a urine osmolality similar to that in a maximally antidiuretic rat (∼2700 mOsmol/kg H2O).
Table 1.
Comparison of model values and rat measurements
Summary
The urine-concentrating process in the mammalian kidney depends on the generation of an interstitial osmotic gradient from the corticomedullary border to the papilla tip, thereby providing the driving force for water absorption from the CDs during antidiuresis (Figure 1). In the OM, this osmotic gradient is generated by countercurrent multiplication within the loops of Henle, driven by the active transepithelial reabsorption of NaCl in the TALs (Figure 1). However, in the IM, the region in which the steepest osmotic gradient is generated, there are only ATLs, and there is no active transepithelial reabsorption of NaCl or any other solute by these structures (Figure 1). Thus, the mechanism by which the IM osmotic gradient is generated is a perplexing problem that has challenged renal physiologists for over half a century.
Early studies on inner medullary thin limb function in rats indicated that:
DTLs are permeable to water.
ATLs are impermeable to water, but highly permeable to NaCl.
DTLs have low- and ATLs have moderate urea permeabilities.
Recent studies on inner medullary thin limb function, structure, and three-dimensional organization have modified these findings or added new ones as follows:
Upper 40% of each DTL expresses AQP1 and is highly permeable to water.
Lower 60% of each DTL lacks AQP1 and is impermeable to water.
Chloride channel ClC-K1 begins at DTL prebend segment and continues throughout ATL, accounting for high chloride permeability.
Both DTLs and ATLs are highly permeable to urea.
CD clusters form organizing motif for three-dimensional arrangement of thin limbs and vasa recta, with DTLs and DVR being outside the clusters and ATLs and AVR being both inside and outside the clusters.
Arrangement of AVR, ATLs, and CDs within the clusters form interstitial nodal spaces bordered above and below by lateral interstitial cells, thereby creating microdomains for solute and water mixing.
Loops turning at tip of papilla have wide lateral bends.
In an initial passive model for developing the IM osmotic gradient and concentrating the urine (22,23), urea, which has been concentrated in the cortical CDs and outer medullary CDs by NaCl and water reabsorption, diffuses out of the IMCDs and draws water from the DTLs and IMCDs, thereby reducing the NaCl concentration in the IM interstitium and establishing a gradient for NaCl diffusion out of the ATLs to establish the interstitial osmotic gradient (Figure 1). However, this model failed to concentrate the urine when analyzed mathematically. In our most recent model (46), urea and water still diffuse out of the IMCDs, thereby reducing the interstitial NaCl concentration and establishing a gradient for NaCl diffusion out of the loops of Henle (Figure 7). However, with the new information available, this diffusion of NaCl occurs primarily out of the DTL prebend regions and to a similar distance up the ATLs (Figure 7). It also occurs from wide-bend loops over a very short axial distance at the tip of the papilla. NaCl from the loops and urea and water from the CDs are mixed and concentrated in the interstitial microdomains surrounding the CDs. Because the loops have very high urea permeabilities, they act as countercurrent exchangers for urea. When analyzed mathematically, this model now produces a urine concentration and tubule fluid concentration at the tip of the longest loops in good agreement with those measured in moderately antidiuretic rats. However, the model fails to produce a maximally concentrated urine or the appropriate interstitial axial Na+ gradient. Thus, it does not yet reflect the true physiologic operation of the urine concentrating mechanism in the IM.
Disclosures
None.
Acknowledgments
Research in the authors’ laboratories has been supported by the National Science Foundation, grant IOS-0952885 (T.L.P.), and by the National Institutes of Health National Institute of Diabetes and Digestive and Kidney Diseases, grants DK08333 (T.L.P.), DK-89066 (A.T.L.) and DK-42091 (H.E.L.).
Footnotes
Published online ahead of print. Publication date available at www.cjasn.org.
References
- 1.Hai MA, Thomas S: The time-course of changes in renal tissue composition during lysine vasopressin infusion in the rat. Pflugers Arch 310: 297–317, 1969 [DOI] [PubMed] [Google Scholar]
- 2.Knepper MA: Measurement of osmolality in kidney slices using vapor pressure osmometry. Kidney Int 21: 653–655, 1982 [DOI] [PubMed] [Google Scholar]
- 3.Wirz H, Hargitay B, Kuhn W: Lokalisation des Konzentrierungsprozesses in der niere durch direkte Kryoskopie. Helv Physiol Acta 9: 196–207, 1951 [PubMed] [Google Scholar]
- 4.Atherton JC, Green R, Thomas S: Influence of lysine-vasopressin dosage on the time course of changes in renal tissue and urinary composition in the conscious rat. J Physiol 213: 291–309, 1971 [DOI] [PMC free article] [PubMed] [Google Scholar]
- 5.Beck F, Dörge A, Rick R, Thurau K: Osmoregulation of renal papillary cells. Pflugers Arch 405[Suppl 1]: S28–S32, 1985 [DOI] [PubMed] [Google Scholar]
- 6.Gottschalk CW, Mylle M: Micropuncture study of the mammalian urinary concentrating mechanism: Evidence for the countercurrent hypothesis. Am J Physiol 196: 927–936, 1959 [DOI] [PubMed] [Google Scholar]
- 7.Hargitay B, Kuhn W. Das Multiplikationsprinzip als Grundlage der Harnkonzentrierung in der Niere. Z Electrochem u ang Physical Chem 55: 539-558, 1951 [Google Scholar]
- 8.Kuhn W, Ramel A: Activer Salztransport als möglicher (und wahrscheinlicher) Einzeleffekt bei der Harnkonzentrierung in der Niere. Helv Chim Acta 42: 628–660, 1959 [Google Scholar]
- 9.Kuhn W, Ryffel K: Herstellung konzentrierter Losüngen aus verdünten durch blosse Membranwirkung: ein Modellversuch zur Funktion der Niere. Hoppe Seylers Z Physiol Chem 276: 145–178, 1942 [Google Scholar]
- 10.Layton AT, Layton HE: Countercurrent multiplication may not explain the axial osmolality gradient in the outer medulla of the rat kidney. Am J Physiol Renal Physiol 301: F1047–F1056, 2011 [DOI] [PMC free article] [PubMed] [Google Scholar]
- 11.Burg MB, Green N: Function of the thick ascending limb of Henle’s loop. Am J Physiol 224: 659–668, 1973 [DOI] [PubMed] [Google Scholar]
- 12.Rocha AS, Kokko JP: Sodium chloride and water transport in the medullary thick ascending limb of Henle. Evidence for active chloride transport. J Clin Invest 52: 612–623, 1973 [DOI] [PMC free article] [PubMed] [Google Scholar]
- 13.Layton AT, Layton HE: A region-based mathematical model of the urine concentrating mechanism in the rat outer medulla. I. Formulation and base-case results. Am J Physiol Renal Physiol 289: F1346–F1366, 2005 [DOI] [PubMed] [Google Scholar]
- 14.Chou C-L, Knepper MA: In vitro perfusion of chinchilla thin limb segments: Segmentation and osmotic water permeability. Am J Physiol Renal. Fluid Electrolyte Physiol 263: F417–F426, 1992 [DOI] [PubMed] [Google Scholar]
- 15.Dantzler WH, Evans KK, Pannabecker TL. Osmotic water permeabilities in specific segments of rat inner medullary thin limbs of Henle's loops. FASEB J 23: 970–973, 2009 [Google Scholar]
- 16.Imai M, Kokko JP: Sodium chloride, urea, and water transport in the thin ascending limb of Henle. Generation of osmotic gradients by passive diffusion of solutes. J Clin Invest 53: 393–402, 1974 [DOI] [PMC free article] [PubMed] [Google Scholar]
- 17.Yool AJ, Brokl OH, Pannabecker TL, Dantzler WH, Stamer WD: Tetraethylammonium block of water flux in Aquaporin-1 channels expressed in kidney thin limbs of Henle’s loop and a kidney-derived cell line. BMC Physiol 2: 4, 2002 [DOI] [PMC free article] [PubMed] [Google Scholar]
- 18.Imai M, Kusano E: Effects of arginine vasopressin on the thin ascending limb of Henle’s loop of hamsters. Am J Physiol 243: F167–F172, 1982 [DOI] [PubMed] [Google Scholar]
- 19.Marsh DJ, Azen SP: Mechanism of NaCl reabsorption by hamster thin ascending limbs of Henle’s loop. Am J Physiol 228: 71–79, 1975 [DOI] [PubMed] [Google Scholar]
- 20.Marsh DJ, Solomon S: Analysis of electrolyte movement in thin Henle's loops of hamster papilla. Am J Physiol 208: 1119–1128, 1965 [DOI] [PubMed] [Google Scholar]
- 21.Pannabecker TL: Structure and function of the thin limbs of the loops of Henle. In: Comprehensive Physiology, edited by Terjung RL, Bethesda: John Wiley and Sons, 2012, pp 2063–2086 [DOI] [PubMed] [Google Scholar]
- 22.Kokko JP, Rector FC, Jr: Countercurrent multiplication system without active transport in inner medulla. Kidney Int 2: 214–223, 1972 [DOI] [PubMed] [Google Scholar]
- 23.Stephenson JL: Concentration of urine in a central core model of the renal counterflow system. Kidney Int 2: 85–94, 1972 [DOI] [PubMed] [Google Scholar]
- 24.Layton AT, Pannabecker TL, Dantzler WH, Layton HE: Two modes for concentrating urine in rat inner medulla. Am J Physiol Renal Physiol 287: F816–F839, 2004 [DOI] [PubMed] [Google Scholar]
- 25.Sands JM, Layton HE: The urine concentrating mechanism and urea transporters. In: The Kidney: Physiology and Pathophysiology, edited by Alpern RJ, Hebert SC, Philadelphia: Elsevier, 2007, pp 1143–1177 [Google Scholar]
- 26.Wang X, Thomas SR, Wexler AS: Outer medullary anatomy and the urine concentrating mechanism. Am J Physiol 274: F413–F424, 1998 [DOI] [PubMed] [Google Scholar]
- 27.Wang XQ, Wexler AS: The effects of collecting duct active NaCl reabsorption and inner medulla anatomy on renal concentrating mechanism. Am J Physiol Renal 270: F900–F911, 1996 [DOI] [PubMed] [Google Scholar]
- 28.Wexler AS, Kalaba RE, Marsh DJ: Three-dimensional anatomy and renal concentrating mechanism. I. Modeling results. Am J Physiol Renal 260: F368–F383, 1991 [DOI] [PubMed] [Google Scholar]
- 29.Wexler AS, Kalaba RE, Marsh DJ: Three-dimensional anatomy and renal concentrating mechanism. II. Sensitivity results. Am J Physiol Renal 260: F384–F394, 1991 [DOI] [PubMed] [Google Scholar]
- 30.Jen JF, Stephenson JL: Externally driven countercurrent multiplication in a mathematical model of the urinary concentrating mechanism of the renal inner medulla. Bull Math Biol 56: 491–514, 1994 [DOI] [PubMed] [Google Scholar]
- 31.Hervy S, Thomas SR: Inner medullary lactate production and urine-concentrating mechanism: A flat medullary model. Am J Physiol Renal Physiol 284: F65–F81, 2003 [DOI] [PubMed] [Google Scholar]
- 32.Thomas SR: Inner medullary lactate production and accumulation: A vasa recta model. Am J Physiol Renal Physiol 279: F468–F481, 2000 [DOI] [PubMed] [Google Scholar]
- 33.Schmidt-Nielsen B: August Krogh Lecture. The renal concentrating mechanism in insects and mammals: A new hypothesis involving hydrostatic pressures. Am J Physiol 268: R1087–R1100, 1995 [DOI] [PubMed] [Google Scholar]
- 34.Knepper MA, Saidel GM, Hascall VC, Dwyer T: Concentration of solutes in the renal inner medulla: Interstitial hyaluronan as a mechano-osmotic transducer. Am J Physiol Renal Physiol 284: F433–F446, 2003 [DOI] [PubMed] [Google Scholar]
- 35.Kim J, Pannabecker TL: Two-compartment model of inner medullary vasculature supports dual modes of vasopressin-regulated inner medullary blood flow. Am J Physiol Renal Physiol 299: F273–F279, 2010 [DOI] [PMC free article] [PubMed] [Google Scholar]
- 36.Pannabecker TL: Loop of Henle interaction with interstitial nodal spaces in the renal inner medulla. Am J Physiol Renal Physiol 295: F1744–F1751, 2008 [DOI] [PMC free article] [PubMed] [Google Scholar]
- 37.Pannabecker TL, Abbott DE, Dantzler WH: Three-dimensional functional reconstruction of inner medullary thin limbs of Henle’s loop. Am J Physiol Renal Physiol 286: F38–F45, 2004 [DOI] [PubMed] [Google Scholar]
- 38.Pannabecker TL, Dantzler WH: Three-dimensional architecture of collecting ducts, loops of Henle, and blood vessels in the renal papilla. Am J Physiol Renal Physiol 293: F696–F704, 2007 [DOI] [PubMed] [Google Scholar]
- 39.Pannabecker TL, Dantzler WH: Three-dimensional architecture of inner medullary vasa recta. Am J Physiol Renal Physiol 290: F1355–F1366, 2006 [DOI] [PubMed] [Google Scholar]
- 40.Pannabecker TL, Dantzler WH: Three-dimensional lateral and vertical relationships of inner medullary loops of Henle and collecting ducts. Am J Physiol Renal Physiol 287: F767–F774, 2004 [DOI] [PubMed] [Google Scholar]
- 41.Pannabecker TL, Henderson CS, Dantzler WH: Quantitative analysis of functional reconstructions reveals lateral and axial zonation in the renal inner medulla. Am J Physiol Renal Physiol 294: F1306–F1314, 2008 [DOI] [PubMed] [Google Scholar]
- 42.Yuan J, Pannabecker TL: Architecture of inner medullary descending and ascending vasa recta: Pathways for countercurrent exchange. Am J Physiol Renal Physiol 299: F265–F272, 2010 [DOI] [PMC free article] [PubMed] [Google Scholar]
- 43.Evans K, Pannabecker TL, Dantzler WH. Urea permeabilities in defined segments of rat renal inner medullary thin limbs of Henle’s loops. FASEB J In press [DOI] [PMC free article] [PubMed] [Google Scholar]
- 44.Zhai X-Y, Thomsen JS, Birn H, Kristoffersen IB, Andreasen A, Christensen EI: Three-dimensional reconstruction of the mouse nephron. J Am Soc Nephrol 17: 77–88, 2006 [DOI] [PubMed] [Google Scholar]
- 45.Zhai XY, Birn H, Jensen KB, Thomsen JS, Andreasen A, Christensen EI: Digital three-dimensional reconstruction and ultrastructure of the mouse proximal tubule. J Am Soc Nephrol 14: 611–619, 2003 [DOI] [PubMed] [Google Scholar]
- 46.Layton AT, Dantzler WH, Pannabecker TL: Urine concentrating mechanism: impact of vascular and tubular architecture and a proposed descending limb urea-Na+ cotransporter. Am J Physiol Renal Physiol 302: F591–F605, 2012 [DOI] [PMC free article] [PubMed] [Google Scholar]
- 47.Layton AT, Gilbert RL, Pannabecker TL: Isolated interstitial nodal spaces may facilitate preferential solute and fluid mixing in the rat renal inner medulla. Am J Physiol Renal Physiol 302: F830–F839, 2012 [DOI] [PMC free article] [PubMed] [Google Scholar]
- 48.Layton AT, Pannabecker TL, Dantzler WH, Layton HE: Functional implications of the three-dimensional architecture of the rat renal inner medulla. Am J Physiol Renal Physiol 298: F973–F987, 2010 [DOI] [PMC free article] [PubMed] [Google Scholar]
- 49.Chou C-L, Knepper MA: In vitro perfusion of chinchilla thin limb segments: Urea and NaCl permeabilities. Am J Physiol 264: F337–F343, 1993 [DOI] [PubMed] [Google Scholar]
- 50.Westrick KY, Serack BJ, Dantzler WH, Pannabecker TL: Axial compartmentation of descending and ascending thin limbs of Henle’s loops. Am J Physiol Renal Physiol 304: F308–F316, 2013 [DOI] [PMC free article] [PubMed] [Google Scholar]
- 51.Kneen MM, Harkin DG, Walker LL, Alcorn D, Harris PJ: Imaging of renal medullary interstitial cells in situ by confocal fluorescence microscopy. Anat Embryol (Berl) 200: 117–121, 1999 [DOI] [PubMed] [Google Scholar]
- 52.Lemley KV, Kriz W: Anatomy of the renal interstitium. Kidney Int 39: 370–381, 1991 [DOI] [PubMed] [Google Scholar]
- 53.Takahashi-Iwanaga H: The three-dimensional cytoarchitecture of the interstitial tissue in the rat kidney. Cell Tissue Res 264: 269–281, 1991 [DOI] [PubMed] [Google Scholar]
- 54.Pannabecker TL, Dantzler WH, Layton HE, Layton AT: Role of three-dimensional architecture in the urine concentrating mechanism of the rat renal inner medulla. Am J Physiol Renal Physiol 295: F1271–F1285, 2008 [DOI] [PMC free article] [PubMed] [Google Scholar]
- 55.Layton HE, Davies JM: Distributed solute and water reabsorption in a central core model of the renal medulla. Math Biosci 116: 169–196, 1993 [DOI] [PubMed] [Google Scholar]
- 56.Layton AT: A mathematical model of the urine concentrating mechanism in the rat renal medulla. I. Formulation and base-case results. Am J Physiol Renal Physiol 300: F356–F371, 2011 [DOI] [PMC free article] [PubMed] [Google Scholar]
- 57.Layton AT: A mathematical model of the urine concentrating mechanism in the rat renal medulla. II. Functional implications of three-dimensional architecture. Am J Physiol Renal Physiol 300: F372–F384, 2011 [DOI] [PMC free article] [PubMed] [Google Scholar]
- 58.Layton AT, Layton HE, Dantzler WH, Pannabecker TL: The mammalian urine concentrating mechanism: Hypotheses and uncertainties. Physiology (Bethesda) 24: 250–256, 2009 [DOI] [PubMed] [Google Scholar]
- 59.Pennell JP, Lacy FB, Jamison RL: An in vivo study of the concentrating process in the descending limb of Henle’s loop. Kidney Int 5: 337–347, 1974 [DOI] [PubMed] [Google Scholar]


