Abstract
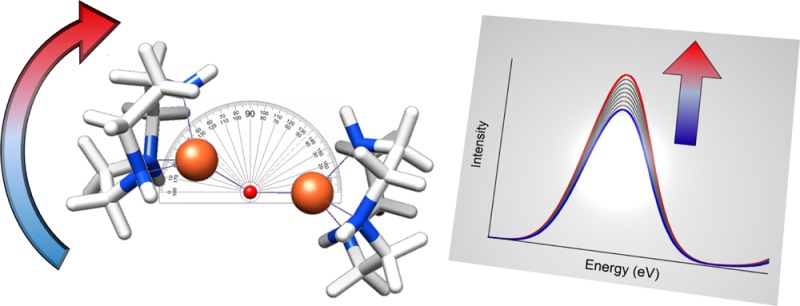
Transition-metal Kβ X-ray emission spectroscopy (XES) is a developing technique that probes the occupied molecular orbitals of a metal complex. As an element-specific probe of metal centers, Kβ XES is finding increasing applications in catalytic and, in particular, bioinorganic systems. For the continued development of XES as a probe of these complex systems, however, the full range of factors which contribute to XES spectral modulations must be explored. In this report, an investigation of a series of oxo-bridged iron dimers reveals that the intensity of valence-to-core features is sensitive to the Fe–O–Fe bond angle. The intensity of these features has a well-known dependence on metal–ligand bond distance, but a dependence upon bond angle has not previously been documented. Herein, we explore the angular dependence of valence-to-core XES features both experimentally and computationally. Taken together, these results show that, as the Fe–O–Fe angle decreases, the intensity of the Kβ″ feature increases and that this effect is modulated by increasing amounts of Fe np mixing into the O 2s orbital at smaller bond angles. The relevance of these findings to the identification of oxygenated intermediates in bioinorganic systems is highlighted, with special emphasis given to the case of soluble methane monooxygenase.
Short abstract
The sensitivity of valence-to-core X-ray emission spectroscopy (VtC XES) to the Fe−O−Fe bond angle is demonstrated for a series of Fe dimers. The origin of the angular dependence is rationalized using a simple Walsh-type picture for molecular orbital mixing, which has been further verified by DFT calcualtions. The relevance of these findings to the identification of oxygenated intermediates in bioinorganic systems is highlighted, with special emphasis given to the case of soluble methane monooxygenase.
Introduction
In recent years, valence-to-core X-ray emission spectroscopy (VtC XES) has emerged as a powerful probe of transition-metal active site structure in both biological and chemical catalysis.1−6 The sensitivity of this method to ligand identity has enabled VtC XES to reveal the presence of bridging oxo ligands in the Mn4Ca cluster of photosystem II7 and to establish the presence of a central carbide in the FeMoco cluster of nitrogenase.8
VtC XES utilizes a high-energy X-ray beam to create a 1s core hole on a transition-metal photoabsorber followed by detection of the fluorescence that occurs when valence electrons refill the core hole. The spectral features that result are the so-called Kβ″ and Kβ2,5 peaks (Figure 1), which generally correspond to ligand ns to metal 1s and ligand np to metal 1s transitions, respectively. Originating from orbitals that are dominantly ligand in character, these features gain intensity through small amounts of metal np mixing; hence, VtC XES serves as a probe of the filled, ligand-localized valence orbitals of a metal complex.9 Conversely, the related techniques of XAS and EXAFS probe the unoccupied orbitals and metrics of nearest neighbor atoms, respectively, providing information that is complementary to but less inherently ligand selective than that of XES (e.g., EXAFS cannot distinguish among C, N, and O scatterers). Recently, the ligand sensitivity of VtC spectra has been applied to assess such factors as the number of CO or N2 ligands bound to a metal center10−12 and to quantify the degree of ligand bond activation.13
Figure 1.
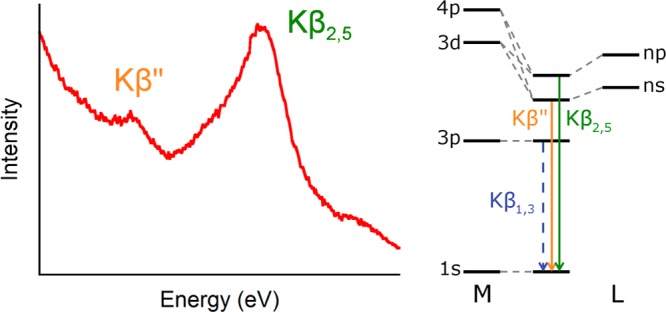
Schematic of a first-row transition metal Kβ VtC XES spectrum with the MO origin of the transitions at right.
Because the Kβ″ feature energetics derive principally from ligand ns orbitals, the Kβ″ feature allows ligands to be readily identified by differences in ionization potentials: shifts of more than 8 eV occur among C, N, O, and F.1 This ionization potential sensitivity also enables these spectra to detect more subtle structural changes such as protonation events,3,14−16 with clear (∼2 eV) shifts observed between oxo and hydroxo species.14 Sensitivity to protonation is especially important in bioinorganic chemistry, in large part because of the ubiquity of proton transfer and the corresponding challenges associated with identification of single protonation events.
In addition to the energy, the intensity of valence-to-core transitions also carries valuable information. For some time it has been known that the intensity of these features has an exponential dependence on metal–ligand bond length.1,3 As the metal–ligand distance decreases, the amount of metal np mixing into the valence molecular orbitals increases, thus imparting more dipole-allowed character to these transitions. This results in intense Kβ″ features—which are normally rather weak—for complexes with terminal oxo or nitrido ligands.1,7,15 The differences in valence-to-core intensities have also been used to distinguish between high- and low-spin complexes, with the latter having considerably shorter bond lengths and hence higher valence-to-core intensities.3,26
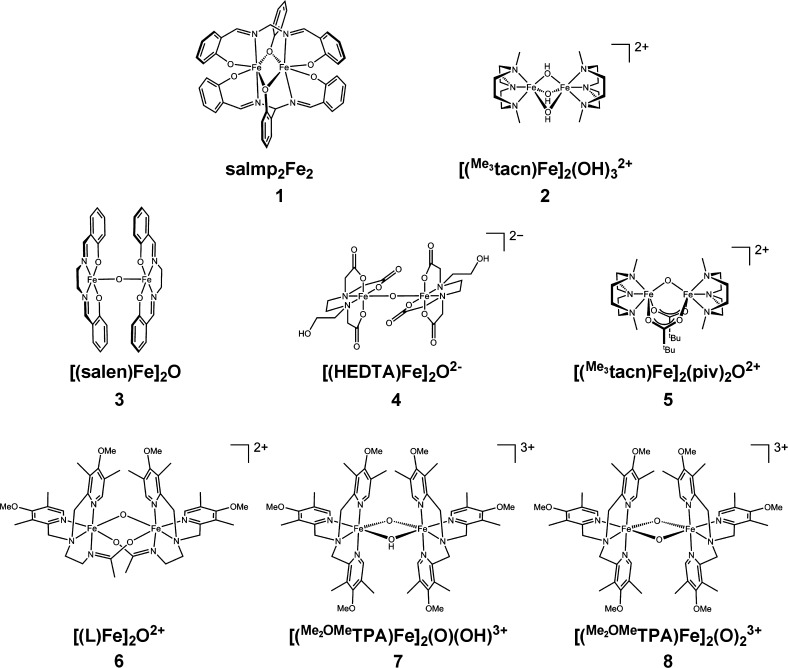
The sensitivity of valence-to-core XES to ligand identity (including protonation state and ionization potential) and metal–ligand bond length suggests it may be an ideal tool for the identification of dimeric oxygenated intermediates in biological systems. Previous studies have shown the utility of VtC XES for identifying single protonation events in a series of structurally related Mn dimers.14 Herein, we take a broader view and examine a series of eight dimeric oxo-bridged Fe complexes in which the nature of both the bridging and supporting ligand framework is varied (Figure 2). Our goal is to investigate the generality of Kβ″ spectral interpretations on the basis of simple ionization potential and bond length considerations. The present study verifies previous observations of the contribution of ligand ionization potential to the Kβ″ energies. We have found, however, that the observed Kβ″ intensities cannot be rationalized in terms of Fe–O bond lengths alone. In order to explain the observed spectral trends, we find that the Fe–O–Fe bond angle must also be considered. This can be understood empirically by invoking a simple “Walsh-type” diagram for the mixing of the Fe np orbitals with the ligand 2s orbital. This intuitive picture is supported by DFT calculations. These results demonstrate, to the best of our knowledge, the first observation of a bond angle dependence on the intensity of Kβ″ valence-to-core features. The implications of these results for the identification of oxygenated intermediates in binuclear iron enzymes are discussed.
Figure 2.
Structures of the compounds investigated in this study.
Experimental Section
Sample Preparation
Compounds 1–8, shown in Figure 2, were all synthesized according to literature procedures17,18,20−24 and were characterized by optical absorption spectroscopy. Samples for X-ray emission experiments were prepared by grinding the solid to a fine powder, packing into a 1 mm think aluminum cell, and sealing with 38 μm Kapton tape. For temperature-sensitive samples, the above procedure was modified to allow for preparation at reduced temperatures. In brief, sample packing occurred on an aluminum block that was partially immersed in a dry ice/acetone bath. After preparation, samples were immediately transferred to a liquid N2 filled Dewar for storage.
XES Data Collection and Processing
X-ray emission spectra were collected at the C-line of the Cornell High Energy Synchrotron Source with ring conditions of 5.3 GeV and 200 mA. The incident beam energy was set to 9 keV using upstream multilayers (with an ∼90 eV band-pass) and was calibrated by setting the first inflection point of a copper foil scan to 8979 eV, providing ∼3 × 10¹² photons/s in a 1 × 2 mm spot. A vertically focusing mirror upstream of the sample was used for harmonic rejection. The sample was positioned at 45° relative to the incident beam and was maintained below 77 K in an ARS helium displex cryostat. Emitted X-rays were energy selected using three to five spherically bent Ge(620) crystals arranged in Rowland geometry and were detected using a silicon drift detector with a 3 mm vertical slit. Data were normalized with respect to the incident flux using a nitrogen-filled ion chamber just upstream of the sample. A helium-filled flight path was used between the sample, crystal analyzers, and detector to minimize signal attenuation. Radiation-induced damage was assessed by collecting successive scans on a single sample spot, and multiple spots were used when needed. In the case of 8, two scans were used per spot. The second scans showed slight evidence of damage (Figure S1, Supporting Information); however, a combined average of both the first and second scans was not statistically different from the average of only first scans. Comparisons of these averages are provided in the Supporting Information.
Scans of the Kβ mainline and valence-to-core region were collected and averaged separately using PyMCA27 before being spliced together. The important quantity to compare between these spectra is the intensity of the Kβ″ feature above the background signal; hence, absolute intensities are not reported. Energy calibration was achieved using a reference spectrum of Fe2O3. Because these spectra were collected over several experimental runs, a larger than normal uncertainty in the calibrated energies exists (the typical experimental precision is 0.1–0.2 eV).13,28 The estimated error in reported energies is <0.5 eV. However, we note that for the present study the focus is on the intensities rather than the energies.
DFT Calculations
All DFT calculations were performed using the ORCA 2.9 or 3.0 quantum chemical suite.29 Geometry optimizations on the compounds studied were begun from crystal structure coordinates or, where these were not available, from manually modified structures of closely related complexes.17,19−23,25 Hypothetical model complexes featuring identical tacn supporting ligands and variable Fe–O–Fe bond angles were manually constructed from crystallographic (Me3tacn)FeIII fragments (WebCSD code ABAWUV);30 the bond lengths and angles of the Fe–O–Fe cores for these models were fixed during optimization, and all other atoms were allowed to optimize freely. Optimizations were performed using the BP86 functional31,32 and the def2-TZVP basis set33 with solvation modeled using the continuum solvation model (COSMO)34 with an infinite dielectric constant. An expanded CP(PPP) basis set35 was used on Fe with an increased integration accuracy (Grid7). When necessary, the broken symmetry formalism was used to account for antiferromagnetic coupling between Fe centers. XES spectra were calculated according to published procedures;3,28 the energies of the transitions were calculated by taking the differences between the Fe 1s and valence orbital energies, while intensities were determined by summing the electric dipole, magnetic dipole, and electric quadrupole contributions to the total oscillator strength. Spectra were calculated for each Fe independently and the resultant spectra averaged together. A scalar energy shift of 182.5 eV3 was applied to all ORCA-calculated spectra to align with experiment. The calculated spectra for 1–8 were broadened using a Matlab script that applies a modulated broadening across the VtC region (5 eV HWHM at low energies to 1.25 eV at higher energies); further explanation and details of this modulation can be found in the Supporting Information. The spectra for hypothetical compounds were broadened in ORCA using a constant Gaussian of 2.5 eV. Sample input files and optimized coordinates can be found in the Supporting Information.
Results and Analysis
Figure 3A presents the VtC XES data for compounds 1–8, revealing significant differences in both the Kβ″ and Kβ2,5 regions for this series of compounds. Given the wide variation in coordinating ligands and metal–ligand bond lengths, this observation is not surprising, especially since contributions from both ligand ns and np orbitals are present in the Kβ2,5 region. The Kβ″ peak is, however, a relatively pure transition that originates from the bridging O 2s orbital and thus provides a useful spectroscopic handle for comparing the Fe–O(X)–Fe cores of these compounds.
Figure 3.
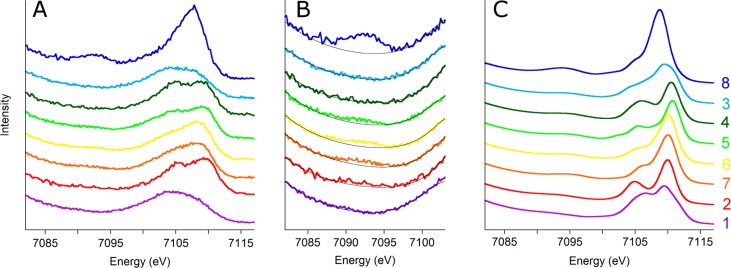
Experimental and calculated VtC spectra are shown. Panel A shows the experimental spectra and panel B is a zoomed-in view of the Kβ″ features (black background lines have been added to aid in peak identification), while panel C shows the corresponding calculated spectra. The spectra have been vertically offset for clarity and arranged according to increasing average Fe–Obridging bond length with shorter distances shown at the top. Compound 8 is shown at the top because it has two bridging oxos.
As discussed in the Introduction, the intensity of the Kβ″ feature is modulated by the amount of metal np mixing into the ligand-centered molecular orbitals and the energy of this feature is governed by the ligand ionization potential. These simple rules have several implications for the compounds studied. Most simply, the compounds featuring mono-μ-oxo bridges with short Fe–O bonds (3–7) would be expected to possess a Kβ″ peak at ∼7092 eV that is dominated by O 2s contributions. Contributions from the supporting ligands would be significantly less than that from the oxo ligand due to the relatively longer Fe–L bond lengths and because the N/O 2s orbitals are delocalized over the supporting ligands (Figure S3, Supporting Information).14 The intensity is also expected to depend on the number of short Fe–O bonds, with the bis-μ-oxo core of 8 giving rise to a Kβ″ feature of roughly double the intensity of the mono-μ-oxo species.
In contrast, for compounds possessing bridging OX ligands (X = Ph, H for 1 and 2, respectively) the Kβ″ feature would be expected to occur at lower energy (∼7090 eV) and to have significantly reduced intensity. Both of these changes stem from delocalization of the O 2s orbital due to intraligand covalent bonding. Bonding redirects the O 2s electron density away from the metal centers and thus reduces Fe np mixing, lowering Kβ″ intensity. Additionally, the resulting bonding orbital is stabilized relative to that of an isolated oxo ligand, lowering the energy of the transition. The combination of these effects is likely to completely obscure the Kβ″ feature beneath the tail of the Kβ mainline.
The Kβ″ regions of the experimental XES spectra, shown in Figure 3B, only partially fulfill these predictions. The compounds with bridging OX ligands do indeed have very low (2) to nonexistent Kβ″ features (1), while 8 with two bridging oxos has the greatest intensity. For the mono-μ-oxos (3–7), however, deviations from the simple expectations occur.
As discussed above, all compounds with a bridging oxo are expected to have Kβ″ peaks with intensities that increase as the bond length decreases (i.e., from bottom to top of Figure 3). Compounds 5–7 conform to this prediction, but surprisingly, 3 and 4 do not. Indeed, these latter compounds have no discernible Kβ″ feature at all, despite the fact that they possess some of the shortest Fe–Obridging bond lengths measured. Arranging the compounds according to average Fe–O or Fe–ligand bond length does not solve this problem, even when controlling for the number of O atom donors. Clearly other factors must be contributing to the observed spectra beyond bond length and number of donors.
For help with understanding these observations, we performed DFT calculations to simulate the experimental spectra (Figure 3C), since these calculations have been well-established as being able to effectively reproduce experiment.3,28 These calculations are in acceptable agreement with experiment with respect to the number of observed features and their relative energies. For some compounds, the intensity ratio of the features within Kβ2,5 deviates from experiment (e.g., compound 3), which is likely the result of effects not captured in these one-electron DFT calculations, such as charge transfer contributions. Furthermore, the calculations are known to overestimate the intensity of the Kβ″ feature relative to that of Kβ2,5,28 and this remains true here. For example, in compound 1, no Kβ″ feature is seen experimentally (in reality it is likely present but is too low in intensity to be seen above the tail of the Kβ mainline), though a small calculated feature is present. Given this limitation—coupled to the very different coordination spheres of these compounds—little additional information may be extracted from these calculated spectra.
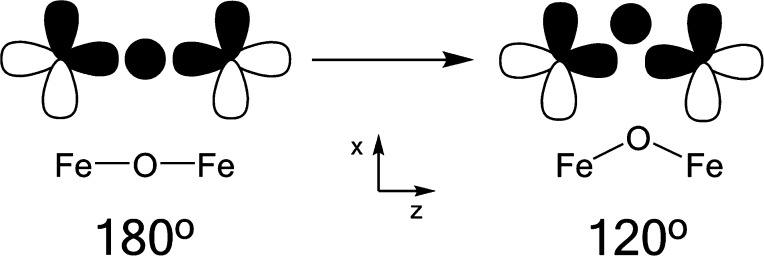
The observations seen for the Kβ″ features of these compounds cannot be rationalized on the basis of the existing understanding of VtC spectra; thus, they warrant more systematic investigation. Inspection of Table 1 reveals that 3 and 4 have Fe–O–Fe core bond angles that are significantly greater than those for the other mono-μ-oxo species, leading to the possibility that the bond angle exerts some control over these spectra. It is well-known that the intensity of VtC features is governed by the amount of metal np mixing into the ligand orbitals; therefore, if the bond angle were to affect these intensities, there should be a molecular orbital based mechanism which modulates the mixing. To picture this conceptually, a Walsh-type diagram was employed (Figure 4). From this simple picture, it can be seen that, in a linear complex, the O 2s orbital can favorably interact with the Fe pz orbital; however, it lies at a node of the Fe px orbital, prohibiting mixing. As the angle is reduced, however, a new, additional interaction with the Fe px orbital also becomes possible, resulting in greater total Fe np character in the O 2s orbital. This is of course a very simplified picture that neglects factors such as varying ligand field strength and charge donation from the ligands, but it provides a viable explanation for the observations seen in the data.
Table 1. Crystallographic Metrical Parameters for the Dimers Studied.
| no. of O donors | av Fe–O–Fe angle (deg) | av Fe–O distancea (Å) | av Fe–oxo distance (Å) | av Fe–OX distance (Å)b | av Fe–ligand distance (Å) | synthesis and crystallographic ref | |
|---|---|---|---|---|---|---|---|
| 1 | 4 | 97.0 | 1.98 | 2.04 | 2.03 | (17) | |
| 2 | 3 | 80.4 | 1.94 | 1.94 | 2.08 | (18, 19) | |
| 3 | 3 | 144.6 | 1.87 | 1.78 | 1.97 | (20) | |
| 4 | 4 | 164.9 | 1.97 | 1.79 | 2.06 | (21) | |
| 5 | 3 | 121.0 | 1.95 | 1.79 | 2.09 | (22) | |
| 6 | 2 | 113.7 | 1.90 | 1.90 | 2.07 | (23) | |
| 7 | 2 | 94.0 | 1.91 | 1.91c | 1.91c | 2.07 | (24, 25) |
| 8d | 2 | 91.5 | 1.82 | 1.82 | 1.95 | (24) |
The distance quoted here is the average bond distance for every Fe–O bond from all ligands as taken from the crystal structures.
X = Ph for 1 and X = H for 2 and 7.
The two distinct O and OH groups are disordered in the crystal structure; therefore, this value is an average over both.
As no crystal structure is available for this compound, all metrical parameters are taken from the DFT optimized structure.
Figure 4.
“Walsh-type” diagram used to rationalize the experimental intensity observations. As the Fe–O–Fe bond angle decreases from 180°, additional Fe np mixing into the O 2s becomes possible, thus explaining the low Kβ″ intensity seen for 3 and 4 relative to that for the other mono-μ-oxo species.
To test the validity of this Walsh diagram and the predictions it engenders, we turned to DFT calculations for a series of hypothetical mono-μ-oxo compounds that vary only in Fe–O–Fe angle (Figure 5). Unlike the compounds studied experimentally, these simple models vary only in Fe–O–Fe bond angles, allowing for a controlled investigation of the effects of bond angle without competing changes from the supporting ligands. Fixed core angles of 90, 120, 150, and 180° were chosen, along with a bis-μ-oxo species having 90° core bond angles, and all Fe–O bond lengths were set to 1.85 Å; all other atoms were geometry optimized. In this manner, the influence of the Fe–O–Fe bond angle could be deconvoluted from other geometric changes. Calculated XES spectra for these complexes are shown in Figure 6, and numerical data can be found in Table 2.
Figure 5.
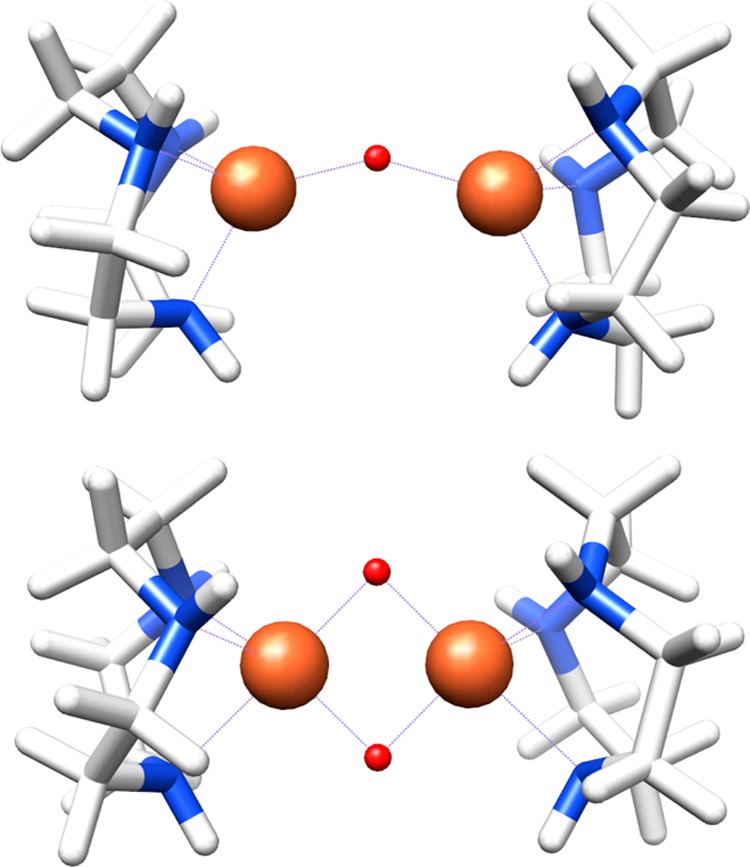
Structures of the hypothetical mono-μ-oxo (top, 150° Fe–O–Fe bond angle) and bis-μ-oxo (bottom, 90° Fe–O–Fe angles) complexes used to systematically investigate the effect of bond angle on Kβ″ intensity. The other mono-μ-oxo species are identical with that shown except for their Fe–O–Fe angles.
Figure 6.

Calculated Kβ″ features for the hypothetical clusters. Panel A shows the spectra for the complexes with 1.85 Å Fe–O bonds, panel B shows the analogous spectra for the models with 1.95 Å bonds, and panel C is an overlay of all calculated spectra. Importantly, there is overlap in the integrated intensities between these two groups, indicating that area alone cannot be used to judge the bond length or number of bridging oxo ligands for Fe–O–Fe dimers when the precise geometry of these complexes is unknown.
Table 2. Numerical Data for Calculated XES Spectra of Hypothetical Compoundsa.
| Fe–O–Fe angle (deg) | total foscb (×106) | O foscc (×106) | Fe p character (%) |
|---|---|---|---|
| 180 | 29.16 | 13.71 | 9.8 |
| 150 | 29.58 | 14.14 | 9.9 |
| 120 | 30.87 | 15.06 | 10.2 |
| 90 | 33.35 | 17.41 | 10.6 |
| 90 (bis-μ-O) | 46.29 | 32.62 | 20.4 |
All tabulated results were obtained from an analysis of the β spin orbitals. The α spin orbitals were not used due to more extensive orbital mixing that prevented identification of an isolated O 2s for some compounds.
Total oscillator strengths were calculated by summing all Kβ″ transitions from the β spin orbitals to each Fe.
The contribution to the oscillator strength due to O was calculated by weighting the individual transition fosc values by the amount of O character present in the donor MO.
From these calculated spectra it can easily be seen that, even at constant Fe–O bond length, the Kβ″ intensity increases with decreasing Fe–O–Fe bond angle. With a linear complex as the starting point, this effect is initially small but grows in magnitude as the angle becomes progressively smaller, with nearly a 15% increase in Kβ″ intensity seen for the 90° complex relative to the linear species. Perhaps not surprisingly, the bis-μ-oxo compound has roughly double the intensity of its 90° mono-μ-oxo congener. This observed increase in intensity is accompanied by the expected increase in Fe np character mixed into the O 2s orbitals; thus, decreasing the Fe–O–Fe bond angle allows for more Fe np character to mix into the orbitals of the bridging atoms. Importantly, the change in total oscillator strength is due entirely to changes occurring in the O transitions, ruling out any influence from changes in bonding to the supporting ligand.
Furthermore, inspection of the x, y, and z components of the calculated emission reveals that, as the oxo translates along the x axis (e.g., to smaller bond angles), the x component of the emission increases dramatically while the z component slightly decreases (Figure 7), leading to an overall increase in Kβ″ intensity. Such a deconvolution of the px, py, and pz components has been experimentally accomplished for a manganese nitride complex, whereby the axial nitride was shown to interact dominantly with the manganese pz orbital.36 Taken together, these computational results validate the Walsh-type picture from Figure 4 and support the rationalization that compounds 3 and 4 have Kβ″ intensities lower than those for the other mono-μ-oxo species due to their larger Fe–O–Fe bond angles.
Figure 7.
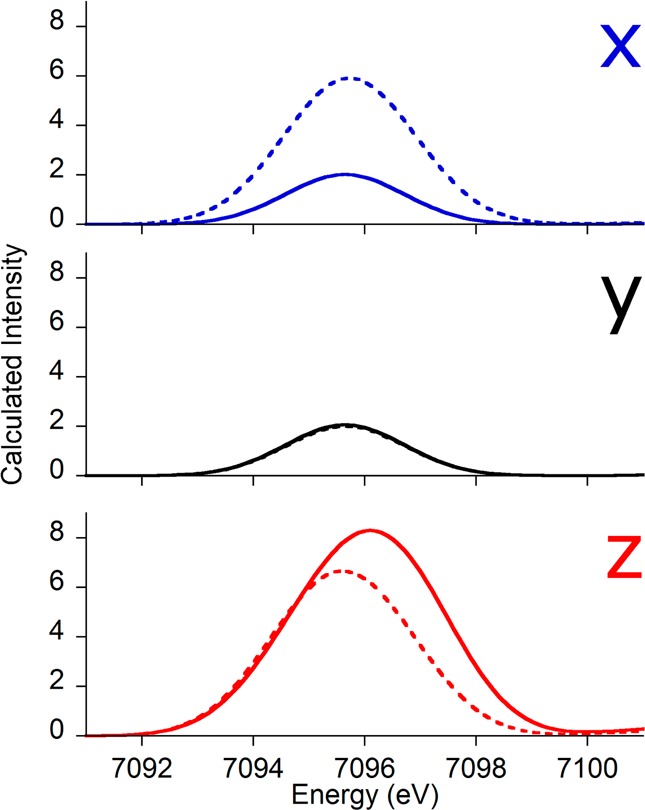
Deconvolutions of the x, y, and z components of the calculated XES spectra for the 180° (solid lines) and 90° (dashed lines) models. The x component increases significantly upon bond angle contraction, while the intensity of the z component is slightly reduced. The y component is essentially unaffected by bond angle changes.
Finally, to demonstrate the competing influences of bond length and bond angle on Kβ″ intensity, we also calculated VtC spectra for a series of compounds analogous to those in Figure 5 but with 1.95 Å Fe–O bond lengths. These spectra, along with a comparison to those from the 1.85 Å compounds, are also found in Figure 6 (panels B and C, respectively). The spectra for these models follow the same trend as is seen for those with 1.85 Å Fe–O bonds, with smaller angles yielding more intense spectra. Moreover, the intensities of these two series overlap, with compounds possessing small angles and long bond lengths giving spectra with Kβ″ features similar to those with large angles but shorter bonds. Care must therefore be taken when attempting to infer structural information from the intensities of these features. Further discussion can be found below, along with implications for bioinorganic systems.
Discussion
As valence-to-core XES matures as a probe of geometric and electronic structure, it is finding increasing applications to bioinorganic systems.4,7,8,37 It has already been used to distinguish between competing structural proposals for metalloenzyme active sites: for example, with the identification of a carbide as the interstitial atom of FeMoco.8 Beyond mere atom identification, model studies also indicate that valence-to-core XES shows promise for probing attributes such as ligand protonation state3,38 and, in some cases, bond activation.9,13 One can expect that, as the information content of these spectra is further developed, XES will find application toward an increasing number of bioinorganic systems.
One such target for study by XES is soluble methane monooxygenase (sMMO). This enzyme is responsible for the biological oxidation of methane to methanol, and modeling its reactivity has been the subject of significant synthetic effort.23,39,40 Intermediate Q—the species that putatively attacks methane41—has, however, eluded definitive structural characterization. EXAFS experiments, with their ability to distinguish both first-shell light atoms and intermetallic distances, have favored a closed, bis-μ-oxo “diamond” core (Figure 8) on the basis of an observed short 2.46 Å Fe–Fe separation.42 This assignment is not without some controversy, however, as model studies have generally favored an open core bearing a mono-μ-oxo bridge and a second, terminal oxo ligand (Figure 8).39,41 Later EXAFS measurements on a similar intermediate in RNR-X have also called into question the bis-μ-oxo assignment of these structures.43 Clearly, additional, complementary probes of these systems are desirable to help resolve this uncertainty.
Figure 8.
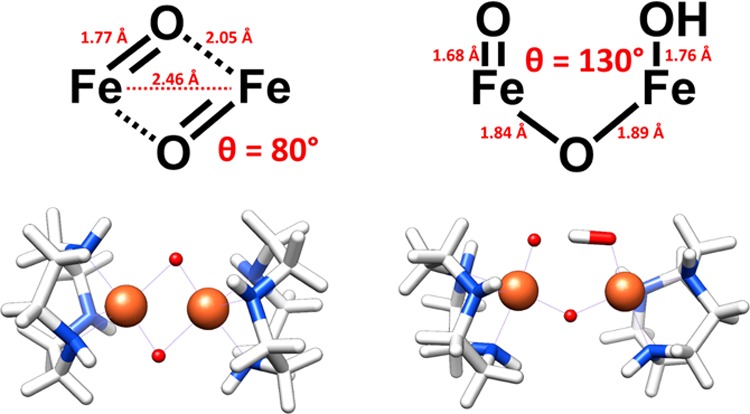
Metrical parameters and computational models for closed bis-μ-oxo (left) and open mono-μ-oxo (right) MMO Q cores.
At first glance, XES, with its sensitivity to ligand environment, might be expected to be able to differentiate between these two proposals. However, a closer inspection in light of the current results reveals that, while the bis-μ-oxo core has longer average bond lengths than the open core, it also has a significantly smaller Fe–O–Fe angle. As these structural attributes are known to have opposite effects on Kβ″ intensity, one cannot, a priori, predict what to expect experimentally.
To explore the feasibility of these experiments, computational models were constructed featuring the proposed core metrics (Figure 8).39,42 As was done above, H3tacn was used as a supporting ligand so as not to interfere with the oxygen Kβ″ features—this is, of course, an idealized situation that would not be present for the protein itself. The calculated valence-to-core XES spectra are shown in Figure 9.
Figure 9.
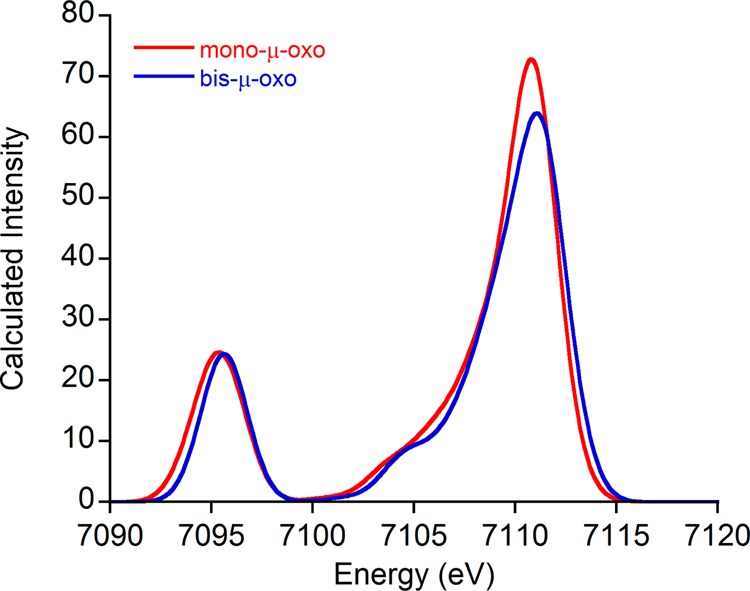
Calculated valence-to-core XES spectra for the MMO model compounds.
As can be seen, apart from a small (∼0.2 eV) energy shift, there is very little difference between the Kβ″ features of these models. Indeed, these calculated spectra are very similar across the entire valence-to-core region. The small differences that are seen are unlikely to enable experimental discrimination between the proposed species, especially given that other O atom donors are present in the protein. It thus appears that the competing effects of increasing bond length and decreasing bond angle nearly exactly cancel out in this case. In this instance, detailed studies of XAS pre-edge structure are more likely to yield fruitful results than would analysis of Kβ″ features.
Summary and Conclusions
In the present study, we have demonstrated that, in addition to bond length, the bond angle is another structural attribute to which valence-to-core XES is sensitive. Hence, these results indicate that caution must be used when attempting to infer structural information from the intensities of valence-to-core features, since bond length is not the sole determining factor. Spectra for compounds with short bonds and large angles will be very similar to those with long bonds and small angles (Figure 6). If the experimental data presented here (Figure 3) were used solely to judge bond lengths, one would arrive at an incorrect conclusion. Rather than detract from these spectra, this new observation instead adds to the rich information that may be extracted from this spectral region.
Acknowledgments
Financial support was provided by the Max-Planck-Gesellschaft and the Alfred P. Sloan foundation. Portions of this research were carried out at the Cornell High Energy Synchrotron Source (CHESS), which is supported by the National Science Foundation and the National Institutes of Health/National Institute of General Medical Sciences under NSF award DMR-0936384.
Supporting Information Available
Text, figures, and tables giving damage assessment for compound 8, sample ORCA input files, details on spectral broadening, and optimized xyz coordinates. This material is available free of charge via the Internet at http://pubs.acs.org.
Author Present Address
∥ Department of Chemistry, The Pennsylvania State University, University Park, PA 16802, United States.
The authors declare no competing financial interest.
Funding Statement
National Institutes of Health, United States
Supplementary Material
References
- Bergmann U.; Horne C. R.; Collins T. J.; Workman J. M.; Cramer S. P. Chem. Phys. Lett. 1999, 302, 119–124. [Google Scholar]
- Glatzel P.; Bergmann U. Coord. Chem. Rev. 2005, 249, 65–95. [Google Scholar]
- Lee N.; Petrenko T.; Bergmann U.; Neese F.; DeBeer S. J. Am. Chem. Soc. 2010, 132, 9715–9727. [DOI] [PubMed] [Google Scholar]
- Leidel N.; Hsieh C.-H.; Chernev P.; Sigfridsson K. G. V.; Darensbourg M. Y.; Haumann M. Dalton Trans. 2013, 42, 7539–7554. [DOI] [PubMed] [Google Scholar]
- Bauer M. Phys. Chem. Chem. Phys. 2014, 16, 13827–13837. [DOI] [PubMed] [Google Scholar]
- Gallo E.; Bonino F.; Swarbrick J. C.; Petrenko T.; Piovano A.; Bordiga S.; Gianolio D.; Groppo E.; Neese F.; Lamberti C.; Glatzel P. ChemPhysChem 2013, 14, 79–83. [DOI] [PubMed] [Google Scholar]
- Pushkar Y.; Long X.; Glatzel P.; Brudvig G. W.; Dismukes G. C.; Collins T. J.; Yachandra V. K.; Yano J.; Bergmann U. Angew. Chem., Int. Ed. 2010, 49, 800–803. [DOI] [PMC free article] [PubMed] [Google Scholar]
- Lancaster K. M.; Roemelt M.; Ettenhuber P.; Hu Y.; Ribbe M. W.; Neese F.; Bergmann U.; DeBeer S. Science 2011, 334, 974–977. [DOI] [PMC free article] [PubMed] [Google Scholar]
- Pollock C. J.; DeBeer S. J. Am. Chem. Soc. 2011, 133, 5594–5601. [DOI] [PubMed] [Google Scholar]
- Delgado-Jaime M. U.; DeBeer S.; Bauer M. Chem. Eur. J. 2013, 19, 15888–15897. [DOI] [PubMed] [Google Scholar]
- Stieber S. C. E.; Milsmann C.; Hoyt J. M.; Turner Z. R.; Finkelstein K. D.; Wieghardt K.; DeBeer S.; Chirik P. J. Inorg. Chem. 2012, 51, 3770–3785. [DOI] [PubMed] [Google Scholar]
- Leidel N.; Chernev P.; Havelius K. G. V.; Schwartz L.; Ott S.; Haumann M. J. Am. Chem. Soc. 2012, 134, 14142–14157. [DOI] [PubMed] [Google Scholar]
- Pollock C. J.; Grubel K.; Holland P. L.; DeBeer S. J. Am. Chem. Soc. 2013, 135, 11803–11808. [DOI] [PMC free article] [PubMed] [Google Scholar]
- Lassalle-Kaiser B.; Boron T. T.; Krewald V.; Kern J.; Beckwith M. A.; Delgado-Jaime M. U.; Schroeder H.; Alonso-Mori R.; Nordlund D.; Weng T.-C.; Sokaras D.; Neese F.; Bergmann U.; Yachandra V. K.; DeBeer S.; Pecoraro V. L.; Yano J. Inorg. Chem. 2013, 52, 12915–12922. [DOI] [PMC free article] [PubMed] [Google Scholar]
- Kropp H.; King A. E.; Khusniyarov M. M.; Heinemann F. W.; Lancaster K. M.; DeBeer S.; Bill E.; Meyer K. J. Am. Chem. Soc. 2012, 134, 15538–15544. [DOI] [PubMed] [Google Scholar]
- Smolentsev G.; Soldatov A. V.; Messinger J.; Merz K.; Weyhermuller T.; Bergmann U.; Pushkar Y.; Yano J.; Yachandra V. K.; Glatzel P. J. Am. Chem. Soc. 2009, 131, 13161–13167. [DOI] [PMC free article] [PubMed] [Google Scholar]
- Snyder B. S.; Patterson G. S.; Abrahamson A. J.; Holm R. H. J. Am. Chem. Soc. 1989, 111, 5214–5223. [Google Scholar]
- Drueke S.; Chaudhuri P.; Pohl K.; Wieghardt K.; Ding X. Q.; Bill E.; Sawaryn A.; Trautwein A. X.; Winkler H.; Gurman S. J. J. Chem. Soc., Chem. Commun. 1989, 59–62. [Google Scholar]
- Gamelin D. R.; Bominaar E. L.; Kirk M. L.; Wieghardt K.; Solomon E. I. J. Am. Chem. Soc. 1996, 118, 8085–8097. [Google Scholar]
- Davies J. E.; Gatehouse B. M. Acta Crystallogr., Sect. B 1973, B29, 1934–1942. [Google Scholar]
- Lippard S. J.; Schugar H. J.; Walling C. Inorg. Chem. 1967, 6, 1825–1831. [Google Scholar]
- Bossek U.; Hummel H.; Weyhermüller T.; Bili E.; Wieghardt K. Angew. Chem.. Int. Ed. 1995, 34, 2642–2645. [Google Scholar]
- Wang D.; Farquhar E. R.; Stubna A.; Münck E.; Que L. J. Nat. Chem. 2009, 1, 145–150. [DOI] [PMC free article] [PubMed] [Google Scholar]
- Xue G. Q.; Wang D.; De Hont R.; Fiedler A. T.; Shan X. P.; Münck E.; Que L. Jr. Proc. Natl. Acad. Sci. U.S.A. 2007, 104, 20713–20718. [DOI] [PMC free article] [PubMed] [Google Scholar]
- Do L. H.; Xue G.; Que L. Jr.; Lippard S. J. Inorg. Chem. 2012, 51, 2393–2402. [DOI] [PMC free article] [PubMed] [Google Scholar]
- Vankó G.; Neisius T.; Molnár G.; Renz F.; Kárpáti S.; Shukla A.; de Groot F. M. F. J. Phys. Chem. B 2006, 110, 11647–11653. [DOI] [PubMed] [Google Scholar]
- Sole V. A.; Papillon E.; Cotte M.; Walter P.; Susini J. Spectrochim. Acta, Part B 2007, 62, 63–68. [Google Scholar]
- Beckwith M. A.; Roemelt M.; Collomb M.-N. l.; DuBoc C.; Weng T.-C.; Bergmann U.; Glatzel P.; Neese F.; DeBeer S. Inorg. Chem. 2011, 50, 8397–8409. [DOI] [PubMed] [Google Scholar]
- Neese F. Wiley Interdiscip. Rev.: Comput. Mol. Sci. 2012, 2, 73–78. [Google Scholar]
- Moreland A. C.; Rauchfuss T. B. Inorg. Chem. 2000, 39, 3029–3036. [DOI] [PubMed] [Google Scholar]
- Perdew J. P. Phys. Rev. B 1986, 33, 8822. [DOI] [PubMed] [Google Scholar]
- Becke A. D. Phys. Rev. A 1988, 38, 3098. [DOI] [PubMed] [Google Scholar]
- Pantazis D. A.; Chen X. Y.; Landis C. R.; Neese F. J. Chem. Theory Comput. 2008, 4, 908–919. [DOI] [PubMed] [Google Scholar]
- Klamt A.; Schüürmann G. J. Chem. Soc., Perkin Trans. 2 1993, 799–805. [Google Scholar]
- Neese F. Inorg. Chim. Acta 2002, 337C, 181. [Google Scholar]
- Bergmann U.; Bendix J.; Glatzel P.; Gray H. B.; Cramer S. P. J. Chem. Phys. 2002, 116, 2011–2015. [Google Scholar]
- Lancaster K. M.; Hu Y.; Bergmann U.; Ribbe M. W.; DeBeer S. J. Am. Chem. Soc. 2013, 135, 610–612. [DOI] [PMC free article] [PubMed] [Google Scholar]
- Krewald V.; Lassalle-Kaiser B.; Boron T. T.; Pollock C. J.; Kern J.; Beckwith M. A.; Yachandra V. K.; Pecoraro V. L.; Yano J.; Neese F.; DeBeer S. Inorg. Chem. 2013, 52, 12904–12914. [DOI] [PMC free article] [PubMed] [Google Scholar]
- Xue G. Q.; Fiedler A. T.; Martinho M.; Münck E.; Que L. Jr. Proc. Natl. Acad. Sci. U.S.A. 2008, 105, 20615–20620. [Google Scholar]
- Xue G.; De Hont R.; Münck E.; Que L. Jr. Nat. Chem. 2010, 2, 400–405. [DOI] [PMC free article] [PubMed] [Google Scholar]
- Tinberg C. E.; Lippard S. J. Acc. Chem. Res. 2011, 44, 280–288. [DOI] [PMC free article] [PubMed] [Google Scholar]
- Shu L. J.; Nesheim J. C.; Kauffmann K.; Münck E.; Lipscomb J. D.; Que L. Jr. Science 1997, 275, 515–518. [DOI] [PubMed] [Google Scholar]
- Dassama L. M. K.; Silakov A.; Krest C. M.; Calixto J. C.; Krebs C.; Bollinger J. M. Jr.; Green M. T. J. Am. Chem. Soc. 2013, 135, 16758–16761. [DOI] [PMC free article] [PubMed] [Google Scholar]
Associated Data
This section collects any data citations, data availability statements, or supplementary materials included in this article.


