Abstract
Objective
To test whether statistical learning on clinical and laboratory test patterns would lead to an algorithm for Kawasaki disease (KD) diagnosis that could aid clinicians.
Study design
Demographic, clinical, and laboratory data were prospectively collected for subjects with KD and febrile controls (FCs) using a standardized data collection form.
Results
Our multivariate models were trained with a cohort of 276 patients with KD and 243 FCs (who shared some features of KD) and validated with a cohort of 136 patients with KD and 121 FCs using either clinical data, laboratory test results, or their combination. Our KD scoring method stratified the subjects into subgroups with low (FC diagnosis, negative predictive value >95%), intermediate, and high (KD diagnosis, positive predictive value >95%) scores. Combining both clinical and laboratory test results, the algorithm diagnosed 81.2% of all training and 74.3% of all testing of patients with KD in the high score group and 67.5% of all training and 62.8% of all testing FCs in the low score group.
Conclusions
Our KD scoring metric and the associated data system with online (http://translationalmedicine.stanford.edu/cgi-bin/KD/kd.pl) and smartphone applications are easily accessible, inexpensive tools to improve the differentiation of most children with KD from FCs with other pediatric illnesses.
In the absence of a specific diagnostic test, the diagnosis of Kawasaki disease (KD) is currently based on clinical criteria.1 Nonspecific laboratory testing can help to support the diagnosis.2 If not treated promptly, patients with KD may develop coronary artery dilatation or aneurysms. The cardiovascular damage can be largely prevented by timely administration of intravenous immunoglobulin.3 Thus, there is a need for a sensitive and specific diagnostic test that can facilitate diagnosis and permit timely treatment.
We postulated that quantitative analyses of KD-associated patterns of clinical and laboratory data could synergistically improve diagnostic accuracy. We used statistical learning methods to develop and validate KD diagnostic algorithms, which can be applied to existing and evolving information technologies to create novel and inexpensive point-of-care tools for the diagnosis of acute KD.
Methods
Inclusion criteria for subjects with KD were based on the American Heart Association guidelines.1 We included all subjects with KD diagnosed within the first 10 days after fever onset who had fever for at least 3 days and 4 of 5 classic criteria or 3 or fewer criteria with coronary artery abnormalities documented by echocardiogram. Febrile controls (FCs) were children evaluated in the emergency department who had fever for at least 3 days accompanied by at least 1 of the KD criteria (rash, conjunctival injection, oral mucosal changes, extremity changes, enlarged cervical lymph node). Febrile children with prominent respiratory or gastrointestinal symptoms were specifically excluded so the majority of the controls had KD in the differential diagnosis of their condition. Informed consent was obtained from the parents of all subjects and assent from all subjects ≥7 years of age. This study was approved by the Human Subjects Protection Programs at the University of California San Diego and Stanford University.
De-identified clinical and laboratory data were extracted from the University of California San Diego KD electronic database for multivariate analysis. FCs had a clinically determined or culture-proved etiology for their febrile illness (Table I; available at www.jpeds.com). Possible viral infection was defined as a febrile illness that resolved without specific treatment within 3 days of obtaining the clinical samples. All subjects underwent evaluation for their febrile illnesses at Rady Children's Hospital San Diego and had complete historical, physical examination, and laboratory data required for multivariate analysis. Subjects were randomized (R random sampling method) into 2 cohorts: 276 patients with KD and 243 FCs for model training analysis; 136 patients with KD and 121 FCs for model testing analysis. Demographic data were analyzed using R epicalc package (The R Project for Statistical Computing; http://r-project.org).
Table I.
Diagnosis of FCs
| Training (FC, n = 243) | Testing (FC, n = 121) | |
|---|---|---|
| Viral infection | 174 | 82 |
| Bacterial infection | 53 | 23 |
| Other inflammatory processes | 14 | 15 |
| Both bacterial and viral infection | 2 | 1 |
Clinical data included 7 variables: (1) fever (temperature ≥38.0°C) in the emergency department or by history in the past 24 hours; (2) conjunctival injection; (3) extremity changes including red, swollen, or peeling hands or feet; (4) oropharyngeal changes including red pharynx, red, fissured lips, or strawberry tongue; (5) cervical lymph node of at least 1.5 cm; (6) rash; and (7) number of days of illness (first day of fever = illness day 1). Laboratory data obtained prior to administration of intravenous immunoglobulin included 12 variables: total white blood cell count; percentages of monocytes, lymphocytes, eosinophils, neutrophils, and immature neutrophils (bands); platelet count; hemoglobin (Hgb) concentration normalized for age; C-reactive protein; gamma-glutamyl transferase; alanine aminotransferase; and erythrocyte sedimentation rate. Logistic regression computation using the training data yielded both the adjusted ORs and the likelihood ratio test P value.
We used linear discriminant analysis (LDA) to classify individual subjects based on clinical variables alone, laboratory test variables alone, or the combined data sets. R library MASS function “lda” was used. Coefficients of linear discriminants, which are the associated weights with the first linear discriminant function, were calculated as a measure of the association of each variable with the final diagnosis (Table II). We performed receiver operating characteristic (ROC) analyses of the diagnostic performance of the clinical, laboratory, and combined LDA models for binary classification of subjects with KD from FCs in the training/ testing cohort and compared their area under the curve (AUC).
Table II.
KD predictive features and multivariate modeling to discriminate KD from FC using training cohort
| LDA |
||||||
|---|---|---|---|---|---|---|
| Twelve parameters | Feature | OR (95% CI) | P | Clinical (LD1) | Laboratory (LD1) | Combined (LD1) |
| Clinical parameters | Conjunctival injection | 7.95 (3.41-18.53) | <.001 | 1.114157471 | 0.928053276 | |
| Extremity changes | 6.97 (3.4-14.3) | <.001 | 1.429549527 | 1.0550829 | ||
| Oropharyngeal changes | 5.21 (2.22-12.2) | <.001 | 0.930626782 | 0.770919996 | ||
| Rash | 2.43 (0.86-6.84) | .088 | 0.368589847 | 0.383400509 | ||
| Cervical lymph node >1.5 cm | 1.51 (0.68-3.37) | .304 | 0.344090925 | 0.185409544 | ||
| Days of illness | 1.12 (0.97-1.29) | .12 | 0.072792981 | 0.05634683 | ||
| Fever, temperature ≥38.0°C | 0.05 (0.01-0.25) | <.001 | –1.034326504 | –0.952150912 | ||
| Laboratory tests | Eosinophils, % | 1.06 (0.95-1.19) | .293 | 0.068841219 | 0.028443882 | |
| C-reactive protein, mg/dL | 1.04 (0.98-1.11) | .172 | 0.021868585 | 0.015627459 | ||
| ESR, mm/h | 1.03 (1.01-1.05) | <.001 | 0.014970912 | 0.008380854 | ||
| WBC, 103/mm3 | 1.03 (0.97-1.1) | .364 | 0.011353403 | 0.016912331 | ||
| Monocytes, % | 1.02 (0.93-1.13) | .634 | –0.046919896 | –0.00169595 | ||
| Gamma-glutamyl transferase, IU/L | 1.0074 (0.9995-1.0153) | .054 | 0.004634134 | 0.002988495 | ||
| Platelets, % | 1.0055 (1.0021-1.009) | .001 | 0.004126564 | 0.002753319 | ||
| Alanine aminotransferase, IU/L | 1.0052 (0.9985-1.0119) | .089 | 0.001249501 | 0.001066656 | ||
| Neutrophils, % | 0.97 (0.93-1.02) | .259 | –0.004545484 | –0.010462242 | ||
| Immature neutrophils, % | 0.98 (0.93-1.03) | .452 | –0.000422233 | –0.006581996 | ||
| Lymphocytes, % | 0.96 (0.91-1.01) | .155 | –0.013016002 | –0.013392125 | ||
| Hgb normalized for age, mg/dL | 0.57 (0.41-0.79) | <.001 | –0.28002571 | –0.219374457 | ||
ESR, erythrocyte sedimentation rate; LD1, variable coefficient of the first linear discriminant; WBC, white blood cell count.
The projection value onto the first canonical (LDA) was designated as the KD score, allowing the clinical variables to be collectively interpreted on a scale, rather than a strict binary discrimination. Three different types of KD scores were computed based on clinical findings, laboratory test results, and their combination for all subjects and were used to stratify subjects into subgroups with low, intermediate, and high scores. The low and high groups had a negative predictive value (NPV, FC diagnosis) >95% and a positive predictive value (PPV, KD diagnosis) >95%, respectively.
With a model view controller design, we applied a previously developed server-based biocomputational framework4 to allow physicians remote access to our KD diagnostic algorithm. The algorithm and associated Web application were implemented using R and PERL, respectively. The iPhone application was developed in the integrated development environment Xcode 3.2.4 and iOS SDK 4.1 using Objective C. Later it was tested using iPhone Simulator 4.1 and was supported by iOS 4.1 or higher versions. The Google phone application, enabled by the Android Application Framework, was developed on the Google Android platform (Ver. 2.3, which is used by 57% of all current Android developers), using the Oracle Java 5.0 programming language, on Linux operating system by Fedora Project.
Results
In both the training and testing cohorts, the patients with KD were younger than the FCs but were otherwise similar (Table III; available at www.jpeds.com).
Table III.
Demographics analysis
| Training (KD, n = 276; FC, n = 243) |
Testing (KD, n = 136; FC, n = 121) |
|||||||||
|---|---|---|---|---|---|---|---|---|---|---|
| KD | FC | Observations | Test statistics | P | KD | FC | Observations | Test statistics | P | |
| Age, mo | t test (516 df) = 2.63 | .009 | t test (254 df) = 2.57 | .011 | ||||||
| Observations | 276 | 243 | 519 | 136 | 121 | 257 | ||||
| Mean (SD) | 37.1 (31.5) | 45.7 (42.6) | 41.1 (37.3) | 34.7 (32.1) | 46.9 (43.7) | 40.4 (38.4) | ||||
| Sex, % | χ2 (1 df) = 1.92 | .166 | χ2 (1 df) = 0.6 | .44 | ||||||
| Observations | 183 | 153 | 336 | 90 | 78 | 168 | ||||
| Female | 62 (33.9) | 64 (41.8) | 126 (37.5) | 41 (45.6) | 30 (38.5) | 71 (42.3) | ||||
| Mean (SD) | 121 (66.1) | 89 (58.2) | 210 (62.5) | 49 (54.4) | 48 (61.5) | 97 (57.7) | ||||
| Race, % | Fisher exact test | .043 | χ2 (4 df) = 5.15 | .273 | ||||||
| Observations | 272 | 230 | 502 | 134 | 114 | 248 | ||||
| African-American | 11 (4) | 6 (2.6) | 17 (3.4) | 5 (3.7) | 4 (3.5) | 9 (3.6) | ||||
| American Indian/Alaskan Native | 1 (0.4) | 0 (0) | 1 (0.2) | 0 (0) | 0 (0) | 0 (0) | ||||
| Asian | 43 (15.8) | 21 (9.1) | 64 (12.7) | 22 (16.4) | 10 (8.8) | 32 (12.9) | ||||
| White | 64 (23.5) | 64 (27.8) | 128 (25.5) | 39 (29.1) | 28 (24.6) | 67 (27) | ||||
| Hawaiian/Other Pacific Islander | 2 (0.7) | 0 (0) | 2 (0.4) | 0 (0) | 0 (0) | 0 (0) | ||||
| Hispanic | 88 (32.4) | 95 (41.3) | 183 (36.5) | 44 (32.8) | 44 (38.6) | 88 (35.5) | ||||
| Mixed | 63 (23.2) | 44 (19.1) | 107 (21.3) | 24 (17.9) | 28 (24.6) | 52 (21) | ||||
*The number of the subcategories violates the assumptions of the χ2 test, and so Fisher exact test was used.
We performed multivariate analysis of the clinical and laboratory test variables for KD and FC discrimination in our training data set (Table II). Clinical variables of conjunctival injection, extremity changes, and oropharyngeal changes; fever; and laboratory test variables of erythrocyte sedimentation rate, platelet count, and age-adjusted Hgb were statistically different between the groups.
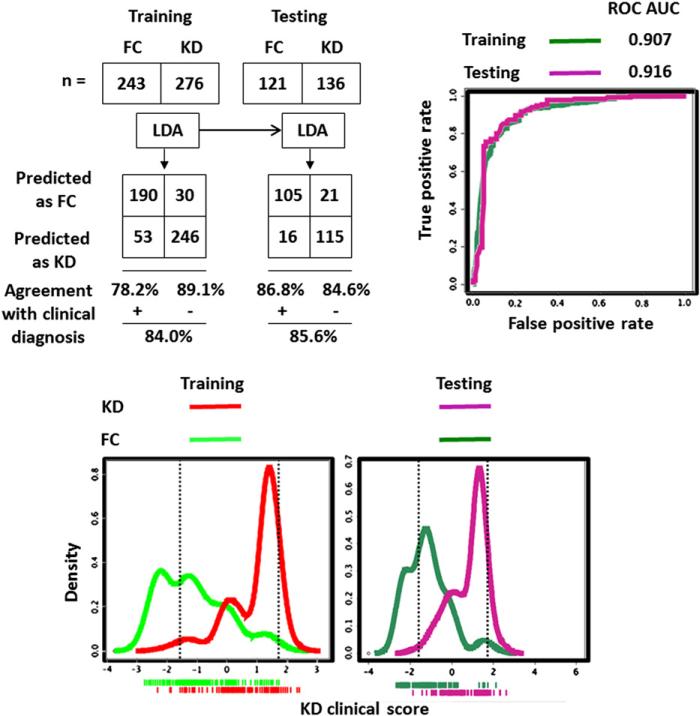
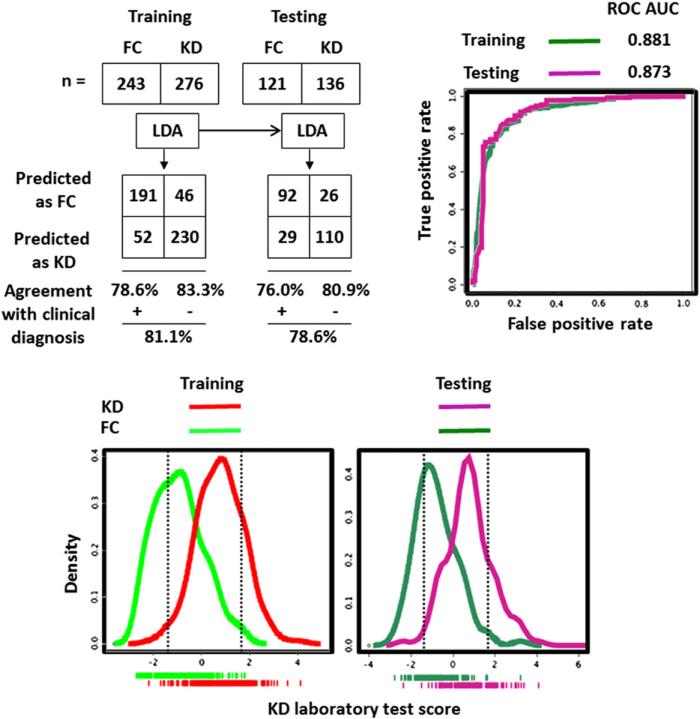
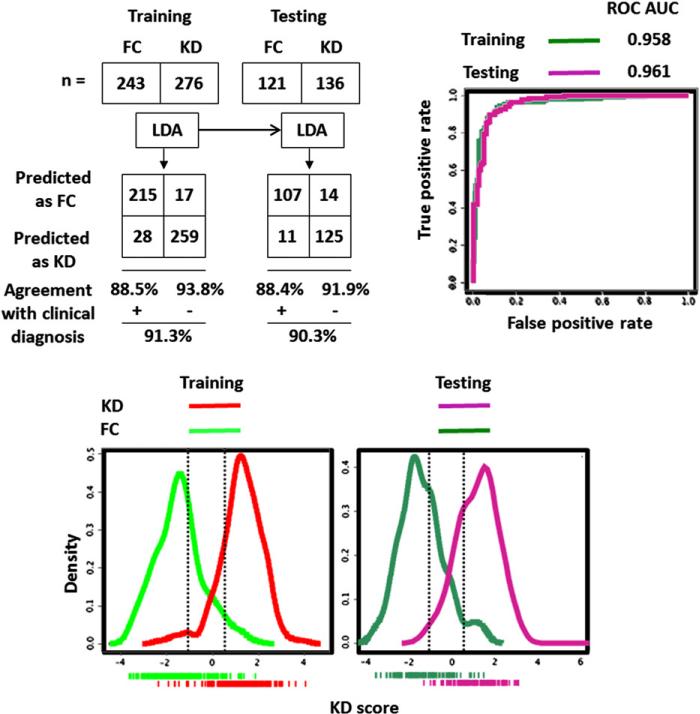
In the LDA models with clinical, laboratory test results, and their combination (Table II), the clinical variables of the extremity changes, conjunctival injection, and oropharyngeal changes and the laboratory variable of the age-adjusted Hgb concentration contributed the most to the binary classification. Comparing the 3 LDA models (Figures 1-4; Figures 1 and 2; available at www.jpeds.com), the KD/FC LDA binary classification performances (sensitivity, specificity, PPV, NPV, and ROC AUC) in both the training and testing were synergistically improved if clinical and laboratory test variables were combined.
Figure 1.
LDA with clinical variables to discriminate subjects with KD from FCs. Dotted vertical lines in the bottom density plots define the boundaries of the low (95% NPV for FC prediction) and high score (95% PPV for KD prediction) subgroups.
Figure 4.
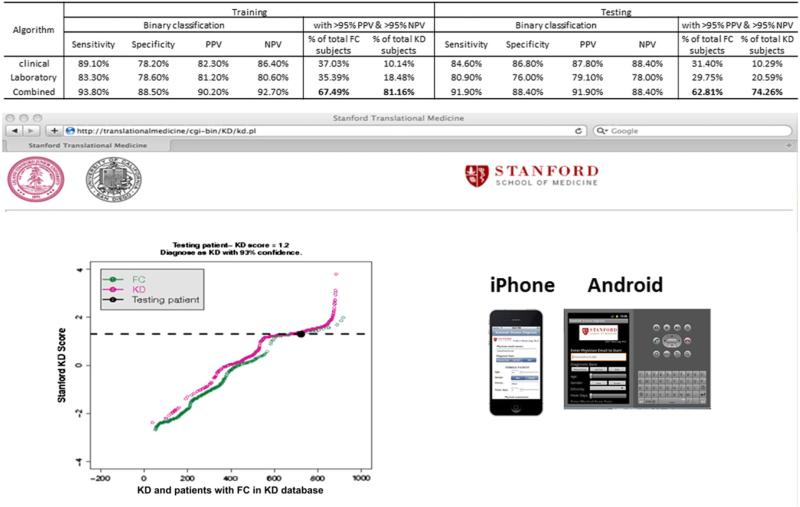
Comparative analysis between 3 different KD scoring algorithms and predictive analysis adapted to Web site or smartphone applications. Analysis example at the Web site depicts KD score of an individual patient superimposed on KD scores of patients KD and FC in our KD database.
Figure 2.
LDA with laboratory test results to discriminate subjects with KD from FCs. Dotted vertical lines in the bottom density plots define the boundaries of the low (95% NPV for FC prediction) and high score (95% PPV for KD prediction) subgroups.
Density plots of KD scores calculated by clinical, laboratory test, and combined LDA modeling methods demonstrated the class separation (Figures 1-3). To achieve sensitive and specific differentiation of KD from FC, we partitioned the KD scores into 3 groups: low KD score group allowing accurate FC diagnosis (<5% of KD misclassified), intermediate score group with inadequate KD/FC differentiation, and high KD score group allowing accurate KD diagnosis (<5% of FCs misclassified). We targeted the 95% PPV high KD score group and 95% NPV low KD score group for accurate KD and FC discrimination.
Figure 3.
Performance of KD score derived from LDA combining clinical and laboratory variables to discriminate subjects with KD from FCs. Top left, The 2 × 2 tables and resulting diagnostic indices for KD score. Top right, ROC curves for the KD score applied to training and testing cohorts. Bottom, Density plots of KD scores for training (left) and testing (right) cohorts. Dotted vertical lines define the upper and lower boundaries of the low (95% NPV for FC prediction) and high score (95% PPV for KD prediction) subgroups, respectively.
The number of correctly diagnosed KD patients (high score group) and FCs (low score group) increased to 67.49% of all FCs and 81.16% of all KD patients in training and 62.81% of all FCs and 74.26% of all KD patients in testing when the clinical and laboratory findings were combined (Figures 1-4).
To facilitate point-of-care implementation of the KD score, we created the following Web site (http://translationalmedicine.stanford.edu/cgi-bin/KD/kd.pl) to permit remote use of the KD scoring system (Figure 4). In addition, we developed smartphone applications (iPhone and Android versions) to allow clinicians point-of-care access to our server-based algorithm for real-time KD diagnosis.
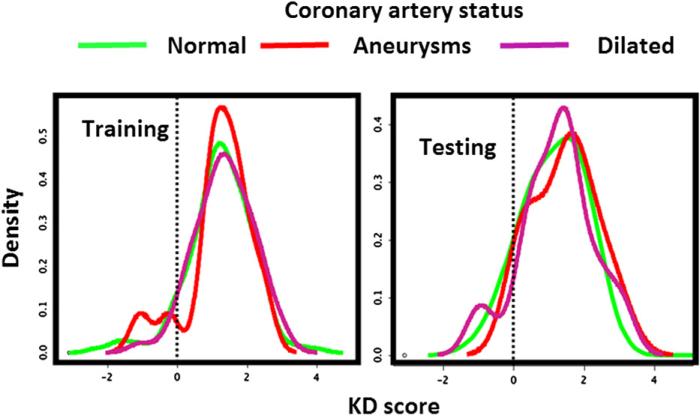
We examined the performance of the KD score in prediction of coronary status using the model combining both clinical and laboratory test variables. The score density plots of subjects with KD with normal, aneurysmal, or dilated coronary arteries were overlaid. The almost complete overlapping pattern suggests poor performance of the KD scoring system for coronary status prediction (Figure 5; available at www.jpeds.com).
Figure 5.
Analysis of KD scores in the prediction of coronary abnormalities by overlaying density plots of the scores of subjects with KD on different coronary artery outcomes.
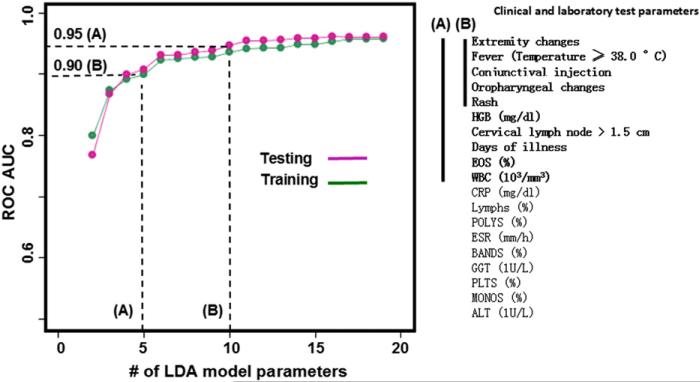
We explored the impact on KD diagnostic modeling incurred by a reduction in the number of model variables available for the predictive analysis. We reasoned that many potential patients would have incomplete data early in the course of KD. Beginning with the least-weighted variable (Figure 6, from bottom to the top), we iteratively reduced the number of variables to construct LDA models of increasingly smaller panel sizes. The models were developed using training data and tested blindly on the testing dataset. ROC AUCs were computed and plotted. The ROC analyses of LDA models with reduced numbers of variables revealed AUCs of 0.95 and 0.90 for models with 10 or 5 variables, respectively. The 10-variable model includes all the 7 clinical variables and 3 laboratory tests: Hgb, eosinophils, and white blood cell count.
Figure 6.
KD LDA models with reduced number of variables (listed in descending order by the absolute value of their weights). The model performance was gauged by ROC analysis. Model A, 10-variable score with AUC of 0.95. Model B, 5-variable score with AUC of 0.90. HGB, hemoglobin; EOS, eosinophil; WBC, white blood cell; CRP, C-reactive protein; POLYS, polymorpho-nuclear leukocytes; ESR, erythrocyte sedimentation rate; GGT, gamma-glutamyl transferase; PLTS, platelets; MONOS, monocytes; ALT, alanine aminotransferase.
Discussion
We performed statistical learning and developed 3 different scoring systems for the diagnosis of KD. The score combining clinical findings and laboratory data resulted in a sensitive (>95% PPV) and specific (>95% NPV) diagnosis of ~60% of FCs and ~75% of patients with KD. Within the patient groups of low and high KD scores, ~5% of patients were falsely classified as being either FCs (when they clinically were judged to have KD) or KD (when they clinically were judged to be FCs).
The clinical and laboratory variables we used in the multivariate analysis are routinely obtained during the evaluation of children with suspected KD and rapidly reported by most clinical laboratories. Thus, our KD score can now be subjected to prospective, multicenter testing in a variety of clinical settings to establish its utility. Currently, clinicians rely on clinical experience without the benefit of a formal scoring system. Many reports have claimed good discrimination between KD and FC based on a single biomarker, but none have been successfully validated.5,6 One problem has been with the selection of FCs who do not represent the population of patients who could legitimately be confused with having KD.7
A strength of this study is the application of machine learning (LDA) to a large KD and FC dataset created through prospective, standardized data collection over a 12-year period. An additional strength was the use of FCs for whom KD was actually considered in the differential diagnosis and who had fever and at least 1 of the clinical signs of KD.
We also recognize several limitations to our study. Data were collected by clinical personnel with experience in the evaluation and management of patients with KD and FCs. The final diagnosis of KD depended, for the majority of patients without coronary artery abnormalities, on the clinical judgment and experience of the same clinical team. Pretest probability is an important element in the performance of any diagnostic test and the skill of the clinicians in selecting subjects for inclusion in this study may have influenced the results. Therefore, the performance of the combined score in the hands of those less skilled in the diagnosis of KD will need to be prospectively evaluated. We were unable to incorporate the nuances that an experienced clinician might use to support or refute a diagnosis of KD. Experienced clinicians may incorporate ancillary findings such as perineal accentuation of rash, urethral meatal erythema, limbal sparing from conjunctival injection, and irritability to modify their risk assessment for KD. Similarly, respiratory symptoms in the patient or family, asynchronous onset of eye changes, splenomegaly, discrete oral lesions, or a vesiculobullous rash may dissuade experienced clinicians from a diagnosis of KD. Future versions of the KD score may use such findings to refine the risk assessment. Without a gold standard for the diagnosis of KD and without serial echocardiograms on our FCs, we cannot eliminate the possibility that some subjects were incorrectly classified. Although we have performed a validation of our KD score using an independent cohort of subjects with KD and FCs, the score requires prospective validation under point-of-care clinical conditions at multiple centers. Ideally, this would be performed with echocardiograms on the FCs to provide additional reassurance that patients with incomplete or atypical KD were not hidden among them. The performance of the algorithm for patients with incomplete KD is unknown and will need to be studied. Future prospective studies will validate whether our algorithm can contribute to the diagnosis of children with incomplete KD. Despite a good predictive value for the very low and high KD scoring groups identified by this algorithm, 35% of FCs and 25% of subjects with KD with indeterminate scores still require additional observation and testing to establish a diagnosis. We postulate that proteomics and limited locus genotypes might be used in the future to further resolve the intermediate group to achieve improved KD diagnosis.8
Our KD scoring metrics are amenable to automation to develop data-driven predictive systems to diagnose KD and may be useful for other diseases as well. We have applied existing and evolving information technologies, including database, Web 2.0, and mobile computing, to translate our KD predictive algorithm into clinical practice. The current smartphone application was developed to support the testing to validate our KD diagnostic algorithm under varied clinical conditions. Therefore, it is early and premature to rush the KD application to clinics before prospective studies. Once optimized and validated, our smartphone application can then be used as a point-of-care diagnostic tool to manage KD.
Ultimately, the interface among the electronic medical record (EMR), hand-held devices (cell phone), and server-based clinical-computation may benefit patients and clinicians. Consistent with the current mandate to expand EMR use,9 future integration of our KD predictive algorithm with the bedside EMR can provide a platform to drive translational medicine for improved KD diagnosis.
Acknowledgments
The authors thank the participating patients and their families for these studies. The authors thank our colleagues at the Stanford University Pediatric Proteomics group for critical discussions and the Stanford University IT group for Linux cluster support. The authors are also thankful to Gigi Liu and Weihong Pang for their assistance in data analysis and software development.
Supported by the National Institutes of Health, National Heart, Lung, and Blood Institute (HL-69413 to J.B. and J.K.), Stanford University Children's Health Initiative, (CHI) award (to X.L.), the Hartwell Foundation, the Harold Amos Medical Faculty Development Program, and the Robert Wood Johnson Foundation Award (to A.T.).
Glossary
- AUC
Area under the curve
- EMR
Electronic medical record
- FC
Febrile control
- Hgb
Hemoglobin
- KD
Kawasaki disease
- LDA
Linear discriminant analysis
- NPV
Negative predictive value
- PPV
Positive predictive value
- ROC
Receiver operating characteristics
Footnotes
The authors declare no conflicts of interest.
References
- 1.Newburger JW, Takahashi M, Gerber MA, Gewitz MH, Tani LY, Burns JC, et al. Diagnosis, treatment, and long-term management of Ka wasaki disease: a statement for health professionals from the Committee on Rheumatic Fever, Endocarditis and Kawasaki Disease, Council on Cardiovascular Disease in the Young, American Heart Association. Circulation. 2004;110:2747–71. doi: 10.1161/01.CIR.0000145143.19711.78. [DOI] [PubMed] [Google Scholar]
- 2.Burns JC, Mason WH, Glode MP, Shulman ST, Melish ME, Meissner C, et al. Clinical and epidemiologic characteristics of patients referred for evaluation of possible Kawasaki disease. United States Multicenter Kawasaki Disease Study Group. J Pediatr. 1991;118(5):680–6. doi: 10.1016/s0022-3476(05)80026-5. [DOI] [PubMed] [Google Scholar]
- 3.Newburger JW, Takahashi M, Beiser AS, Burns JC, Bastian J, Chung KJ, et al. A single intravenous infusion of gamma globulin as compared with four infusions in the treatment of acute Kawasaki syndrome. N Engl J Med. 1991;324:1633–9. doi: 10.1056/NEJM199106063242305. [DOI] [PubMed] [Google Scholar]
- 4.Ling XB, Cohen H, Jin J, Lau I, Schilling J. FDR made easy in differential feature discovery and correlation analyses. Bioinformatics. 2009;25:1461–2. doi: 10.1093/bioinformatics/btp176. [DOI] [PubMed] [Google Scholar]
- 5.Dahdah N, Siles A, Fournier A, Cousineau J, Delvin E, Saint-Cyr C, et al. Natriuretic peptide as an adjunctive diagnostic test in the acute phase of Kawasaki disease. Pediatr Cardiol. 2009;30:810–7. doi: 10.1007/s00246-009-9441-2. [DOI] [PubMed] [Google Scholar]
- 6.Okada Y, Minakami H, Tomomasa T, Kato M, Inoue Y, Kozawa K, et al. Serum procalcitonin concentration in patients with Kawasaki disease. J Infect. 2004;48:199–205. doi: 10.1016/j.jinf.2003.08.002. [DOI] [PubMed] [Google Scholar]
- 7.Huang MY, Gupta-Malhotra M, Huang JJ, Syu FK, Huang TY. Acute-phase reactants and a supplemental diagnostic aid for Kawasaki disease. Pediatr Cardiol. 2010;31:1209–13. doi: 10.1007/s00246-010-9801-y. [DOI] [PMC free article] [PubMed] [Google Scholar]
- 8.Ling XB, Lau K, Kanegaye JT, Pan Z, Peng S, Ji J, et al. A diagnostic algorithm combining clinical and molecular data distinguishes Kawasaki disease from other febrile illnesses. BMC Med. 2011;9:130. doi: 10.1186/1741-7015-9-130. [DOI] [PMC free article] [PubMed] [Google Scholar]
- 9.Mellins ED, Macaubas C, Nguyen K, Deshpande C, Phillips C, Peck A, et al. Distribution of circulating cells in systemic juvenile idiopathic arthritis across disease activity states. Clin Immunol. 2010;134:206–16. doi: 10.1016/j.clim.2009.09.010. [DOI] [PMC free article] [PubMed] [Google Scholar]


