

Abstract
Hematopoietic stem cells (HSC) have been highly enriched using combinations of 12–14 surface markers. Genes specifically expressed by HSC as compared to other multipotent progenitors may yield new stem cell enrichment markers, as well as elucidate self-renewal and differentiation mechanisms. We previously reported that multiple cell surface molecules are enriched on mouse HSC compared to more differentiated progeny. Here, we present a definitive expression profile of the cell adhesion molecule Esam1 in hematopoietic cells using RT-qPCR and flow cytometry studies. We found Esam1 highly and selectively expressed by HSC from mouse bone marrow. Esam1 is also a viable positive HSC marker in fetal, young and aged mice, as well as in mice of several different strains. In addition, we find robust levels of Esam1 transcripts in purified human HSC. Esam1−/− mice do not exhibit severe hematopoietic defects, however, Esam1−/− BM has an increased frequency of HSC and fewer T cells. HSC from Esam1−/− mice give rise to more granulocyte/monocytes in culture and a higher T cell:B cell ratio upon transplantation into congenic mice. These studies identify Esam1 as a novel, widely applicable HSC-selective marker and suggest that Esam1 may play roles in both HSC proliferation and lineage decisions.
Keywords: Hematopoietic stem cell, engraftment, bone marrow transplantation, adhesion molecules, cell surface markers, blood cell development
INTRODUCTION
Hematopoietic stem cells (HSC) are capable of both self-renewal and differentiation into all the different types of blood cells [1]. Progression from HSC to increasingly differentiated progeny is accompanied by the loss of self-renewal capability, followed by the loss of lineage potential. By identifying genes that are differentially expressed in distinct hematopoietic progenitor populations, we will better understand mechanisms involved in stem cell differentiation and self-renewal. A central question in hematopoiesis is how cell-extrinsic signals from the BM microenvironment such as soluble ligands, matrix interactions and cell-cell contact affect HSC self-renewal, differentiation and migration. As HSC are capable of extensive self-renewal in vivo, but do not readily self-renew under in vitro growth conditions, it has been inferred that complex signals from the local BM environment must regulate self-renewal. Selectively expressed cell surface molecules may mediate specific interactions with the microenvironment that control cell location and fate. Characterization of HSC-specific receptors is important to define niche–stem cell interactions and may identify BM cell subpopulations and receptor binding partners that regulate HSC function. In addition, HSC-selective cell surface molecules are critically important for the specific isolation of highly pure HSC. The use of combinations of viable markers has enabled separation of multiple, functionally distinct hematopoietic cell populations and yielded important insights on HSC differentiation during both normal and malignant hematopoiesis. Newly discovered cell surface molecules may serve as novel, more specific markers to increase the purity of hematopoietic populations while at the same time decreasing the complexity of cell identification and isolation methods. Novel markers capable of identifying HSC from various strains and throughout ontogeny would be particularly valuable.
Our previous gene expression screen identified Esam1 (Endothelial cell-Selective Adhesion Molecule 1) as robustly and selectively expressed by long-term (LT)-HSC as compared to short-term (ST)-HSC and multipotent progenitors (MPP) [2]. Esam1 is a transmembrane protein with two extracellular immunoglobulin domains that was first identified via its association with endothelial tight junctions [3, 4]. It mediates homophilic and calcium-independent cell adhesion. Esam1−/− mice generated by gene targeted deletion did not exhibit overt vasculature defects, however, Esam1 appeared to decrease pathological angiogenesis and retard tumor growth [5], and neutrophil extravasation was impaired in the absence of endothelial Esam1 [6]. Esam1 has been reported to co-localize with tight junction proteins in brain and muscle capillaries, as shown by immunogold electron microscopy [4]. Interestingly, our gene expression study identified several proteins associated with tight or adherens junction complexes in addition to Esam1 as upregulated in HSC compared to ST-HSC and MPP [2]. The role of these putative junction complexes or Esam1 itself in HSC function has not been characterized. Here, we provide a comprehensive analysis of Esam1 expression in hematopoietic tissue and begin to assess the function of Esam1 in hematopoiesis.
MATERIAL AND METHODS
Mice
Unless otherwise noted, experiments were performed using young adult (8–12 weeks old) C57BL/6-Thy1.1 mice. Mice null for Esam1 (Esam1−/− mice) were generated by gene targeted deletion and described previously [5]. Esam1−/− mice used for these experiments were backcrossed into a C57BL/6 background for >7 generations. Wildtype mice used as controls were strain, age and sex-matched from the same colony. All mice were maintained in Stanford University’s Research Animal Facility in accordance with Stanford University guidelines.
Flow Cytometry
Antibody staining and enrichment procedures for HSC, ST-HSC, MPP, CMP, GMP, MEP and CLP cell sorting and analyses were performed as previously described [2, 7–10]. Hematopoietic cell populations were derived from bone marrow isolated from murine femurs and tibias, unless otherwise noted. Human HSC from cord blood (Figure 1C) were purified as CD34+CD38−Lin−CD90+ cells (Supplemental Figure 1). Esam1 expression was analyzed from two independent CB samples, each performed in triplicate. Human HSC from BM were purified and analyzed by the same strategy with similar results (one independent sample analyzed in triplicate).
Figure 1. Esam1 is robustly and selectively expressed by HSC.
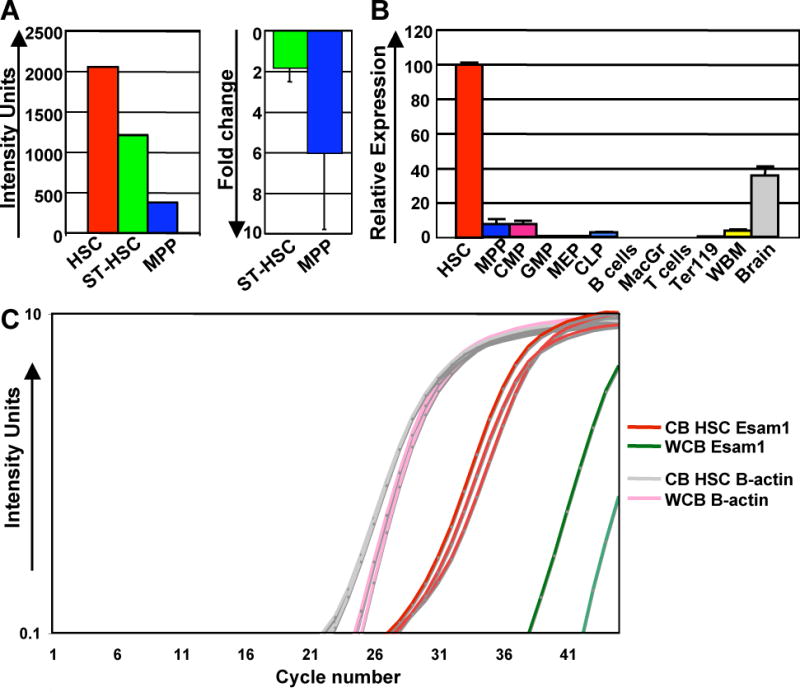
(A) Relative intensity units (left graph) and fold change relative to HSC expression levels (right graph) of Esam1 expression by cDNA microarray analysis of HSC (defined as c-kit+Lin−Sca1+Thy1.1loFlk2− BM cells), ST-HSC (defined as c-kit+Lin−Sca1+Thy1.1loFlk2+ BM cells) and MPP (defined as c-kit+Lin−Sca1+Thy1.1−Flk2+BM cells) [n=6]. (B) Esam1 expression levels in multiple hematopoietic BM populations by RT-qPCR. Data from one representative experiment with triplicate measurements is shown. Error bars indicate the standard deviation. HSC, hematopoietic stem cells; MPP, multipotent progenitors; CMP, common myeloid progenitors; GMP, granulocyte/monocyte progenitor; MEP, megakaryocyte/erythroid progenitor; CLP, common lymphoid progenitor; MacGr, Mac1+/Gr1+ myelomonocytic cells; Ter119, erythroid cells, WBM, unfractionated nucleated bone marrow cells; Brain, unfractionated adult brain cells. (C) Esam1 and β-actin expression levels in human cord blood HSC (CB HSC) (defined as CD34+CD38−Lin−CD90+) as compared to human whole cord blood (WCB) by RT-qPCR, performed in triplicate.
Two anti-Esam1 clones described previously [4] were used to identify Esam1-expressing cells. One clone was directly conjugated to the Alexa 488 fluorophore for cytometric analysis and sorting purposes. Cell sorting was performed on a triple-laser FACS Aria flow cytometer controlled by digital Diva electronics (Becton Dickinson). Each cell population was double sorted and reanalyzed to ensure maximum purity.
In vivo assays
Transplantations were performed by retro-orbital injection of double-sorted cell populations. Recipient mice were lethally irradiated (950 rad, delivered in split dose 3 hours apart) using an X-ray source irradiator and given antibiotic-containing water for at least 6 weeks post-irradiation. Peripheral blood was obtained from tail vein bleeding and collected in 4 ml of ACK (150 mM NH4Cl; 10 mM KHCO3) containing 10 mM EDTA for flow cytometry analysis.
In vitro assays
Colony forming assays in methylcellulose were performed as described previously [9] using the following cytokines: SCF (25 ng/ml), Flt3L (25 ng/ml), IL-11 (25 ng/ml), IL-3 (10 ng/ml), Tpo (25 ng/ml), Epo (2.5 U/ml) and GM-CSF (10 ng/ml) (Epo was purchased from R&D; all others from PeproTech).
Gene expression analysis
Total RNA was isolated using Trizol reagent (InVitrogen) from equivalent numbers of cells, digested with DNaseI to remove DNA contamination and used for reverse-transcription according to the manufacturer’s instructions (SuperScript II™ kit, InVitrogen). RT-qPCR primers were designed using Primer Express software (Applied Biosystems): mouse Esam1, Forward Primer: TGCCCACATTCTAGACCTCCA; Reverse Primer: CTCCTTTTGTCCTTTGACCCAG; Primers detecting both mouse and human Esam1 (used for detecting human Esam1 transcripts) Forward Primer: CCTGCCCTCACCAAGACTGC; Reverse Primer: ATCACAGGCACAGCACCCATG. All reactions were performed in an ABI-7000 sequence detection system using SYBR® Green PCR Core reagents and cDNA equivalent of ~200 cells per reaction as previously described [2, 9]. Expression of the β-actin gene was used to normalize the amount of the investigated transcript.
RESULTS
Esam1 is selectively expressed by hematopoietic stem cells
We previously identified Esam1 as differentially expressed on HSC (defined as c-kit+Lin−Sca1+Thy1.1loFlk2−BM cells) from C57BL6/Thy1.1 mice compared to ST-HSC (here defined as c-kit+Lin−Sca1+Thy1.1loFlk2+ BM cells) and MPP (c-kit+Lin−Sca1+Thy1.1−Flk2+ BM cells) by global gene expression analysis (Figure 1A and Forsberg et al [2]). This result was verified by RT-qPCR (Figure 1B and Forsberg et al [2]). To determine whether other cells in mouse BM express Esam1, we sorted multiple progenitor populations and mature cells representing the main hematopoietic lineages and analyzed these by RT-qPCR. Esam1 mRNA levels are highly enriched (14 fold or more) in HSC as compared to other BM cell populations and to unfractionated BM (Figure 1B).
To address whether Esam1 is expressed by human hematopoietic cells, we purified human HSC, defined as Lin−CD34+CD38−CD90+ cells, from umbilical cord blood (CB) (Supplemental Figure 1) and compared Esam1 transcript levels in human HSC to unfractionated CB (WCB). We detected robust levels of Esam1 transcripts in human HSC by RT-qPCR (Figure 1C). In contrast, the level of Esam1 transcripts was barely above the detection level in WCB mRNA (Figure 1C). Similar results were obtained with human BM HSC (data not shown). These data suggest that Esam1 may be a highly selective marker for both human and mouse HSC.
Esam1 Cell Surface Expression on mouse hematopoietic cell populations
We then assessed the cell surface expression of Esam1 protein using flow cytometry and a monoclonal antibody recognizing the extracellular portion of Esam1 [4]. While less than 2% of total BM cells were positive for Esam1, HSC uniformly displayed robust levels of cell surface Esam1 protein. HSC defined as c-kit+Lin−Sca1+Flk2− cells can be further divided based on CD34 expression; however, there was no difference in Esam1 cell surface protein levels between CD34+ and CD34− cells within this fraction (Supplemental Figure 2). Control stains of HSC from Esam1−/− mice confirmed the specificity of the antibodies for Esam1 (data not shown). Interestingly, Esam1 surface expression decreased as HSC differentiate into ST-HSC and MPP (Figure 2A). In agreement with this result, Esam1 expression correlates with the novel HSC marker Slamf1 (CD150) [2, 11, 12]. We found that all c-kit+Lin−Sca1+Slamf1+CD41− cells are also positive for Esam1 expression (Figure 2B). Hence, HSC defined by multiple surface markers robustly express Esam1 on the cell surface.
Figure 2. Cell surface Esam1 expression by hematopoietic stem and progenitor cells.
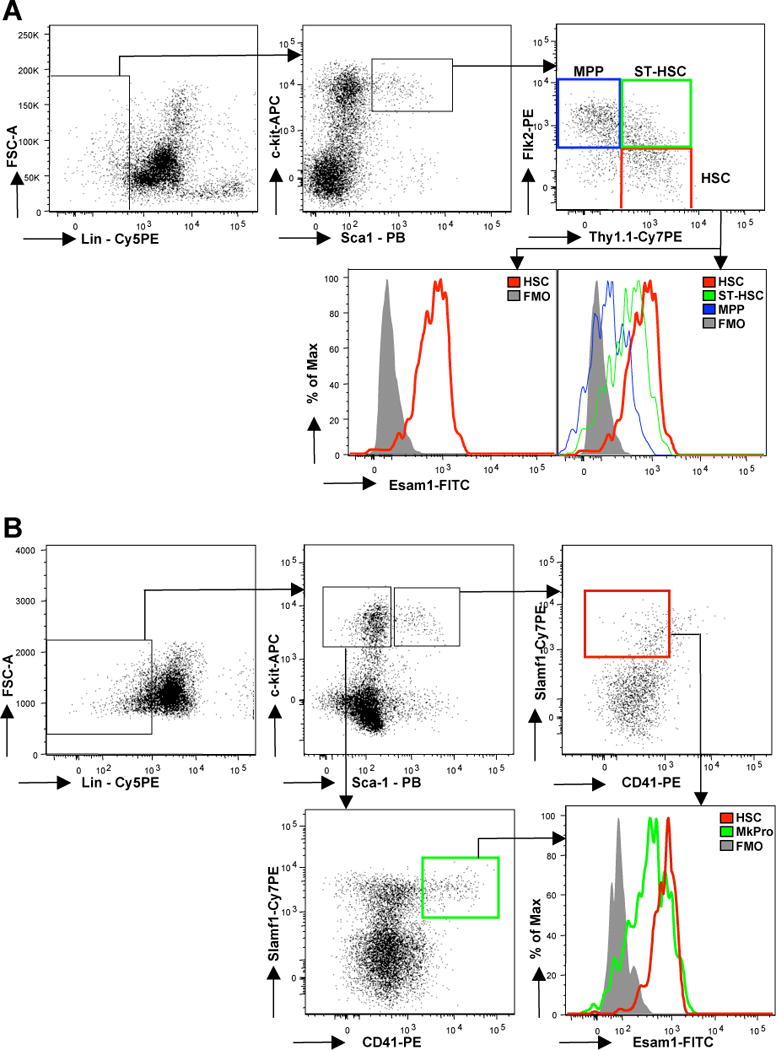
(A) Cell surface Esam1 protein expression by HSC, ST-HSC and MPP by flow cytometric analysis using an anti-Esam1 monoclonal antibody. Fluorescence minus one (FMO) without addition of the anti-Esam1 antibody is used as a negative control (grey histogram). (B) Esam1 cell surface expression on HSC compared to putative megakaryocyte progenitor cells (MkPro; c-kit+Lin−Sca1−Slamf1+CD41+ cells) as analyzed by flow cytometric analysis.
Specificity of Esam1 Surface Expression
The RT-qPCR data of multiple BM populations and the low frequency of cells in WBM expressing Esam1 on the cell surface suggested that Esam1 may be a highly specific marker for HSC. To explore the utility of Esam1 as a marker for HSC in murine BM we used the Esam1-specific antibody and flow cytometry to determine whether BM cells other than HSC express Esam1. We assayed Esam1 protein expression of multiple hematopoietic progenitor populations and the major mature lineages, specifically T cells, B cells, macrophages and granulocytes, as well as erythrocytes, by flow cytometry. In agreement with the qRT-PCR data, none of the populations in Figure 1B exhibited strong Esam1 expression (Supplemental Figure 3). In addition, very few (<1%) non-hematopoietic (Ter119−CD45−) BM cells, express Esam1 (data not shown). However, a small proportion of cells in the myeloid compartment exhibited low-level Esam1 expression (Supplemental Figure 3). As a previous study detected Esam1 on activated platelets [4], we hypothesized that these cells may be platelet progenitors. Indeed, megakaryocyte progenitors (Lin−c-kit+Sca1−Slamf1+CD41+ BM cells) display cell surface Esam1 expression (Figure 2B). Hence, in mouse BM, the cells that exhibit Esam1 surface expression are mainly megakaryocyte progenitors and HSC.
Universality of Esam1 as a HSC marker
As several of the currently used HSC markers are strain, age, or activation dependent [13–17], we tested the utility of Esam1 as a universal HSC marker during ontogeny and in different mouse strains. First, we analyzed Esam1 expression on HSC defined as c-kit+Sca1+Lin-Flk2-Thy1.1lo cells from C57BL6/Thy1.1 mice of different ages. We found that E15.5 fetal liver HSC, young adult (8–12 week old) and old (2 year old) BM HSC uniformly express high levels of cell surface Esam1 (Figure 3A), suggesting that Esam1 can be used as a universal HSC marker in fetal, young and old mice. In addition, as Esam1 expression correlates with Thy1.1 expression within the c-kit+Lin-Sca1+ fraction of BM (Figure 3B), Esam1 may be able to replace Thy1.1 in mouse strains that do not express this marker [18].
Figure 3. Esam1 expression by HSC is age- and strain-independent.
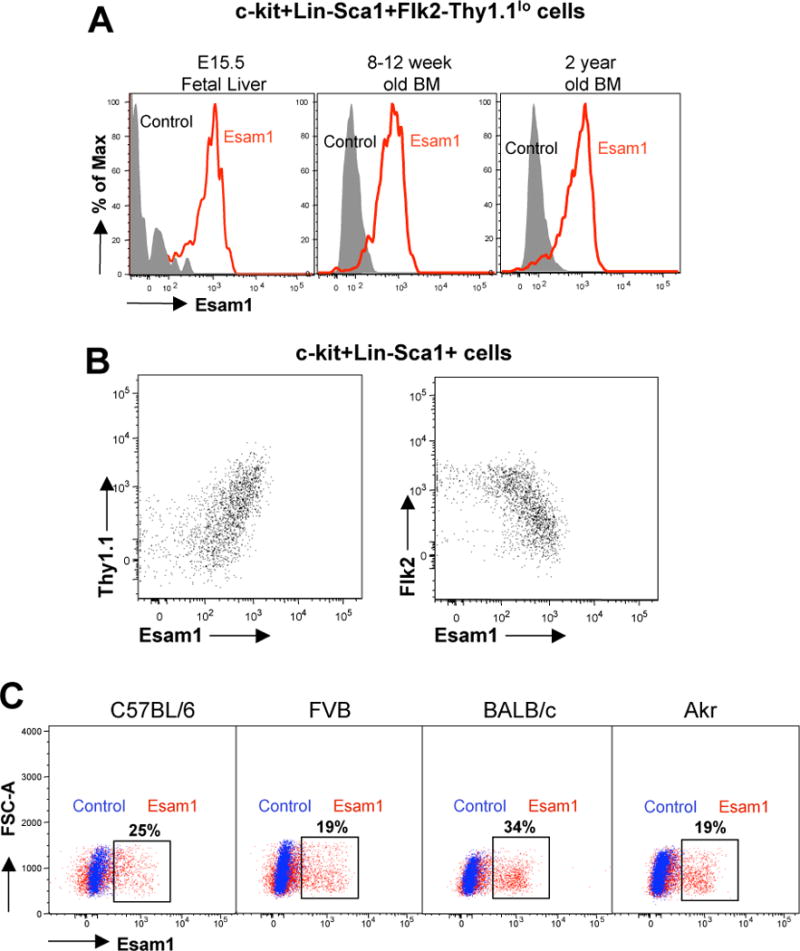
(A) Flow cytometric analysis of Esam1 cell surface protein in HSC (defined as c-kit+Lin−Sca1+Flk2−Thy1.1lo cells) from fetal liver (E15.5), young adult bone marrow (8–12 weeks old), and old adult bone marrow (2 years old) of C57BL/6 mice. (B) Correlation between Esam1 expression with Thy1.1 and Flk2 expression within the KLS (c-kit+Lin−Sca1+) population of C57BL/6 mice. Within the KLS population, Esam1+ cells are Thy1.1lo and Flk2−. (C) Esam1 expression on putative stem cells from different mouse strains. A similar proportion of HSC-enriched BM cells (c-kit+Slamf1+Flk2−Lin−) from the C57BL/6, FVB, BALB/c and AKR mouse strains are positive for Esam1 surface expression. Red, Esam1; Blue, FMO (Fluorescence minus one) control.
We also correlated Esam1 expression to current stem cell markers in several commonly used mouse strains. Although HSC are less well defined in non-C57BL/6 mice, HSC likely reside within the Lin−c-kit+Slamf1+Flk2− cell population of most mouse strains [1, 8, 12, 19]. As compared to C57BL/6 mice, AKR, FVB, and BALB/c mice exhibited a similar subset (19%–34%) of the Lin−c-kit+Slamf1+Flk2− cell population positive for Esam1 surface expression (Figure 3C). This suggests that Esam1 can be used a surface marker for HSC in multiple mouse strains.
Engraftment capability of HSC defined as Esam1+Lin−Sca1+ BM cells
The cell surface expression pattern of Esam1 described above suggests that high levels of Esam1 specifically mark HSC and that Esam1 expression may be substituted for one or more of the currently used HSC markers to increase the purity of HSC. Importantly, pregating Lin− cells on Esam1 enriches for c-kit+Slamf1+ cells 3–8-fold (Supplemental Figure 4). To directly test whether Esam1 expression selects for functional HSC, we compared the engraftment capability of cells defined by the Esam1+Lin−Sca1+ (ELS) surface phenotype versus cells isolated by the c-kit+Lin−Sca1+ (KLS) surface phenotype. Two hundred, 600 or 1800 double-sorted ELS or KLS cells from C57BL/6 mice were transplanted together with 2×10⁵ host type helper cells into lethally irradiated congenic mice. The peripheral blood of transplanted mice was analyzed every 4 weeks over a period of 16 weeks to determine donor/host chimerism as well as lineage composition of donor-derived mature blood cells. As expected, both ELS and KLS cells gave rise to strong donor chimerism (Figure 4A). Importantly, cells defined by the ELS surface phenotype demonstrated enhanced engraftment capabilities as reflected by higher total donor chimerism for equivalent cell numbers transplanted. For example, long-term donor chimerism upon transplantation of 200 ELS cells is ~3-fold higher than that of mice transplanted with 200 KLS cells, and similar to the levels in mice transplanted with 600 KLS cells (Figure 4A). The increased engraftment by ELS cells was highly statistically significant at the 200 cell dose. Although the statistical significance decreased with higher cell numbers, the trend toward higher chimerism was retained (Figure 4A). Thus, Esam1 is a more specific marker of long-term engrafting stem cells than c-kit, as predicted, since c-kit is also expressed on Sca1+ MPP.
Figure 4. Esam1 is a viable sort marker for functional HSC.
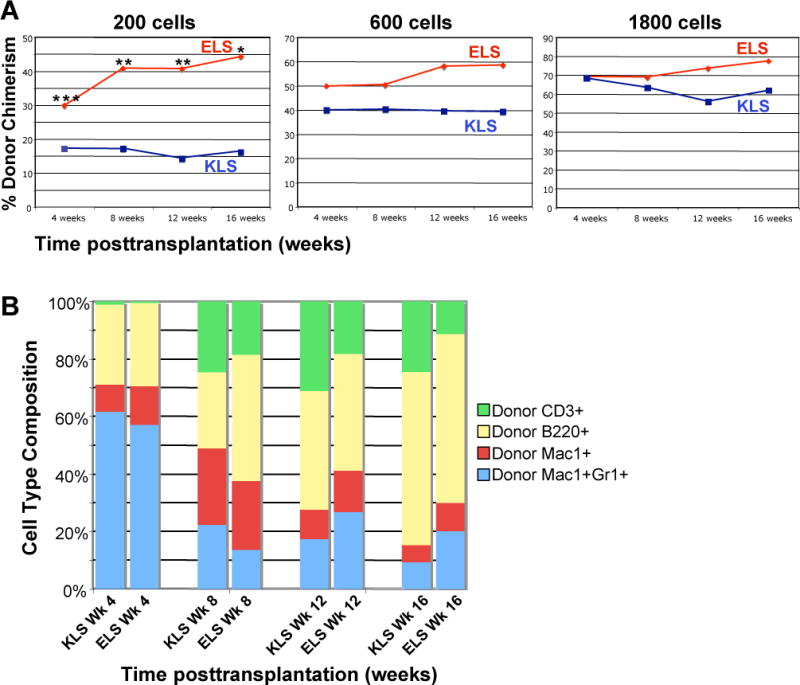
Lin−Sca1+ cells were sorted based on c-kit (blue, “KLS”) and Esam1 (red; “ELS”) expression. CD45.1 mice were transplanted intravenously with 200, 600 and 1800 KLS or ELS cells from congenic CD45.2 mice, together with 2×10⁵ host-type BM cells. The transplanted mice were analyzed for donor-derived mature cells in the peripheral blood every 4 weeks for a period of 16 weeks. Three independent experiments were performed for each cell phenotype and dose, representing at least nine mice per group. (A) ELS (Esam1+Lin−Sca1+) cells give higher total donor contribution as compared to the same numbers of KLS (c-kit+Lin−Sca1+) cells. (*, p<0.03; **, p<0.005; ***, p<0.002; Student’s t test) (B) Donor-derived peripheral cell type composition in mice transplanted with 600 ELS or 600 KLS cells. Over time, ELS cells give rise to a higher proportion of Mac1+ and Mac1+Gr1+ cells and a lower proportion of T cells.
To determine whether there was any skewing in lineage potential of transplanted cells defined as ELS compared to transplanted cells defined as KLS, we analyzed the lineage composition of donor-derived PB cells. By and large, cells defined as ELS and KLS surface expression gave rise to similar ratios of mature progeny. Over time, however, ELS cells gave rise to a higher percentage of myelomonocytic (Mac1+ and Mac1+Gr1+) cells and a lower percentage of T cells than did KLS cells (Figure 4B). These differences were observed for all three cell doses [200, 600 and 1800 cells] transplanted and were statistically significant at some of the time points and cell doses. In particular, transplantation of 1800 ELS cells gave rise to a significantly lower percentage of T cells at 12 weeks and 16 weeks after transplant, as compared to transplantation of 1800 KLS cells. As PB granulocyte chimerism is a reliable indicator of stem cell engraftment, this increased myelomonocytic readout is further evidence that Esam1 is a highly selective marker for long-term HSC. Accordingly, BM HSC chimerism analysis performed after the 16-week timepoint correlated well with the PB analysis (data not shown).
Biological Significance of Esam1 in HSC
To investigate the in vivo function of Esam1 in HSC, mice null for Esam1 (Esam1−/− mice) [5] were analyzed for effects on hematopoiesis. The Esam1−/− phenotype was previously shown to be mild; the mice are viable and fertile [5, 6]. However, Esam1−/− mice exhibit impaired pathological angiogenesis that decreases the tumor load in transplant models [5] and increases vascular permeability [6]. Here, we analyzed the frequency and number of distinct hematopoietic subpopulations in BM, spleen and thymus. As compared to wildtype mice, Esam1−/− mice exhibited no change in total cellularity, or in frequencies for multiple hematopoietic progenitor populations (ST-HSC, MPP, CMP, GMP, MEP, CLP) and mature cell populations (myelomonocytic cells, red cell precursors, B cells). Interestingly however, there is a small but reproducible 1.3 fold increase in the frequency of HSC (Figure 5A), and a 2.7 fold reduction in the number of CD3+ T cells in Esam1−/− BM (data not shown).
Figure 5. Effects of Esam1 deficiency on hematopoiesis.
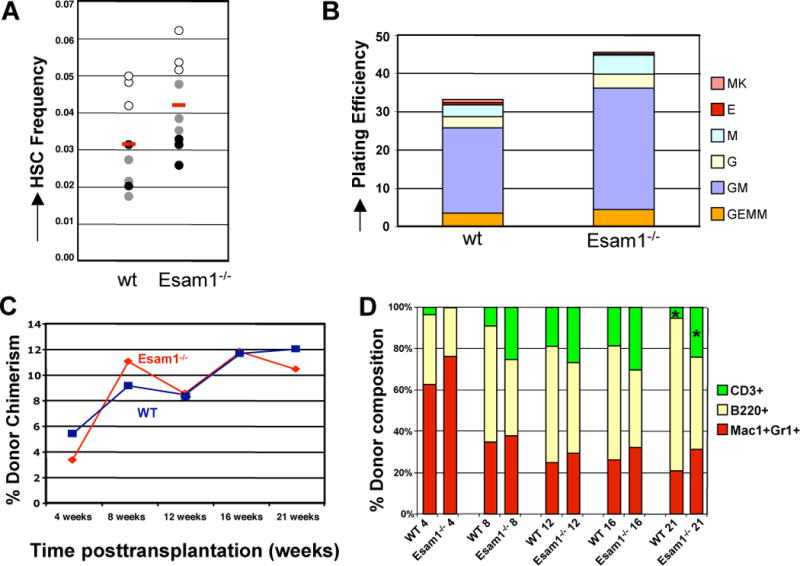
(A) Esam1-deficient mice have increased frequencies of BM HSC (Lin−c-kit+Sca1+Flk2− cells). The BM cell type composition of wildtype and Esam1-deficient C57BL/6 mice was analyzed by flow cytometry in three independent experiments with three mice in each group and experiment. Open circles indicate HSC frequency in experiment 1; grey circles, experiment 2; black circles, experiment 3; red bars, average HSC frequencies. (B) HSC-enriched BM cells (KLS) from Esam1-deficient mice display increased colony-forming frequency in vitro as compared to wildtype KLS cells. Data from one representative experiment performed in triplicate is shown. MK, megakaryocyte colony; E, erythroid; M, macrophage; G, granulocytic; GM, granulocyte-macrophage; GEMM, granulocyte/erythroid/macrophage/megakaryocyte (mixed). (C) Peripheral blood total donor chimerism in mice transplanted with 100 KLS cells from wildtype (n=10) or Esam1-deficient (n=6) mice. No statistically significant differences in total chimerism were observed. (D) Cell type composition of mice from (C). Over time, Esam1-deficient KLS cells give rise to a disproportionate number of T cells at the expense of B cells (*, p<0.03 at 21 weeks; Student’s t test).
We also compared Esam1−/− cells to wt cells by in vitro assays. KLS cells isolated from age-matched Esam1−/− mice gave rise to more and larger colonies than KLS cells from wildtype mice in methylcellulose colony assays (Figure 5B). The types of colonies formed by mutant and wildtype cells were similar. This enhanced in vitro proliferation of Esam1−/− HSC, together with the increase in HSC numbers in Esam1−/− mice, suggests that Esam1 may influence the balance between HSC proliferation and quiescence.
Engraftment Capacity of Esam1−/− HSC
To determine whether Esam1 affects HSC function in transplantation assays, we transplanted WBM and purified KLS cells from Esam1−/− mice into lethally irradiated, wildtype congenic recipients. The transplanted mice were assessed for long-term, multi-lineage engraftment by analysis of PB myelomonocytic, B and T cells. Total donor chimerism and granulocyte (Mac1+Gr1+ cells) chimerism were similar in mice transplanted with wt and mutant KLS (Figure 5C). However, transplantation of WBM from Esam1−/− mice gave rise to more progeny compared to the same number of WBM from wt mice (Supplemental Figure 5A), consistent with the increase in HSC frequencies observed in Figure 5A. In addition, KLS cells from Esam1−/− mice gave rise to a skewed T cell:B cell ratio, generating more T cells than B cells after transplantation, as compared to KLS cells from wildtype mice (Figure 5D). This lineage skewing increases over time and becomes statistically significant by 21 weeks posttransplantation (p<0.03, Figure 5D). A similar skewing of T cell:B cell progeny was observed when unfractionated BM from Esam1−/− mice was transplanted (Supplemental Figure 5B). This is particularly intriguing because the Esam1−/− mice exhibit lower numbers of CD3+ T cells in the BM, yet generate a higher ratio of T cells when transplanted into congenic recipients. Hence, Esam1 may influence HSC T cell and B cell differentiation decisions.
DISCUSSION
Our data demonstrate that Esam1 is a novel and highly specific marker for hematopoietic stem cells with long term repopulating activity in the mouse bone marrow. Esam1 expression is applicable for selection of HSC in the context of fetal, young and old mice, of human HSC, and likely in mice from different strains, specifically C57BL/6, AKR, FVB, and BALB/c. We show that Esam1 expression correlates with Thy1.1 expression and that the use of Esam1 expression leads to better enrichment of HSC than when using c-kit. Thus, Esam1 can be used instead of Thy1.1, c-kit and potentially other HSC markers to simplify and improve HSC isolation and purity. Functional analyses showed that deletion of Esam1 leads to increased steady-state HSC frequencies in vivo and to increased colony formation and growth in vitro. Esam1 disruption also leads to an increased ratio of T versus B cell generation in transplantation experiments. As Esam1 is not expressed by lymphoid-committed cells, this lineage skewing is likely exerted at the stem or multipotent progenitor cell stage. Interestingly, Esam1−/− mice appear to have fewer T cells as compared to wildtype mice. However, upon transplantation into a wildtype mouse, Esam1−/− KLS cells give rise to progeny cells with increased T:B cell ratios. This observed lineage skewing may indicate that Esam1-expressing BM cells influence HSC function. Collectively, these data suggest that Esam1 plays a role in the control of HSC proliferation and cell fate decisions.
HSC-selective cell surface molecules are critically important for the specific isolation of highly pure HSC. The use of combinations of viable markers has enabled separation of multiple, functionally distinct hematopoietic cell populations and yielded important insights on hematopoietic differentiation. Transplantation of single HSC from young, adult C57BL/6 mice give rise to long-term multilineage reconstitution with a frequency of 1 in 2 to 1 in 5 cells [12, 13, 20]. This remarkable feat has, essentially, proven the identity of a cell that fulfill all of the most rigorously stated criteria of a stem cell. However, rigorous HSC isolation is a complex process commonly involving combinations of 10–14 cell surface markers. In addition, many of the currently used markers are not universal and applicable to mice of different strains and ages. For example, Sca1 is not applicable as a cell surface marker in BALB/c mice or in humans [16]; CD34 expression can only be used to separate HSC from progenitor populations in mice older than 6 weeks [14]; c-kit cell surface levels decrease upon HSC mobilization [17]; and many of the most commonly used mouse strains do not express the Thy1.1 allele [18]. Hence, there is a need to expand the current repertoire of HSC markers to enable HSC studies in mice of different ages and different strains, and of human HSC.
We show that cells defined by the Esam1+Lin−Sca1+ surface phenotype are functional HSC that efficiently engraft an irradiated HSC niche. In comparison to the same numbers of c-kit+Lin−Sca1+ (KLS) cells, Esam1+Lin−Sca1+ (ELS) cells demonstrated stronger engraftment capabilities, via higher donor chimerism. Hence, the ELS population is more enriched for HSC as compared to the KLS population. This is in agreement with the more restricted expression of Esam1 compared to c-kit. While ~7–8% of total nucleated BM cells express c-kit (data not shown; Levesque et al [17]), approximately 2% express Esam1. Therefore, isolation based on Esam1 expression improves the purity of HSC compared to established HSC markers. As Esam1 is expressed by human HSC, by mouse HSC from several different strains, and on HSC from mice of various ages, Esam1 is a novel candidate marker capable of substituting less consistent markers under multiple conditions.
We observed relatively small, but reproducible effects on HSC function in the absence of Esam1. This is similar to the effects of Esam1 deficiency on endothelial cell function. While the vasculature in Esam1−/− mice is overtly normal, tumor and inflammation models revealed roles for Esam1 in angiogenesis and vascular permeability [5, 6]. Undoubtedly, other cell surface receptors and adhesion molecules play important roles in HSC function, and some of these previously identified proteins may partially compensate for the lack of Esam1. Importantly, however, our studies revealed that Esam1−/− mice have more HSC as compared to wildtype mice, even under steady-state conditions. In addition, Esam1−/− HSC exhibit greater proliferation capacity in vitro. These observations are consistent with Esam1 playing a role in the balance of HSC quiescence and proliferation. It will be interesting to determine whether deletion of Esam1 has more severe consequences under conditions of hematopoietic stress.
HSC-interacting BM cells likely play important roles in HSC function, particularly in the balance of quiescence versus proliferation and self-renewal versus differentiation. Esam1 and other cell surface proteins that are selectively expressed by HSC may mediate specific HSC-niche interactions. We previously noted that multiple components of cellular junction complexes are expressed selectively by HSC [2]. These include the tight junction protein Tjp1/ZO-1, the junction adhesion molecules Jam-A, Jam-B, and Jam-C; claudins 12 and 22; as well as the gap junction proteins Gja1 and Gjb5. The coordinate downregulation of cell junction proteins upon HSC differentiation suggests important, although as of yet unexplored, roles for these complexes specifically in HSC. For instance, differential expression and endocytosis may regulate the turnover of these proteins on the HSC surface. If HSC use these junction proteins to anchor to the niche, modulation of surface expression of these proteins may affect the residence time of the HSC in the niche, or impair HSC engraftment capability. If residence in the niche keeps the HSC in a quiescent state, one may also expect to see changes in the proliferative status of HSC, as suggested previously for other receptor molecules [21–24]. Thus, the increased proliferation of Esam1−/− HSC may relate to Esam1’s ability to function as an adhesion molecule, thereby influencing retention of HSC to a quiescence-supporting niche environment.
If Esam1 on HSC engage in homotypic interactions as is the case with endothelial cells, what is the identity of the HSC-interacting Esam1-expressing cell? As our study shows that Esam1 expression is highly selective within mouse BM, three options seem possible: 1) HSC-HSC interactions; 2) HSC-megakaryocyte progenitor interactions; or 3) HSC interactions with an Esam1+ stromal cell type that is either very rare or is not isolated as viable cells under the conditions used here. The first possibility, HSC-HSC interactions, is supported by the selective HSC expression of molecules engaging in homotypic interactions such as Esam1, N-cadherin, Slamf1, or by both partners capable of protein-protein interactions, for example Vcam1 and integrin α4β1. Interestingly, the two hematopoietic populations that were found to express Esam1, HSC and megakaryocyte progenitors, also express cell surface Slamf1. However, attempts to localize endogenous HSC in BM sections have not provided evidence for HSC clustering [12, 22–25]. Likewise, HSC colocalization with megakaryocyte progenitors remains possible, but unverified. In contrast, multiple studies have implicated functional roles for HSC interactions with stromal cell [22–24]. Our studies found that very few non-hematopoietic (CD45−Ter119−) cells (<1%; totaling ~0.01% of nucleated BM cells) express Esam1. Although rare, the frequency of these Esam1+ stromal cells is of the same order of magnitude as the frequency of HSC themselves. It will be interesting to determine whether any of the previously implicated HSC interacting cells also express Esam1. Such Esam1+ cells could potentially be HSC interacting partners that influence HSC location and thereby fate. The identity and function of HSC support cells will need to be tested, keeping in mind that one type of cell-cell contact does not necessarily rule out the possibility of the others, as these interactions may not be mutually exclusive. Future studies will aim at understanding the role of HSC interacting cells and the mechanisms of Esam1 and other receptors in regulating HSC biology.
Supplementary Material
Supplementary Figure 1: Purification of human HSC from cord blood. (A) Flow cytometry plots and gating strategy used for the purification of human HSC, defined as Lin−CD34+CD38−CD90+ cells, from cord blood. (B) Post-sort analysis of purified human HSC from panel A.
Supplementary Figure 2: Comparison of Esam1 cell surface expression on CD34+ and CD34− KLSF (c-kit+Lin−Sca1+Flk2−) cells from mouse BM.
Supplementary Figure 3: Analysis of Esam1 cell surface expression on defined hematopoietic subpopulations from mouse BM. (A) Flow cytometry plots and gating strategy used to assess Esam1 cell surface protein expression. Grey histograms, negative control stain (fluorescence minus one); red histograms, Esam1 expression. CMP, common myeloid progenitors; GMP, granulocyte/monocyte progenitor; MEP, megakaryocyte/erythroid progenitor; CLP, common lymphoid progenitor.
Supplementary Figure 4: Enrichment of putative HSC using Esam1 as a marker in different mouse strains. Esam1 strongly enriches for the putative HSC-containing c-kit+Slamf1+Lin− population in C57BL/6, FVB, BALB/c and AKR strains. The left column shows the c-kit versus Slamf1 profile for the Lin-cell population across four different mouse strains and the right column shows the c-kit versus Slamf1 profile for the Lin-Esam1+ cell population across the four different mouse strains as indicated. Adding Esam1 as a marker enriches for c-kit+Slamf1+Lin− cells in all strains examined.
Supplementary Figure 5: Peripheral blood chimerism in mice transplanted with 105 unfractionated mononuclear bone marrow cells from wildtype or Esam1-deficient mice. (A) Total donor chimerism. WBM cell from Esam1−/− mice give rise to slightly more progeny compared to WBM cells from wt mice. Differences were not statistically significant (p>0.05). (B) Cell type composition in mice from (A). By 21 weeks, mice transplanted with cells from Esam1-deficient mice gave rise to more T cells as compared to mice transplanted with cells from wildtype mice (*, p<0.008, Student’s t test).
Acknowledgments
AGLO is supported by the Singapore Agency for Science Technology and Research. ECF was a fellow of the Cancer Research Institute and NIH (grant 1F32 DK72620) and is now supported by a New Faculty Award from the California Institute of Regenerative Medicine (CIRM). This work was supported in part by NIH grants DK053074, CA086065, AI47458, CA86017 and a De Villier Award from the Leukemia and Lymphoma Society to ILW.
We thank T. Serwold for critical reading of the manuscript, L. Jerabek for superb lab management, C. Richter for antibody preparations and L. Hidalgo and B. Lavarro for animal care. I.L.W. has stock in Amgen and is a cofounder of Cellerant Inc. and Stem Cells Inc.
Footnotes
Author Contribution Summary:
AGLO: Conception and design, collection and assembly of data, data analysis and interpretation, manuscript writing, final approval of manuscript;
HK: Conception and design, collection and assembly of data, data analysis and interpretation, manuscript writing, final approval of manuscript;
RM: Collection of data, final approval of manuscript;
SB, DV, TI and TQ: Provision of study materials; final approval of manuscript;
ILW: Financial support, data analysis and interpretation, final approval of manuscript;
ECF: Conception and design, financial support, collection and assembly of data, data analysis and interpretation, manuscript writing, final approval of manuscript.
The other authors have no financial interests to disclose.
References
- 1.Spangrude GJ, Heimfeld S, Weissman IL. Purification and characterization of mouse hematopoietic stem cells. Science. 1988;241:58–62. doi: 10.1126/science.2898810. [DOI] [PubMed] [Google Scholar]
- 2.Forsberg EC, Prohaska SS, Katzman S, et al. Differential expression of novel potential regulators in hematopoietic stem cells. PLoS Genet. 2005;1:e28. doi: 10.1371/journal.pgen.0010028. [DOI] [PMC free article] [PubMed] [Google Scholar]
- 3.Hirata K, Ishida T, Penta K, et al. Cloning of an immunoglobulin family adhesion molecule selectively expressed by endothelial cells. J Biol Chem. 2001;276:16223–16231. doi: 10.1074/jbc.M100630200. [DOI] [PubMed] [Google Scholar]
- 4.Nasdala I, Wolburg-Buchholz K, Wolburg H, et al. A transmembrane tight junction protein selectively expressed on endothelial cells and platelets. J Biol Chem. 2002;277:16294–16303. doi: 10.1074/jbc.M111999200. [DOI] [PubMed] [Google Scholar]
- 5.Ishida T, Kundu RK, Yang E, et al. Targeted disruption of endothelial cell-selective adhesion molecule inhibits angiogenic processes in vitro and in vivo. J Biol Chem. 2003;278:34598–34604. doi: 10.1074/jbc.M304890200. [DOI] [PubMed] [Google Scholar]
- 6.Wegmann F, Petri B, Khandoga AG, et al. ESAM supports neutrophil extravasation, activation of Rho, and VEGF-induced vascular permeability. J Exp Med. 2006;203:1671–1677. doi: 10.1084/jem.20060565. [DOI] [PMC free article] [PubMed] [Google Scholar]
- 7.Akashi K, Traver D, Miyamoto T, et al. A clonogenic common myeloid progenitor that gives rise to all myeloid lineages. Nature. 2000;404:193–197. doi: 10.1038/35004599. [DOI] [PubMed] [Google Scholar]
- 8.Christensen JL, Weissman IL. Flk-2 is a marker in hematopoietic stem cell differentiation: a simple method to isolate long-term stem cells. Proc Natl Acad Sci U S A. 2001;98:14541–14546. doi: 10.1073/pnas.261562798. [DOI] [PMC free article] [PubMed] [Google Scholar]
- 9.Forsberg EC, Serwold T, Kogan S, et al. New evidence supporting megakaryocyte-erythrocyte potential of flk2/flt3+ multipotent hematopoietic progenitors. Cell. 2006;126:415–426. doi: 10.1016/j.cell.2006.06.037. [DOI] [PubMed] [Google Scholar]
- 10.Kondo M, Weissman IL, Akashi K. Identification of clonogenic common lymphoid progenitors in mouse bone marrow. Cell. 1997;91:661–672. doi: 10.1016/s0092-8674(00)80453-5. [DOI] [PubMed] [Google Scholar]
- 11.Kim I, He S, Yilmaz OH, et al. Enhanced purification of fetal liver hematopoietic stem cells using SLAM family receptors. Blood. 2006;108:737–744. doi: 10.1182/blood-2005-10-4135. [DOI] [PMC free article] [PubMed] [Google Scholar]
- 12.Kiel MJ, Yilmaz OH, Iwashita T, et al. SLAM family receptors distinguish hematopoietic stem and progenitor cells and reveal endothelial niches for stem cells. Cell. 2005;121:1109–1121. doi: 10.1016/j.cell.2005.05.026. [DOI] [PubMed] [Google Scholar]
- 13.Osawa M, Hanada K, Hamada H, et al. Long-term lymphohematopoietic reconstitution by a single CD34-low/negative hematopoietic stem cell. Science. 1996;273:242–245. doi: 10.1126/science.273.5272.242. [DOI] [PubMed] [Google Scholar]
- 14.Ito T, Tajima F, Ogawa M. Developmental changes of CD34 expression by murine hematopoietic stem cells. Exp Hematol. 2000;28:1269–1273. doi: 10.1016/s0301-472x(00)00535-x. [DOI] [PubMed] [Google Scholar]
- 15.Spangrude GJ, Brooks DM. Phenotypic analysis of mouse hematopoietic stem cells shows a Thy-1-negative subset. Blood. 1992;80:1957–1964. [PubMed] [Google Scholar]
- 16.Spangrude GJ, Brooks DM. Mouse strain variability in the expression of the hematopoietic stem cell antigen Ly-6A/E by bone marrow cells. Blood. 1993;82:3327–3332. [PubMed] [Google Scholar]
- 17.Levesque JP, Hendy J, Winkler IG, et al. Granulocyte colony-stimulating factor induces the release in the bone marrow of proteases that cleave c-KIT receptor (CD117) from the surface of hematopoietic progenitor cells. Exp Hematol. 2003;31:109–117. doi: 10.1016/s0301-472x(02)01028-7. [DOI] [PubMed] [Google Scholar]
- 18.Spangrude GJ, Muller-Sieburg CE, Heimfeld S, et al. Two rare populations of mouse Thy-1lo bone marrow cells repopulate the thymus. J Exp Med. 1988;167:1671–1683. doi: 10.1084/jem.167.5.1671. [DOI] [PMC free article] [PubMed] [Google Scholar]
- 19.van Os R, Kamminga LM, de Haan G. Stem cell assays: something old, something new, something borrowed. Stem Cells. 2004;22:1181–1190. doi: 10.1634/stemcells.2004-0095. [DOI] [PubMed] [Google Scholar]
- 20.Wagers AJ, Sherwood RI, Christensen JL, et al. Little evidence for developmental plasticity of adult hematopoietic stem cells. Science. 2002;297:2256–2259. doi: 10.1126/science.1074807. [DOI] [PubMed] [Google Scholar]
- 21.Arai F, Hirao A, Ohmura M, et al. Tie2/angiopoietin-1 signaling regulates hematopoietic stem cell quiescence in the bone marrow niche. Cell. 2004;118:149–161. doi: 10.1016/j.cell.2004.07.004. [DOI] [PubMed] [Google Scholar]
- 22.Sugiyama T, Kohara H, Noda M, et al. Maintenance of the hematopoietic stem cell pool by CXCL12-CXCR4 chemokine signaling in bone marrow stromal cell niches. Immunity. 2006;25:977–988. doi: 10.1016/j.immuni.2006.10.016. [DOI] [PubMed] [Google Scholar]
- 23.Calvi LM, Adams GB, Weibrecht KW, et al. Osteoblastic cells regulate the haematopoietic stem cell niche. Nature. 2003;425:841–846. doi: 10.1038/nature02040. [DOI] [PubMed] [Google Scholar]
- 24.Zhang J, Niu C, Ye L, et al. Identification of the haematopoietic stem cell niche and control of the niche size. Nature. 2003;425:836–841. doi: 10.1038/nature02041. [DOI] [PubMed] [Google Scholar]
- 25.Suzuki N, Ohneda O, Minegishi N, et al. Combinatorial Gata2 and Sca1 expression defines hematopoietic stem cells in the bone marrow niche. Proc Natl Acad Sci U S A. 2006;103:2202–2207. doi: 10.1073/pnas.0508928103. [DOI] [PMC free article] [PubMed] [Google Scholar]
Associated Data
This section collects any data citations, data availability statements, or supplementary materials included in this article.
Supplementary Materials
Supplementary Figure 1: Purification of human HSC from cord blood. (A) Flow cytometry plots and gating strategy used for the purification of human HSC, defined as Lin−CD34+CD38−CD90+ cells, from cord blood. (B) Post-sort analysis of purified human HSC from panel A.
Supplementary Figure 2: Comparison of Esam1 cell surface expression on CD34+ and CD34− KLSF (c-kit+Lin−Sca1+Flk2−) cells from mouse BM.
Supplementary Figure 3: Analysis of Esam1 cell surface expression on defined hematopoietic subpopulations from mouse BM. (A) Flow cytometry plots and gating strategy used to assess Esam1 cell surface protein expression. Grey histograms, negative control stain (fluorescence minus one); red histograms, Esam1 expression. CMP, common myeloid progenitors; GMP, granulocyte/monocyte progenitor; MEP, megakaryocyte/erythroid progenitor; CLP, common lymphoid progenitor.
Supplementary Figure 4: Enrichment of putative HSC using Esam1 as a marker in different mouse strains. Esam1 strongly enriches for the putative HSC-containing c-kit+Slamf1+Lin− population in C57BL/6, FVB, BALB/c and AKR strains. The left column shows the c-kit versus Slamf1 profile for the Lin-cell population across four different mouse strains and the right column shows the c-kit versus Slamf1 profile for the Lin-Esam1+ cell population across the four different mouse strains as indicated. Adding Esam1 as a marker enriches for c-kit+Slamf1+Lin− cells in all strains examined.
Supplementary Figure 5: Peripheral blood chimerism in mice transplanted with 105 unfractionated mononuclear bone marrow cells from wildtype or Esam1-deficient mice. (A) Total donor chimerism. WBM cell from Esam1−/− mice give rise to slightly more progeny compared to WBM cells from wt mice. Differences were not statistically significant (p>0.05). (B) Cell type composition in mice from (A). By 21 weeks, mice transplanted with cells from Esam1-deficient mice gave rise to more T cells as compared to mice transplanted with cells from wildtype mice (*, p<0.008, Student’s t test).