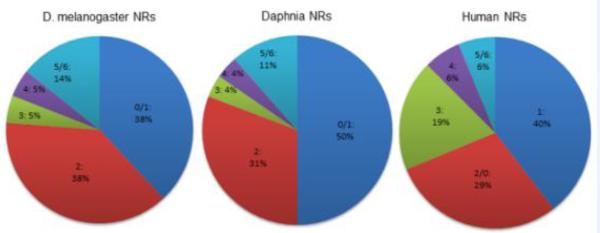
Fig 2. Comparison of nuclear receptor percentage in each subfamily for fruitly, Daphnia, and Humans.

The number before the colon represents the group number. The percentage after the colon represents the percent of total NRs is in that group for each species. For Daphnia and D. melanogaster, the knirps (0A) are grouped with Group 1, and in humans, the knirps (0B) are grouped with Group 2 because of phylogenetic determinations. For all species, Groups 5 and 6 are grouped together.
