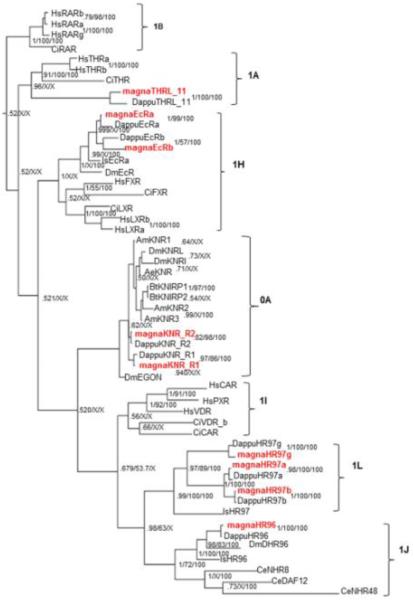
Fig 4. Phylogenetic relationship of nuclear receptors in groups NR1HIJLNAB and 0A.
NRs from different species were subjected to phylogenetic comparisons using Bayesian Inference, Maximum Parsimony, and Neighbor-Joining methods. The Bayesian tree is shown with posterior probabilities from the Bayesian tree, and bootstrap support values (frequency of occurrence) from the Neighbor-Joining and Maximum Parsimony trees, respectively. Probability values are separated by forward slashes at each corresponding node; an X indicates an area of disagreement from the Bayesian tree. Species included are D. pulex (Dappu), D. magna (magna), D. melanogaster (Dm), H. sapiens (Hs), I. scapularis (Is), C. elegans (Ce), C. intestinalis (Ci), B. terrestris (Bt), A. mellifera (Am), A. Aegypti (Ae), N. vitripennis (Nv), an M. occidentalis (Mo). All D. magna NRs are in red.

