Abstract
Aim:
To investigate whether alpha-lipoic acid (ALA) could attenuate the insulin resistance and metabolic disorders in high fat diet-fed mice.
Methods:
Male mice were fed a high fat diet (HFD) plus ALA (100 and 200 mg·kg−1·d−1) or HFD plus a positive control drug metformin (300 mg·kg−1·d−1) for 24 weeks. During the treatments, the relevant physiological and metabolic parameters of the mice were measured. After the mice were euthanized, blood samples and livers were collected. The expression of proteins and genes related to glucose metabolism in livers were analyzed by immunoblotting and real time-PCR.
Results:
HFD induced non-alcoholic fatty liver disease (NAFLD) and abnormal physiological and metabolic parameters in the mice, which were dose-dependently attenuated by ALA. ALA also significantly reduced HFD-induced hyperglycemia and insulin resistance in HFD-fed mice. Furthermore, ALA significantly upregulated the glycolytic enzymes GCK, HK-1 and PK, and the glycogen synthesis enzyme GS, and downregulated the gluconeogenic enzymes PEPCK and G6Pase, thus decreased glucose production, and promoted glycogen synthesis and glucose utilization in livers. Moreover, ALA markedly increased PKB/Akt and GSK3β phosphorylation, and nuclear carbohydrate response element binding protein (ChREBP) expression in livers. Metformin produced similar effects as ALA in HFD-fed mice.
Conclusion:
ALA is able to sustain glucose homeostasis and prevent the development of NAFLD in HFD-fed mice.
Keywords: alpha-lipoic acid, metformin, high fat diet, glucose metabolism, insulin resistance, hyperglycemia, non-alcoholic fatty liver disease, hepatic steatosis
Introduction
The liver is the primary organ responsible for regulating glucose homeostasis. In the fasting state, the liver uses glycogen stores to mobilize glucose and maintain blood glucose levels1,2. In addition, the liver obtains glucose through gluconeogenesis. Phosphoenolpyruvate carboxykinase (PEPCK) and glucose-6-phosphatase (G6Pase), which are involved in gluconeogenesis, also increase hepatic glucose production (HGP)3,4. All of these proteins are activated by glucogenic transcription factors such as the forkhead protein family (FoxA), hepatic nuclear factor (HNF) and peroxisome proliferator-activated receptor coactivator-1α (PGC-1α)5. In the postprandial state, glucokinase (GCK) and pyruvate kinase (PK) are glycolytic genes that are activated by insulin and carbohydrate responsive element-binding protein (ChREBP)6,7.
It is well known that insulin reduces the blood glucose level by decreasing hepatic gluconeogenesis and glycogenolysis, by enhancing glucose uptake into muscles and adipocytes, and by promoting adipocyte triglyceride stores8,9. However, hepatic insulin resistance leads to altered glucose metabolism and hyperglycemia. Insulin resistance of the hepatic tissue is the central pathogenic event of non-alcoholic fatty liver disease (NAFLD)10,11. In the hepatic tissue, insulin resistance directly disturbs glucose metabolism, and hyperinsulinemia and hyperglycemia result in hepatic steatosis and in the development of NAFLD12.
Alpha-lipoic acid (ALA), a naturally existing compound that acts as a coenzyme for pyruvate dehydrogenase and α-ketoglutarate dehydrogenase, plays a key role in bridging glycolysis and the citric acid cycle and regulates glucose and lipid metabolism13,14. Previous studies have demonstrated that ALA improves insulin sensitivity and repairs damaged glucose tolerance; administration of ALA also resulted in decreased weight and decreased food intake in animal models15. When rats are given ALA, there is increased insulin-stimulated glucose disposal in the entire body and in the skeletal muscle16. The main aim of our study was to investigate whether ALA could improve insulin resistance and glucose metabolism in high-fat diet-induced NAFLD mice. The results of the present study demonstrated that ALA improved insulin sensitivity and impaired glucose tolerance and that ALA has an especially good capacity for improving insulin-signaling pathways.
Materials and methods
Animal experiments
All of the animal experiments were approved by the Animal Research Committee of Ningxia Medical University. Six-week-old male C57BL/6J mice were purchased from the Beijing Vital River Biological Co, Ltd and maintained in standard cage conditions with a 12/12 light/dark cycle. All of the mice were fed a normal diet and water for 2 weeks before being divided into five groups (n=15 per group): low-fat diet (LFD); high-fat diet (HFD); HFD+low-dose ALA (100 mg·kg−1·d−1, po); HFD+high-dose ALA (200 mg·kg−1·d−1, po); and HFD+metformin (300 mg·kg−1·d−1, po). The low-fat diet included 10% kcal as fat, with an energy density of 3.85 kcal per gram, whereas the high-fat diet included 60% kcal as fat, with an energy density of 5.24 kcal per gram. The food and medications were purchased from Research Diets (Research Diets Inc, New Brunswick, NJ, USA). The body weight, water and food intake were monitored each week. The blood glucose level was measured every three weeks. All of the mice were euthanized at 24 weeks; blood samples were collected and centrifuged at 3000 r/min for 15 min at 4 °C and then stored at −80 °C. The liver tissue was isolated; one sample was prepared for RNA isolation and the analysis of gene expression, and the second sample was frozen in liquid nitrogen and stored at −80 °C.
Intraperitoneal injection glucose and insulin tolerance test (IPGTT/IPITT)
IPGTTs and IPITTs were performed after the mice were fed their respective diets for 13 or 24 weeks. The mice (n=6 per group) were fasted for 8 h prior to testing. For the IPGTT, glucose (2 g/kg) was injected intraperitoneally at time 0. For the IPITT, insulin (0.75 IU/kg) was also injected intraperitoneally at time 0. Blood samples from the tail vein were directly measured using a glucometer (Accu-Chek, Roche Diagnostics) at 30, 60, and 120 min.
Glycogen content
The glycogen content of the liver was measured using a Glycogen Assay Kit (Nanjing Jiancheng Bioengineering Institute, China) according to the manufacturer's instructions.
Glucose production assay
The glucose production in the liver was measured using a glucose oxidase kit (Applygen Technologies Inc, China) according to the manufacturer's instructions.
Enzyme activity assays
Liver glucokinase (GCK), pyruvate kinase (PK) and succinate dehydrogenase (SDH) activities were measured using the Assay Kit (Nanjing Jiancheng Bioengineering Institute, China) according to the manufacturer's instruction.
Western blot
The total proteins and nuclear proteins were extracted using the Protein Extraction Kit (Applygen Technologies Inc, China). The samples were centrifuged at 12 000×g for 15 min at 4 °C. The supernatant was collected for analysis. The proteins were quantified using the BCA method (Sigma, St Louis, MO, USA). Protein (50 μg) was added to 10% SDS-PAGE and then transferred to PVDF membranes (Pall Corporation, Pensacola, FL, USA). We used the following primary antibodies: Akt (pSer473) (1:1000), Akt (1:1000), Lamin B (1:2000) (Cell Signaling Technology, Danvers, MA, USA), GSK3β (pSer9) (1:200), GSK3β (1:200), ChREBP (1:200), β-actin (1:1000) (Santa Cruz Biotechnology, Santa Cruz, USA). We used the secondary antibodies goat anti-rabbit or mouse IgG-HRP (1:4000) (Santa Cruz Biotechnology, Santa Cruz, USA). Immunoblotting was conducted with enhanced chemiluminescence (Pierce Biotechnology, Rockford, IL, USA). The band intensities were scanned (ImageJ software, Bethesda, Maryland, USA).
RNA isolation and quantitative real-time PCR
The total RNA was isolated from the liver of each mouse using TRIzol reagent (Invitrogen, USA). The RNA concentrations were determined by SmartSpec™ Plus (BIO-RAD, Hercules, CA, USA). One microgram of total RNA was transcribed to cDNA using the superscript first-strand synthesis kit (Thermo, USA) following the manufacturer's instructions. The qRT-PCR analysis was performed using the SYBR Green detection PCR Core Reagents Kit. The primers for GCK, HK1, PK, PEPCK, G6Pase, and cyclophilin have been previously described17,18. The other primers were as follows: GS (forward, 5′-TACCGGTCACCAAGTCTGCT-3′ reverse, 5′-AATCCTGGAAGCGAGGACAC-3′) and CS (forward, 5′-TGGTCCCAGGATACGGTCAT-3′ reverse, 5′-TTGTACAGCTGAGCCACCAG-3′). The samples were incubated in the light cycler apparatus for an initial denaturation at 95 °C for 10 min, followed by 40 cycles. Each cycle consisted of 95 °C for 15 s, 58 °C for 7 s, and 72 °C for 15 s. PCR reactions were performed in triplicate and normalized to housekeeping genes (Cyclophilin) using the 2−ΔΔCt method.
Histological and biochemical analysis
Paraffin-embedded liver sections were stained with periodic acid-Schiff, hematoxylin and eosin. The assessment of NAFLD was previously described19. The serum insulin level was measured using a mouse ELISA kit (CUSABIO) according to the manufacturer's instructions.
Statistical analysis
All of the values were obtained as the mean±SEM. The statistical analysis was performed using the ANOVA and SNK multiple-range tests (SPSS 13.0). P<0.05 was considered statistically significant.
Results
Effect of ALA on physical metabolism variables in HFD-fed mice
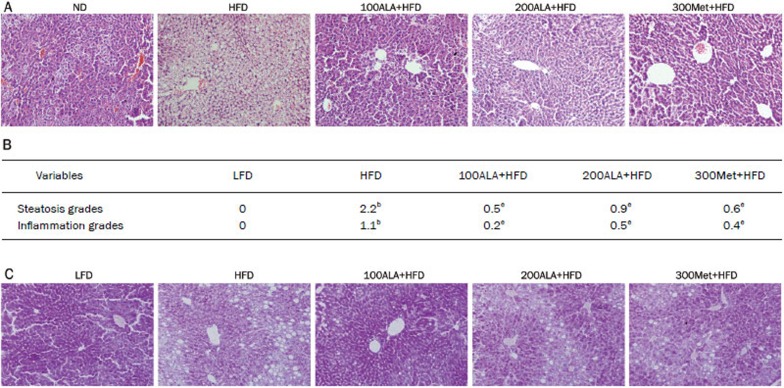
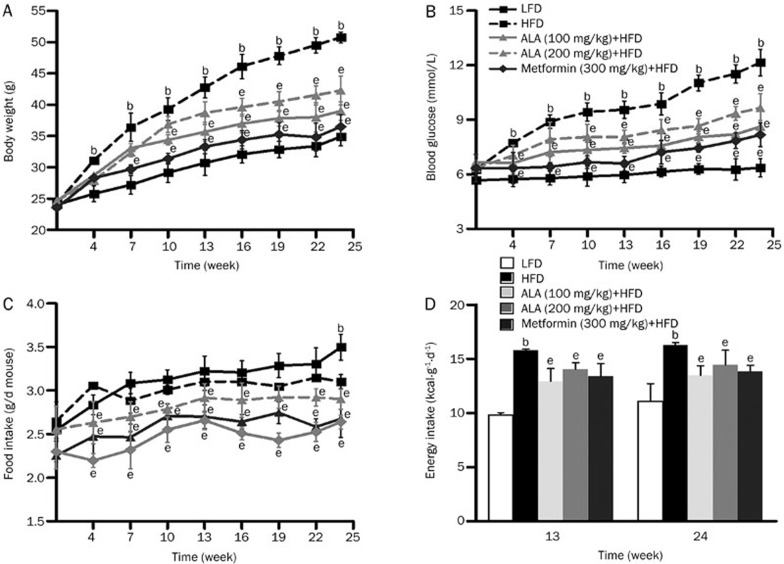
As expected, the results showed that the established HFD-induced NAFLD mice model was successful and ALA significantly prevented NAFLD development (P<0.05) (Figure 1A and 1B). The ALA-administered mice had reduced body weight, liver weight, blood glucose level, water intake, BMI and abdominal circumference compared with the HFD-fed mice (all P<0.05) (Figure 2A, 2B, and Table 1). The decrease in body weight in the ALA-administered mice was similar to the results of previous studies. In terms of dietary and energy intake, the ALA-administered mice had some differences from the HFD-fed mice at 13 or 24 weeks (Figure 2C and 2D, P<0.05). Taken together, the above results demonstrate that ALA has a great effect on the overall health of HFD-fed mice.
Figure 1.
Effect of ALA on histology analysis of liver tissue. (A) Representative hematoxylin and eosin (H&E) staining of a liver tissue sample (magnification 200×). (B) Liver sections of HFD-induced NAFLD were analyzed for steatosis and inflammation. bP<0.05 vs LFD. eP<0.05 vs HFD. (C) Representative periodic acid-Schiff (PAS) staining of liver tissue (magnification 200×).
Figure 2.
Effect of ALA on physiological variables. (A) Body weight, (B) blood glucose and (C) food intake of the mice (n=8–10 per group) were examined every 3 weeks. (D) Energy intake of the mice (n=8–10 per group) was measured at 13 and 24 weeks. Mean±SEM. bP<0.05 vs LFD. eP<0.05 vs HFD.
Table 1. Laboratory data of mice treated with 24 weeks. Mean±SEM (n=10 per group). bP<0.05 vs LFD group. eP<0.05 vs HFD group.
| Variables | LFD | HFD | 100ALA+HFD | 200ALA+HFD | 300Met+HFD |
|---|---|---|---|---|---|
| Primary body weight (g) | 23.18±0.23 | 23.87±0.29 | 23.81±0.23 | 23.40±0.29 | 23.43±0.30 |
| Final body weight (g) | 31.00±0.46 | 50.05±1.01b | 41.25±1.63e | 37.50±1.43e | 35.00±0.53e |
| Liver weight (g) | 1.06±0.04 | 1.91±0.18b | 1.42±0.21e | 1.25±0.05e | 1.33±0.05e |
| BMI (g/cm2) | 0.32±0.07 | 0.58±0.10b | 0.41±0.13e | 0.37±0.09e | 0.39±0.11e |
| Abdominal circumference (cm) | 7.63±0.13 | 9.83±0.08b | 8.43±0.37 | 7.98±0.14e | 7.50±0.14e |
| Water intake (mL/d) | 6.97±0.16 | 7.87±0.17b | 6.87±0.19 | 6.26±0.05e | 6.52±0.14e |
LFD, low-fat diet, negative control group; HFD, high fat diet; 100ALA+HFD, high fat diet plus (100 mg/kg) alpha-lipoic acid; 200ALA+HFD, high fat diet plus (200 mg/kg) alpha-lipoic acid; 300Met+HFD, high fat diet plus (300 mg/kg) metformin, positive control group.
Effect of ALA on glucose and insulin tolerance in HFD-fed mice
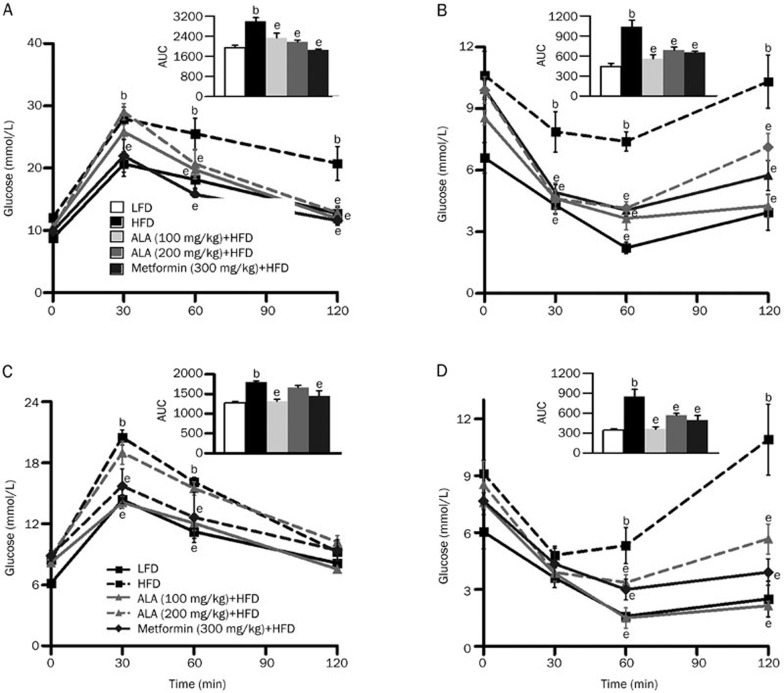
Furthermore, to evaluate the functional effect of long-term ALA administration on whole-body glucose metabolism, we conducted an intraperitoneal glucose tolerance test (IPGTT) in each group. Two representative IPGTTs performed at 13 or 24 weeks are presented in Figure 3A and 3C. Compared with the HFD-fed group, the ALA-administered mice exhibited a significant reduction in blood glucose after injection at 1 h and 30 min in weeks 13 and 24, respectively (P<0.05). The area under the curve (AUC) also demonstrates these results (P<0.05). To determine whether ALA reduced HFD-induced insulin resistance, we also compared the results of an intraperitoneal insulin tolerance test (IPITT) among the groups at 13 or 24 weeks. ALA administration enhanced insulin-mediated glucose-lowering effects 30 min and 1 h after injection in weeks 13 and 24, respectively (P<0.05) (Figure 3B and 3D). The AUC clearly demonstrates this point (P<0.05). We measured the blood glucose and insulin levels at 13 or 24 weeks. As shown in Table 2, ALA reduced insulin resistance, decreased blood glucose levels (P<0.05, P<0.01) and significantly improved the HOMA index (P<0.05, P<0.01).
Figure 3.
Effect of ALA on glucose and insulin tolerance. (A and C) Intraperitoneal injection glucose tolerance test (IPGTT) of 13 or 24-week-old HFD-fed mice relative to ALA or metformin-administered mice (n=6 per group). Inset: The IPGTT is shown as the area under the curve (AUC). (B and D) Intraperitoneal injection insulin tolerance test (IPITT) of 13 or 24-week-old HFD-fed mice relative to ALA or metformin-administered mice (n=6 per group). Inset: The IPITT is shown as the AUC. Mean±SEM. bP<0.05 vs LFD. eP<0.05 vs HFD.
Table 2. Measured parameters of mice in 13 week and 24 week. Mean±SEM. n=6 per group. bP<0.05, cP<0.01 vs LFD group. eP<0.05, fP<0.01 vs HFD group.
| Parameters | LFD | HFD | 100ALA+HFD | 200ALA+HFD | 300Met+HFD | |
|---|---|---|---|---|---|---|
| 13 week | Blood glucose (mmol/L) | 5.81±0.42 | 9.85±0.46b | 7.63±0.10e | 8.05±0.52 | 7.45±0.42e |
| Serum insulin (mIU/L) | 5.98±1.13 | 12.7±2.69b | 8.16±0.53e | 8.90±0.52e | 7.71±0.50e | |
| HOMA-IR | 1.50±0.18 | 5.65±1.47b | 2.75±0.23e | 3.21±0.46e | 2.53±0.31e | |
| 24 week | Blood glucose (mmol/L) | 5.97±0.11 | 11.86±0.73b | 7.92±1.36e | 8.65±0.70e | 8.01±0.42e |
| Serum insulin (mIU/L) | 6.71±0.29 | 23.78±3.61c | 8.99±0.98f | 14.94±1.71e | 10.62±1.32e | |
| HOMA-IR | 1.75±0.05 | 12.1±2.37c | 3.18±0.55f | 5.71±0.63e | 3.66±0.24f | |
HOMA-IR=glucose (mmol/L)×insulin (mlU/L)/22.5.
ALA increases the expression of ChREBP and phopho-GSK3β via modulation of the insulin-signaling pathway
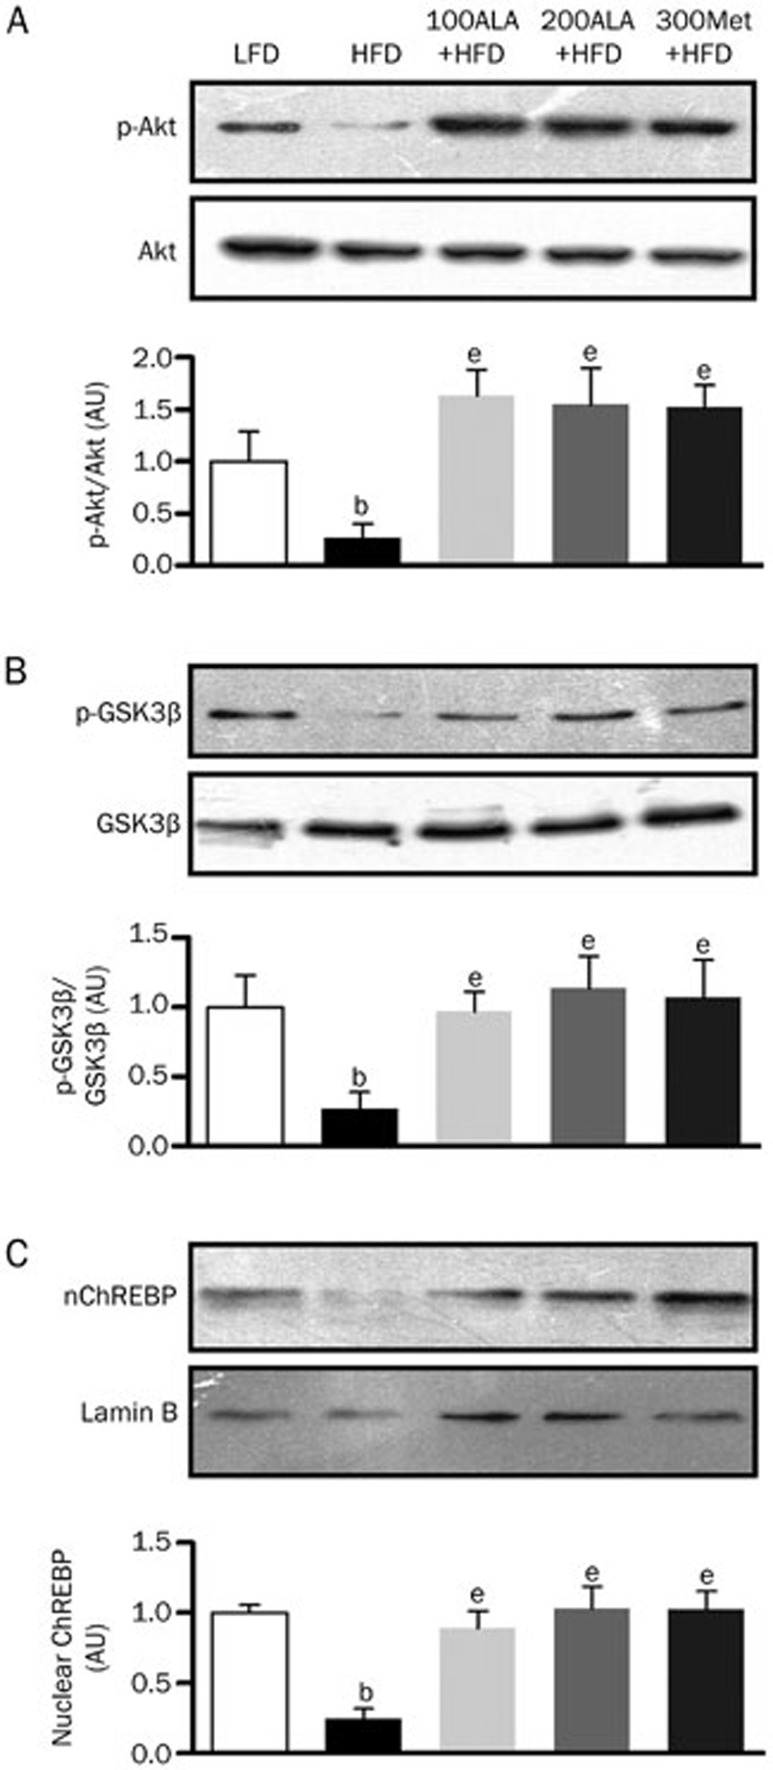
Although the induction of a long-term high-fat diet results in insulin resistance and NAFLD, the specific signaling pathways involved in insulin resistance are not completely undertood11,20. Akt is a key molecule in insulin signaling and glucose metabolism. We hypothesized that Akt was involved in ALA-mediated glucose metabolism. To confirm this hypothesis, we initially investigated the effect of ALA on Akt phosphorylation in HFD-fed mice. In the present study, our results showed that ALA strongly increased Akt phosphorylation levels and enhanced GSK3β phosphorylation in HFD-induced NAFLD mice (P<0.05) (Figure 4A and 4B). The nuclear protein expression of ChREBP was increased in the ALA-administered groups (P<0.05) (Figure 4C).
Figure 4.
ALA induces the phosphorylation of Akt and GSK3β and nuclear ChREBP expression. (A) Phospho-Akt, (B) phospho-GSK3β and (C) nuclear ChREBP levels in the liver tissue samples were analyzed by Western blot. bP<0.05 vs LFD. eP<0.05 vs HFD.
ALA significantly mediates gene expression levels of the key rate-limiting enzyme involved in glucose metabolism
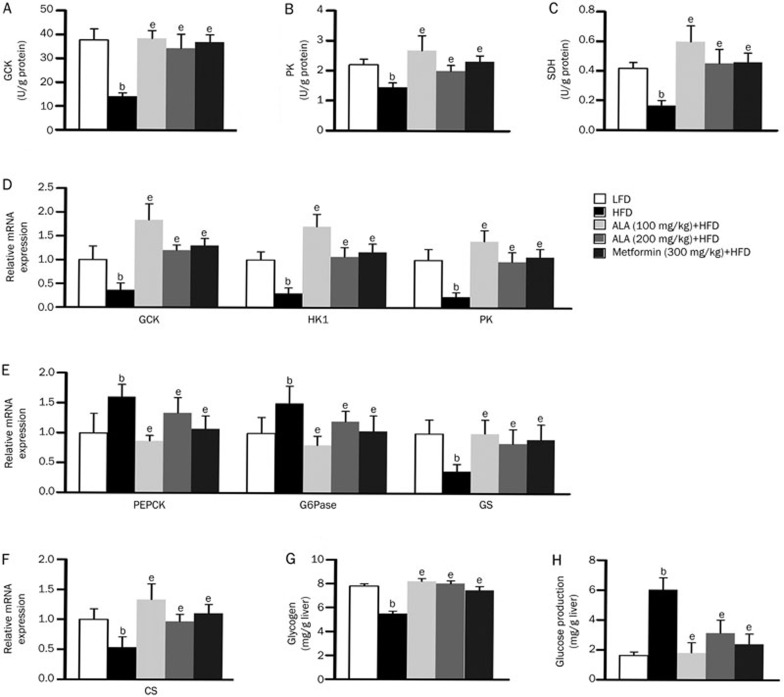
To further gain insight into the effect of ALA on glycolysis, gluconeogenesis and glycogen synthesis, we analyzed the mRNA expression levels of glucose metabolism-related genes using real time quantitative PCR. Compared with the HFD group, ALA markedly increased glycolytic gene activity levels and expression levels (P<0.05) (Figure 5A, 5B, and 5D). Conversely, the expression levels of gluconeogenic genes were lower than those of the HFD-fed mice (P<0.05, Figure 5E). The ALA-administered group showed elevated GS expression and increased glycogen production in the liver tissue (P<0.05, Figure 5E and 5G). The PAS staining also prompted increased glycogen production in the liver tissue of the ALA-administered group (Figure 1C). In the ALA-administered groups, the SDH activity and CS expression levels of the citric acid cycle were much higher than in the HFD-fed group (P<0.05) (Figure 5C, 5F). In the present study, the ALA-administered group showed reduced hepatic glucose production capacity (P<0.05) (Figure 5H).
Figure 5.
ALA improves gene expression involved in glucose metabolism. (A–C) Glucokinase (GCK), pyruvate kinase (PK) and succinate dehydrogenase (SDH) activities of the liver. The data are expressed as the mean±SEM (n=6 per group). bP<0.05 vs LFD. eP<0.05 vs HFD. (D–F) Relative mRNA expression of GCK, hexokinase (HK1), PK, phosphoenolpyruvate kinase (PEPCK), glucose-6-phosphatase (G6Pase), glycogen synthase (GS) and citrate-synthase (CS). bP<0.05 vs LFD. eP<0.05 vs HFD. (G) Glycogen content of the liver (mg/g protein) and (H) glucose production (mmol/g protein). The data are expressed as the mean±SEM (n=8 per group). bP<0.05 vs LFD. eP<0.05 vs HFD.
Discussion
NAFLD is currently considered the main hepatic manifestation of insulin resistance and metabolic disorder21. Chronic overnutrition and excess energy accumulation in hepatocytes trigger signals that generate insulin resistance22. Moreover, the deleterious effect of glucose accumulation aggravates NAFLD deterioration23. In the present study, the main purpose was to investigate whether ALA plays a key role in glucose metabolism in HFD-induced NAFLD mice models. Several studies have been performed with the aim of demonstrating that ALA regulates whole-body glucose and glucose uptake and improves tolerance test performance24,25. We demonstrated that ALA had the same metabolic action upon the mice, such as improved body composition, glucose and insulin tolerance. Furthermore, ALA significantly mediated glycolysis, gluconeogenesis and glycogen in the livers of HFD-induced NAFLD mice. We provided novel evidence that ALA might improve glucose metabolism via the modulation of key molecules such as ChREBP and GSK3β.
Metformin is used in the treatment of type 2 diabetes and has been investigated for other diseases in which insulin resistance might be an important factor, such as NAFLD26. In the present study, we used metformin as a positive control drug during the experiment. We found that the metformin-administered group showed improved whole-body glucose levels and impaired intolerance tests. We also determined that metformin prevented the development of NAFLD and mediated the molecular mechanism involved in glucose metabolism. As shown in Figure 1 through 5, these results suggest that there is no significance between the metformin-administered group and the ALA-administered group. However, the changes in the blood glucose levels showed that metformin treatment was more conducive to reducing glucose concentrations than was ALA treatment, especially at 19–24 weeks. Furthermore, the intraperitoneal insulin tolerance test suggested that ALA treatment better enhances insulin-stimulated glucose lowering effect at 1 h after injection than does metformin treatment. Taken together, our study demonstrated that metformin might be effective for reducing blood glucose and promoting glucose uptake and utilization and that ALA might be effective for improving insulin sensitivity and activating insulin-signaling pathways.
The target molecule of Akt is a protein kinase that guides glucose metabolism via mediating insulin signaling12. When insulin resistance arises, insulin signaling is suppressed. Our results demonstrated that ALA was capable of activating Akt phosphorylation. Studies have reported that there are many transcription factors involved in glucose metabolism, such as ChREBP and GSK327. ChREBP is a basic transcription factor that plays a critical role in glycolysis and fatty acid synthesis. Previous studies confirmed that ChREBP induces the GCK and PK in hepatocytes28,29. In the HFD-fed mice, we found that ALA increased the nuclear protein expression of ChREBP and significantly increased the GCK and PK mRNA levels. ChREBP deficiency triggers impaired glucose tolerance and insulin resistance in C57BL/6J mice30, whereas ChREBP knockdown improves hepatic steatosis and insulin resistance in ob/ob mice31. GSK3α and GSK3β have a large effect on glycogen metabolism. Upregulating GSK3 expression induces glycogen synthase (GS) phosphorylation and prevents glycogen production32. Our results indicated that ALA significantly increased GS mRNA levels and hepatic glycogen production. ALA also significantly lowered PEPCK and G6Pase mRNA expression and increased citrate synthase (CS) mRNA expression in the livers of the HFD-fed mice; therefore, ALA reduced hepatic glucose production (HGP) and accelerated hepatic glucose output.
The current study demonstrated that ALA enhances hepatic insulin sensitivity and prevents the development of NAFLD; furthermore, ALA ameliorates glucose metabolism by modulating the insulin-signaling pathway. Overall, ALA facilitates the liver's capacity for glucose production and glucose utilization and might be effective in decreasing whole-body glucose catabolism in HFD-fed mice.
Author contribution
Yi YANG and Ling GAO conceived of the experiments, and Wang LI conducted the experiments. Yan LI analyzed the data. Jia-jun ZHAO was responsible for the paper. All of the authors were involved in writing the paper and had final approval of the submitted and published versions of the paper.
Abbreviation
ALA, Alpha-lipoic acid; AUC, Area under the curve; ChREBP, Carbohydrate responsive element-binding protein; CS, Citrate synthase; FoxA, Forkhead protein family; GCK, Glucokinase; G6Pase, Glucose-6-phosphatase; GS, Glycogen synthase; GSK3β, Glycogen synthase kinase 3β HFD, High-fat diet; HGP, Hepatic glucose production; HK, Hexokinase; HNF, Hepatic nuclear factor; IPGTT, Intraperitoneal glucose tolerance test; IPITT, Intraperitoneal insulin tolerance test; LFD, Low-fat diet; NAFLD, Non-alcoholic fatty liver disease; PEPCK, Phosphoenolpyruvate carboxykinase; PK: Pyruvate kinase; PKB, Protein kinase B; PGC-1α, Peroxisome proliferator-activated receptor coactivator-1α SDH, Succinate dehydrogenase.
Acknowledgments
This study was supported by the National Natural Science Foundation of China (No 81160103).
References
- Radziuk J, Pye S. Hepatic glucose uptake, gluconeogenesis and the regulation of glycogen synthesis. Diabetes Metab Res Rev. 2001;17:250–72. doi: 10.1002/dmrr.217. [DOI] [PubMed] [Google Scholar]
- Ramnanan CJ, Saraswathi V, Smith MS, Donahue EP, Farmer B, Farmer TD, et al. Brain insulin action augments hepatic glycogen synthesis without suppressing glucose production or gluconeogenesis in dogs. J Clin Invest. 2011;121:3713–23. doi: 10.1172/JCI45472. [DOI] [PMC free article] [PubMed] [Google Scholar]
- Burgess SC, He T, Yan Z, Lindner J, Sherry AD, Malloy CR, et al. Cytosolic phosphoenolpyruvate carboxykinase does not solely control the rate of hepatic gluconeogenesis in the intact mouse liver. Cell Metab. 2007;5:313–20. doi: 10.1016/j.cmet.2007.03.004. [DOI] [PMC free article] [PubMed] [Google Scholar]
- Haas JT, Miao J, Chanda D, Wang Y, Zhao E, Haas ME, et al. Hormonal regulation of hepatic glucose production in health and disease. Cell Metab. 2011;14:9–19. doi: 10.1016/j.cmet.2011.06.003. [DOI] [PMC free article] [PubMed] [Google Scholar]
- Saltiel AR, Kahn CR. Insulin signaling and the regulation of glucose and lipid metabolism. Nature. 2001;414:799–806. doi: 10.1038/414799a. [DOI] [PubMed] [Google Scholar]
- Haas JT, Miao J, Chanda D, Wang Y, Zhao E, Haas ME, et al. Hepatic insulin signaling is required for obesity-dependent expression of SREBP-1c mRNA but not for feeding-dependent expression. Cell Metab. 2012;15:873–84. doi: 10.1016/j.cmet.2012.05.002. [DOI] [PMC free article] [PubMed] [Google Scholar]
- Dentin R, Pégorier JP, Benhamed F, Foufelle F, Ferré P, Fauveau V, et al. Hepatic glucokinase is required for the synergistic action of ChREBP and SREBP-1c on glycolytic and lipogenic gene expression. J Biol Chem. 2004;279:20314–26. doi: 10.1074/jbc.M312475200. [DOI] [PubMed] [Google Scholar]
- Edgerton DS, Ramnanan CJ, Grueter CA, Johnson KM, Lautz M, Neal DW, et al. Effects of insulin on the metabolic control of hepatic gluconeogenesis in vivo. Diabetes. 2009;58:2766–75. doi: 10.2337/db09-0328. [DOI] [PMC free article] [PubMed] [Google Scholar]
- Aronoff SL, Berkowitz K, Shreiner B, Want L. Glucose metabolism and regulation: beyond insulin and glucagon. Diabetes Spectrum. 2004;17:183–90. [Google Scholar]
- Nora A, Jurgen B. Molecular mechanisms and therapeutic targets in steatosis and steatohepatitis. Pharmacol Rev. 2008;60:311–57. doi: 10.1124/pr.108.00001. [DOI] [PubMed] [Google Scholar]
- Bugianesi E, Moscatiello S, Ciaravella MF, Marchesini G. Insulin resistance in nonalcoholic fatty liver disease. Curr Pharm Des. 2010;16:1941–51. doi: 10.2174/138161210791208875. [DOI] [PubMed] [Google Scholar]
- Catherine P, Jean G. Contribution of de novo fatty acid synthesis to hepatic steatosis and insulin resistance: lessons from genetically engineered mice. J Clin Invest. 2013;118:829–38. doi: 10.1172/JCI34275. [DOI] [PMC free article] [PubMed] [Google Scholar]
- Saeid G, Mohammad B, Ismail L. Diabetes and alpha lipoic acid. Frontiers Pharmacol. 2011;2:69. doi: 10.3389/fphar.2011.00069. [DOI] [PMC free article] [PubMed] [Google Scholar]
- Sinqh U, Jialal I. Alpha-lipoic acid supplementation and diabetes. Nutr Rev. 2008;66:646–57. doi: 10.1111/j.1753-4887.2008.00118.x. [DOI] [PMC free article] [PubMed] [Google Scholar] [Retracted]
- Kim MS, Park JY, Namkoong C, Jang PG, Ryu JW, Song HS, et al. Anti-obesity effects of alpha-lipoic acid mediated by suppression of hypothalamic AMP–activated protein kinase. Nat Med. 2004;10:727–33. doi: 10.1038/nm1061. [DOI] [PubMed] [Google Scholar]
- Lee WJ, Song KH, Koh EH, Won JC, Kim HS, Park HS, et al. Alpha-lipoic acid increases insulin sensitivity by activating AMPK in skeletal muscle. Biochem Biophys Res Commun. 2005;332:885–91. doi: 10.1016/j.bbrc.2005.05.035. [DOI] [PubMed] [Google Scholar]
- Dentin R, Pégorier JP, Benhamed F, Foufelle F, Ferré P, Fauveau V, et al. Hepatic glucokinase is required for the synergistic action of ChREBP and SREBP-1c on glycolytic and lipogenic gene expression. J Biol Chem. 2004;279:20314–26. doi: 10.1074/jbc.M312475200. [DOI] [PubMed] [Google Scholar]
- Benhamed F, Denechaud PD, Lemoine M, Robichon C, Moldes M, Bertrand-Michel J, et al. The lipoic transcription factor ChREBP dissociates hepatic steatosis from insulin resistance in mice and humans. J Clin Invest. 2012;122:2176–94. doi: 10.1172/JCI41636. [DOI] [PMC free article] [PubMed] [Google Scholar]
- Gupte AA, Liu JZ, Ren Y, Minze LJ, Wiles JR, Collins AR, et al. Rosiglitazone attenuates age- and diet-associated nonalcoholic steatohepatitis in male low-density lipoprotein receptor knockout mice. Hepatology. 2010;52:2001–11. doi: 10.1002/hep.23941. [DOI] [PMC free article] [PubMed] [Google Scholar]
- Catherine P, Jean G. Contribution of de novo fatty acid synthesis to hepatic steatosis and insulin resistance: lessons from genetically engineered mice. J Clin Invest. 2013;118:829–38. doi: 10.1172/JCI34275. [DOI] [PMC free article] [PubMed] [Google Scholar]
- Givanni M, Roberto G, Maurizio C. Rencent insights into hepatic lipid metabolism in non-alcoholic fatty liver disesse (NAFLD) Prog Lipid Res. 2008;48:1–26. doi: 10.1016/j.plipres.2008.08.001. [DOI] [PubMed] [Google Scholar]
- Olefsky JM, Glass CK. Macrophages, inflammation and insulin resistance. Annu Rev Physiol. 2010;72:219–46. doi: 10.1146/annurev-physiol-021909-135846. [DOI] [PubMed] [Google Scholar]
- Pascot A, Després JP, Lemieux I, Alméras N, Bergeron J, Nadeau A, et al. Deterioration of the metabolic risk profile in women. Respective contributions of impaired glucose tolerance and visceral fat accumulation. Diabetes Care. 2001;24:902–8. doi: 10.2337/diacare.24.5.902. [DOI] [PubMed] [Google Scholar]
- Park KG, Min AK, Koh EH, Kim HS, Kim MO, Park HS, et al. Alpha-lipoic acid decreases hepatic lipogenesis through adenosine monophosphate-activated protein kinase (AMPK)-dependent and AMPK-independent pathways. Hepatology. 2008;48:1477–86. doi: 10.1002/hep.22496. [DOI] [PubMed] [Google Scholar]
- Timmers S, de Vogel-van den Bosch J, Towler MC, Schaart G, Moonen-Kornips E, Mensink RP, et al. Prevention of high-fat diet-induced muscular lipid accumulation in rat by lipoic acid is not mediated by AMPK activation. J Lipid Res. 2010;51:352–9. doi: 10.1194/jlr.M000992. [DOI] [PMC free article] [PubMed] [Google Scholar]
- Fruci B, Giuliano S, Mazza A, Malaguarnera R, Belfiore A. Nonalcoholic fatty liver: A possible new target for type 2 diabetes prevention and treatment. Int J Mol Sci. 2013;14:22933–66. doi: 10.3390/ijms141122933. [DOI] [PMC free article] [PubMed] [Google Scholar]
- Bechmann LP, Hannivoort RA, Gerken G, Hotamisligil GS, Trauner M, Canbay A. The interaction of hepatic lipid and glucose metabolism in liver diseases. J Hepatol. 2012;56:952–64. doi: 10.1016/j.jhep.2011.08.025. [DOI] [PubMed] [Google Scholar]
- Herman MA, Peroni OD, Villoria J, Schön MR, Abumrad NA, Blüher M, et al. A novel ChREBP isoform in adipose tissue regulates systemic glucose metabolism. Nature. 2012;484:333–8. doi: 10.1038/nature10986. [DOI] [PMC free article] [PubMed] [Google Scholar]
- Denechaud PD, Bossard P, Lobaccaro JM, Millatt L, Staels B, Girard J, et al. ChREBP, but not LXRs, is required for the induction of glucose-regulated genes in mouse liver. J Clin Invest. 2008;118:956–64. doi: 10.1172/JCI34314. [DOI] [PMC free article] [PubMed] [Google Scholar]
- Lizuka K, Bruick RK, Liang G, Horton JD, Uyeda K. Deficiency of carbohydrate response elementbinding protein (ChREBP) reduces lipogenesis as well as glycolysis. Proc Natl Acad Sci U S A. 2004;101:7281–6. doi: 10.1073/pnas.0401516101. [DOI] [PMC free article] [PubMed] [Google Scholar]
- Dentin R, Benhamed F, Hainault I, Fauveau V, Foufelle F, Dyck JR, et al. Liver-specific inhibition of ChREBP improves hepatic steatosis and insulin resistance in ob/ob mice. Diabetes. 2006;55:2159–70. doi: 10.2337/db06-0200. [DOI] [PubMed] [Google Scholar]
- Kim YM, Seo YH, Park CB, Yoon SH, Yoon G. Roles of GSK3 in metabolic shift toward abnormal anabolism in cell senescence. Ann N Y Acad Sci. 2010;1201:65–71. doi: 10.1111/j.1749-6632.2010.05617.x. [DOI] [PubMed] [Google Scholar]


