

Abstract
The proteins that possess guanine nucleotide exchange factor (GEF) activity, which include about ~800 G protein coupled receptors (GPCRs),1 15 Arf GEFs,2 81 Rho GEFs,3 8 Ras GEFs,4 and others for other families of GTPases,5 catalyze the exchange of GTP for GDP on all regulatory guanine nucleotide binding proteins. Despite their importance as catalysts, relatively few exchange factors (we are aware of only eight for ras superfamily members) have been rigorously characterized kinetically.5–13 In some cases, kinetic analysis has been simplistic leading to erroneous conclusions about mechanism (as discussed in a recent review14). In this paper, we compare two approaches for determining the kinetic properties of exchange factors: (i) examining individual equilibria, and; (ii) analyzing the exchange factors as enzymes. Each approach, when thoughtfully used,14,15 provides important mechanistic information about the exchange factors. The analysis as enzymes is described in further detail. With the focus on the production of the biologically relevant guanine nucleotide binding protein complexed with GTP (G•GTP), we believe it is conceptually simpler to connect the kinetic properties to cellular effects. Further, the experiments are often more tractable than those used to analyze the equilibrium system and, therefore, more widely accessible to scientists interested in the function of exchange factors.
Keywords: G protein coupled receptors, GTP-binding protein, Heterotrimeric G proteins, Ras superfamily, guanine nucleotide exchange factors
Introduction
Regulatory guanine nucleotide binding proteins (aka GTPases), including the heterotrimeric G protein and Ras superfamily members, mediate cellular responses to the environment and inter- and intra-cellular signaling. The importance to human biology is highlighted by the number of diseases1,16-20; e.g., infertility, blindness, deafness, cancer, that are caused by defects in pathways regulated by GTPases. The resources committed by the pharmaceutical industry to screen for inhibitors of GTPase pathways further speaks to the perceived and true importance of GTPase signaling to human health. Indeed, the National Cancer Institute has recently committed resources to a Ras Initiative to examine the GTPase Ras as a therapeutic target in cancer (http://frederick.cancer.gov/RASGreenLight.aspx). GTPases, with few exceptions, are temporal and spatial regulators of signaling that depend on controlled binding and hydrolysis of GTP for function. For the typical GTPase, GDP affinities are high due to low dissociation rates and, consequently, spontaneous formation of the GTPase complexed to GTP (G•GTP) are slow compared with the biological processes being controlled. Thus, the functioning of GTPases as central regulators of diverse biology is entirely dependent on accessory or modulator proteins that catalyze exchange of nucleotide, converting the guanine nucleotide bound from GDP (G•GDP) to GTP (G•GTP).1,5These are called guanine nucleotide exchange factors (GEFs) for Ras superfamily proteins and G protein coupled receptors (GPCRs) for heterotrimeric G proteins.
Detailed kinetic studies for eight Ras superfamily members/exchange factor pairs have been reported.6-13 In seven studies, the exchange factors are considered as part of equilibrium systems that include the guanine nucleotide binding protein and nucleotide.15 This powerful approach led to the discovery that at least these, and maybe all, exchange factors function by an allosteric competitive displacement mechanism.15,21 Further, a specific equilibrium pathway was identified, leading to the allosteric competitive displacement model as the prevailing paradigm.21 The GTPases so far examined have had similar kinetics. However, as a group, the GTPases, and the heterotrimeric G proteins in particular, have a wide range of kinetic properties, which may be necessary to support particular biological processes. Possible variations in the GEF mechanisms to accommodate the range of necessary kinetic properties have not been studied.
The equilibrium formalism is particularly valuable in addressing the details of kinetic mechanisms.15 However, experiments to characterize the equilibria can be technically difficult or impossible. An additional challenge in using the formalism is that the number and complexity of the equilibria in the system may obscure the kinetic properties critical to biological functions. As explained in more depth under “Results and Discussion,” the exchange of GDP for GTP involves 6 proteins and protein complexes involved in 7 equilibria (see Fig. 1). Which of the 7 equilibria determines the kinetic properties may not be obvious. The exchange factors have also been treated as enzymes.14,22-27 Here, we discuss the analysis of the exchange factors as enzymes as a tractable approach, which may also be used to elucidate fundamental kinetic properties of the GEF-GTPase pairs. The GEFs are appropriately considered enzymes: they accelerate the conversion of G•GDP to G•GTP and are not consumed by the reaction. The advantages of considering the exchange factor as an enzyme is that the relationship to the generation of the biologically relevant product G•GTP is obvious and the experimental approach is tractable for all G protein/exchange factors as far as we are aware. We also discuss some pitfalls of the approach and encourage readers to refer to Goody14 for a discussion of pitfalls of kinetic experiments and Zeeh et al.22 for additional explanation of the enzyme formalism for exchange factors. We believe that the approach considering the GEFs as enzymes make quantitative characterizations of GEFs, and comparisons between them, accessible to a wide number of researchers and will provide results that are readily interpreted in terms of the regulated biological process. We note that some of the experimental approaches described are also relevant to analyses of GTPase-activating proteins (GAPs), which are an equally large number of GTPase modulators important for the temporal and spatial regulation of GTPase signaling.
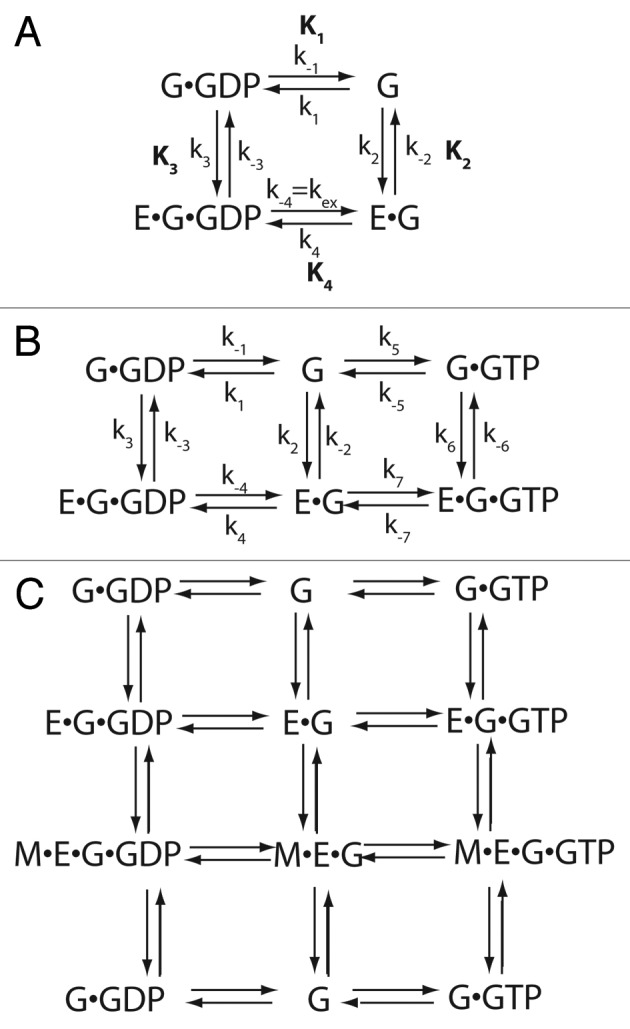
Figure 1. Equilibria systems describing the interaction of exchange factors and guanine nucleotide binding proteins. (A) Basic equilibria describing nucleotide dissociation. The system described by the schematic considers the interaction of empty guanine nucleotide protein and guanine nucleotide binding protein bound to guanine nucleotide, without distinguishing diphospho and triphospho forms, to the exchange factor. Equilibrium constants are K1, K2, K3 and K4 and association and dissociation constants comprising each equilibrium constant are indicated with lower case k. The numbering of the equilibria correspond to that used by Goody.9,15 The constant kex refers to the nucleotide dissociation rate constant (ex for exchange), also indicated as k-4 and is the nomenclature used by Goody.9,15 (B) Equilibria that include GTP as a distinct species from GDP. The equilibrium system in A was expanded to allow for the possibility that GTP dissociation and association may differ from GDP. (C) Equilibria including modifier. In this expanded equilibrium system, the effect of a modifier able to bind to the exchange factor and exchange factor-guanine nucleotide binding protein complexes is included. Abbreviations: E = exchange factor, G = guanine nucleotide binding protein, M = modifier.
Experimental Procedures
Protein Preparations
His-Brag2Sec7-PH and His-ARNO1 were expressed in bacteria and purified using His-Trap HP column followed by Hiload16/60 Superdex 75 column (GE Healthcare).12 The expression and purification of [325–724]ASAP1, myristoylated Arf1 and Arf6 (myrArf1 and myrArf6) were described previously.12,28-30 Dark adapted bovine rhodopsin was isolated from bovine rod outer seqment preparations as described.31,32 Bovine transducin was isolated from rod outer disc preparations as previously described.33
Large unilamellar vesicles (LUVs)
LUVs were prepared by extrusion with lipids purchased from Avanti Polar Lipids as described previously.34,35 For assays involving Brag2, LUVs contained molar ratios of 40% phosphatidylcholine (PC), 25% phosphatidylethanolamine (PE), 15% phosphatidylserine (PS), 10% cholesterol, 9% phosphatidylinositol (PI), and 1% phosphatidylinositol 4,5-bisphosphate (PI(4,5)P2). For assays containing ARNO1, they contained molar ratios of 40% PC, 25% PE, 15% PS, 10% cholesterol, 7.4% PI, 2.5% PI(4,5)P2, and 0.1% phosphatidylinositol 3,4,5-trisphosphate (PtdIns(3,4,5)P3). Rhodopsin-containing LUVs were prepared using 1-palmitoyl, 2-oleilphosphatidylcholine (POPC) at a mass ratio of 500:1 POPC:rhodopsin as previously described.36
GEF activity
Brag2 or ARNO1 catalyzed conversion of Arf•GDP to Arf•GTP was followed in one of the following two ways.
Fixed time point assay
Brag2 or ARNO1 catalyzed GTPγS binding to Arf•GDP were performed in the nucleotide exchange buffer (25 mM HEPES, pH 7.4, 100 mM NaCl, 1 mM dithiothreitol, 2 mM MgCl2, 1 mM EDTA, 1 mM ATP, 5 µM GTPγS, trace amount of [35S]GTPγS) as described.12,37,38 The high MgCl2 was used in this reaction to slow spontaneous nucleotide exchange. The reactions also contained 0.5 mM LUVs and 0.5 µM Arf•GDP, with different concentrations of Brag2 or ARNO1. The reactions were incubated at 30 °C for 3 min and terminated with 2 ml of ice-cold 20 mM Tris, pH8.0, 100 mM NaCl, 10 mM MgCl2, and 1 mM dithiothreitol. Protein-bound nucleotide was trapped on nitrocellulose, and the bound radioactivity was determined by liquid scintillation counting.
Substrate saturation experiment
2’,3′-O-(N-methylanthraniloyl)GTP (mantGTP) was purchased from Invitrogen. Brag2 GEF activity was determined under conditions satisfying the steady-state assumption using a FluorMax3 spectrophotometer (Jobin Yvon Horiba, Edison, NJ). The conversion of Arf•GDP to Arf•mantGTP was monitored by FRET signal.22 The excitation wavelength was set at 297 nm, a wavelength near the peak absorption for tryptophan. Peak emission from tryptophan is between 300 and 350 nm. Peak absorption of the MANT group is at 350nm and peak emission is 448 nm. Thus, energy transferred from tryptophan to mant can be monitored by measuring emission at 450 nm. Arf•mantGTP has a FRET signal as a result of the mant fluorophore, whereas Arf•GDP does not; therefore the conversion results in an increase in fluorescent signal. The reaction contained 25 mM HEPES, pH 7.4, 100 mM NaCl, 1 mM dithiothreitol, 2 mM MgCl2, 1 mM EDTA, 20 µM mantGTP (saturating concentration), 0.5 mM LUV with 1% PIP2, 0.1 nM His-Brag2Sec7-PH, and different concentrations of myrArf1•GDP.
GAP activity
The conversion of Arf1·GTP to Arf1·GDP catalyzed by [325–724]ASAP1 was followed in a fixed time point assay as described.39 In this assay, [L8K]Arf1 loaded with [α32P]GTP was used as substrate. Reactions were done in the buffer containing 25mM Hepes (pH 7.4), 100mM NaCl, 1mM DTT and mixed Triton X-100 (0.1%) micelles with 200µM PIP2 (bovine brain, Avanti Polar Lipids). A plot of ln(S0/S)/t, in which S0 is the initial amount of substrate, S is the substrate remaining after the reaction and “t” is the fixed time point (3 min), vs the concentration of PZA (Etot) was used to determine the enzymatic power (kcat/KM).
Kinetics of GTPγS Binding to Transducin
Reaction progress assays for rhodopsin-catalyzed nucleotide exchange on transducin were performed similar to the procedures described for rod outer segment discs.40 Rhodopsin-containing LUVs prepared with POPC were mixed with transducin and a reaction solution containing 1 μM [35S]GTPγS at ambient temperature (22 C). The reaction was transferred to an automatic re-pipette and the pipette tip was illuminated with a Xenon flash lamp at a distance of 2 cm to photolyze the rhodopsin and initiate the activation reaction. Aliquots (10 μl) from the reaction were dispensed into 2 ml of the quench solution at various times after photolysis to follow the progress of the binding reaction by filtering over 0.45 μm nitrocellulose filters. Bound [35S]GTPγS was quantified by liquid scintillation counting.
Results and Discussion
Equilibrium model
One approach for studying exchange factors has been to consider their effects on the equilibria between the GDP bound GTPase and the empty (apoprotein) GTPase (i.e., G•GDP ↔ G, see Figure 1A for an example equilibrium system). This analysis involves measuring the rates of GDP dissociation from and binding to the guanine nucleotide binding protein (i.e., G) and G in complex with the exchange factor. The rate of G, G•GDP and G•GTP, binding to and dissociation from the GEF is also measured. The determined rate constants are the microconstants comprising the equilibrium constants. For example, K1 = k-1/k1. Alternatively, the equilibrium constants can be determined for each equilibrium involved (see Figure 1), e.g., the Keq for G + GTP ↔ G•GTP, represented as K1 in the diagram. This approach has been used to analyze at least seven exchange factors6-11,13 and has led to the identification of the mechanism presented in Figure 1A in which the GEF functions by allosteric competitive displacement.15,21 The empty guanine nucleotide binding protein complexes with the exchange factor more tightly than does G•GXP (GXP = GTP or GDP). Consequently, the exchange factor displaces GXP from the guanine nucleotide binding protein and, conversely, GXP binding to the guanine nucleotide binding protein displaces the GEF. This model is consistent with crystallographic structural results, in which nucleotide binding to the GTPase was found to be destabilized by a combination of GTPase conformational changes and electrostatic repulsion of the phosphates on GDP by side chains from the GEF.41-43 In addition to testing the model, the quantitative results of the equilibrium analyses have been useful for comparisons among exchange factors and the assessment of the relationship of the rate to the biological function regulated. The parameter kex/K3 (i.e., the nucleotide dissociation rate divided by the dissociation constant for the G•GXP•GEF complex) has been used to compare the catalytic efficiency of the GEFs (see Table 1).9 The constant is nearly equivalent to kcat/Km, called the enzymatic power or specificity constant, used to compare catalytic efficiencies of enzymes. Like kcat/Km, the parameter has the units M−1sec−1. The reaction rate in the cell can be estimated by multiplying kex/K3 or kcat/Km by the concentration of exchange factor and guanine nucleotide binding protein.
Table 1. Kinetic constants for exchange factor catalyzed nucleotide exchange.
| Protein | kex or kcat (/sec) | Kd or Km (µM) | Enzymatic Power | Reference |
|---|---|---|---|---|
| Ypt51/Vps9 | 0.012 | 23 | 5.2x10² (kex/Kd) | 10 |
| Ypt1/DSS4 | 0.013 | 16.7 | 7.2 x 10² (kex/Kd) | 10 |
| Rab8/MSS4 | 0.23 | 27 | 8.5x10³ (kex/Kd) | 8 |
| Ras/Cdc25 | 1.8 | 38 | 4.7x10⁴(kex/Kd) | 7 |
| Sec4/Sec2 | 15 | 77 | 2x10⁵ (kex/Kd) | 9 |
| Ran/RCC1 | 21 | 0.7 | 3x10⁷ (kex/Kd) | 6 |
| EfTu/EfTs | 85 | 2 | 4.25x10⁷ (kex/Kd) | 13 |
| Trapp/YPT1 | 4.8 | 0.16 | 3.3x10⁴ (kex/Kd) | 11 |
| Arf1/Brag2 | 1.77 | 0.20 | 8.8x10⁶ (kcat/Km)* | 12 |
| Arf6/Brag2 | 0.60 | 0.22 | 2.7x10⁶ (kcat/Km)* | 12 |
Determined in the presence of saturating concentrations of nucleotide. i Analysis of the effect of modifiers using the enzyme formalism is not discussed in this paper. Standard approaches are described in many biochemistry textbooks and examples from the exchange factor literature12,25. ii In the enzyme scheme, all forward steps are given a + subscript and all backward steps a – subscript. In the equilibrium scheme in Figure 1, we have denoted association constants with + subscripts and dissociation with – subscripts. Furthermore, we have numbered equilibria as in Itzen et al.9 whereas the association and dissociation steps in the enzyme figures are numbered according to reaction sequence. Consequently, k3 in Figure 2B is identical to k-2 in Figure 1A. iii The value of rhodopsin at which ½ maximum velocity observed was about ¼ the concentration of the GTPase, in this case the heterotrimeric G protein transducin. In fact, according to equation 15, it is not possible to have a number less than GTPase/2. Experimental error likely contributes to obtaining a value less than transducin/2. iv Consider the equation . Then (a) and (b) . If, for instance, S < 0.1 Kd, then ES/Efree is less than 0.1. Dividing (a) by Efree, 1 = Etot/Efree- 0.1. If less than 10% is considered insignificant, than . Similar considerations apply to S. v The assumption of lack of backward reaction is reasonable if GTP is present at saturating concentrations as described above, but product inhibition is difficult to exclude. Nevertheless, the analysis is reasonable to assess magnitude of error.
Justification for using the enzyme formalism
Practical advantages related to experiments are an important reason for use of the enzyme formalism instead of the equilibrium formalism. The equilibrium analysis can be complex because of the number of equilibria necessary for defining the system. For example, in the system illustrated in Figure 1, a full description of the system involves determination of the on and off rates that govern the 4 equilibria that comprise the system. If one further considers that G•GTP is the important product, seven equilibria must be examined, as schematized in Figure 1B. The addition of a simple modifier of exchange factor activity can increase the number of equilibria to 15 required for describing the system (e.g., Figure 1C). In the enzyme formalism, analysis requires one additional titration to determine the effect of a modifieri.
Another important practical advantage of the enzyme formalism over the equilibrium formalism is related to the properties of the GTPases, in particular, the stability of the empty form of the G protein. The equilibrium formalism requires positing the existence of G, the empty form of the guanine nucleotide binding protein, and preparing the empty form of the protein for binding studies. For many guanine nucleotide binding proteins, the isolated apoprotein probably does not exist in vivo as it is thought to remain bound to the GEF, and typically is not stable; e.g., for Arf, we have not been able to measure the lifetime under conditions in which binding studies would have to be performed (PR, unpublished). Therefore, the experiments involving the empty form may be neither relevant nor tractable. The experimental analysis of GEFs as enzymes requires only that the substrates, GTP and G•GDP, and the products, GDP and G•GTP, be stable and quantifiable.
An additional advantage is that enzyme parameters are directly related to the generation of G•GTP, the physiologically relevant product. Considering the effect of the GEF on the equilibrium of G ↔ G•GXP focuses on nucleotide displacement. The rationale given in the equilibrium studies is that nucleotide dissociation is the rate limiting step and the differences between GTP and GDP association are assumed less important to exchange. However, kex is not necessarily equivalent to kcat and K3 is not necessarily equivalent to Km, which could be a combination of several microconstants (the constants indicated by the lower case “k” in Figures 1, 2 and 3). Two examples illustrate this point. Trapp, an exchange factor for YPT1, has been reported to affect GTP binding rate, i.e., k7 is faster than k5 (Fig. 1B).11 Another example is Rho GDS.44 For this exchange factor, the rate of reaction is limited by dissociation of GEF from the GEF•G•GXP complex, rate k-3 for GDP in the scheme given in Figure 1A and rate k-6 for GTP in Figure 1B, which is about 1/10 the rate of nucleotide dissociation, k-4 (kex). Consequently, kex/K3 is approximately 10-fold larger than kcat/Km. In short, because steps in addition to nucleotide dissociation may limit the overall reaction rate, kex/K3, calculated from analysis of the equilibria, cannot be assumed to be equivalent to kcat/Km.
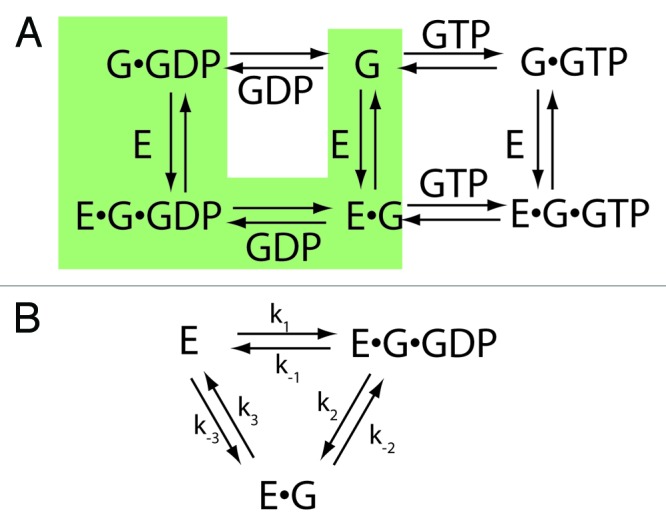
Figure 2. The mono-bi mechanism for exchange factor activity. (A) Equilibrium system. The equilibrium pathway that constitutes the enzyme mechanism is highlighted. (B) Enzyme model. The relevant equilibria are presented in a way that centers on the exchange factor. The numbering of constants is determined by the reaction sequence and differs from the numbering for the equilibria presented in Figure 1A, which is the numbering used by Goody.9,15 In the scheme exchange factor, E, binds to the guanine nucleotide binding protein in complex with GDP, G•GDP, forming the ternary complex E•G•GDP. In the next step, GDP dissociates, leaving the binary complex E•G. In the third step, the binary complex dissociates, yielding nucleotide free G, which binds free nucleotide. However, the nucleotide binding step occurs independently of the exchange factor and is not included in the scheme. Abbreviations: E = exchange factor, G = guanine nucleotide binding protein.
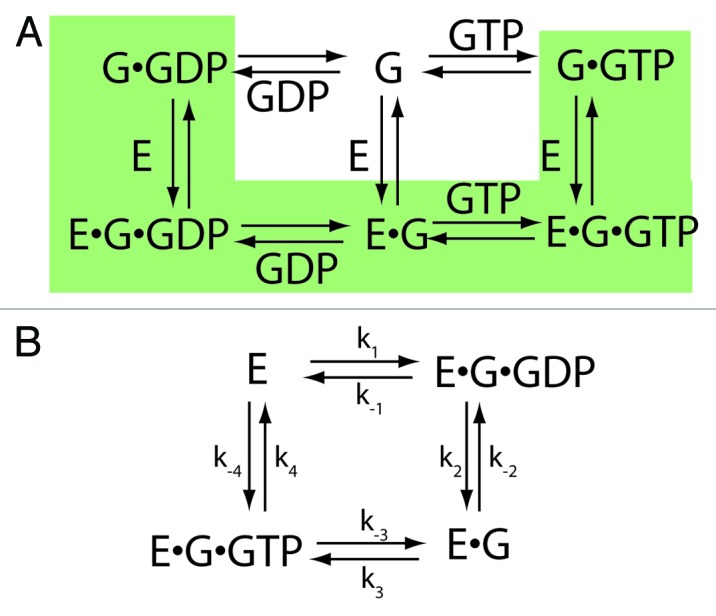
Figure 3. The ping-pong bi-bi mechanism for exchange factor activity. (A) Equilibrium system. The relevant pathway within the equilibrium system is highlighted. (B) Enzyme model. The relevant equilibria are presented in a manner that conforms to the enzyme formalism. In the first step, the exchange factor, E, binds to the guanine nucleotide binding protein in complex with GDP, G•GDP, forming the ternary complex E•G•GDP. In the next step, GDP dissociates, leaving the binary complex E•G. In the third step, GTP associates with the binary complex to form a ternary complex, E•G•GTP. In the fourth step, G•GTP dissociates from the exchange factor. Abbreviations: E = exchange factor, G = guanine nucleotide binding protein.
Because of the connection between enzyme mechanism and equilibrium pathways, a complete analysis of exchange factors as enzymes can be used to understand the equilibrium system as well.
Enzyme model
To analyze exchange factors as enzymes, we assume a specific path within the equilibrium system to be a specific enzyme mechanism. The distinction between the kinetic mechanisms is related to the complex of GEF•G. If the dissociation rate of the complex is similar to or faster than the dissociation of the GEF•G•GTP complex (i.e., k-2 ≥ k-6, Figure 1A) then the mono bi reaction mechanism is used for analysis (Fig. 2).45 If the GEF•G protein complex is stable compared with GEF•G•GTP (i.e., k-2 < k-6), then the ping pong bi bi mechanism is more appropriate (Fig. 3).45,46
Mono bi reaction mechanism
In Figure 2, the particular equilibria that constitute the mono bi mechanism are highlighted in the scheme in panel A. Equilibria involving G•GTP are excluded, as these are not part of the mechanism. The scheme focusing on the exchange factor is presented in panel B. In this mechanism, the substrate is G•GDP and the products are nucleotide free G and GDP. Mono refers to a single substrate and bi to the two products. GDP must be released prior to G, so the reaction is said to be ordered (see Segel45 for a discussion of nomenclature). The equation relating initial velocity of reaction to the concentration of the substrate in the absence of products is a simple hyperbolic function, i.e., the Michaelis-Menten equation:
The parameters Vmax and Km are estimated by measuring initial velocities with a fixed concentration of enzyme and varied concentration of G•GDP (concentration of G•GDP or other species indicated by square brackets [], e.g., [G•GDP]). The principles of experimental design are those well established for enzymes and have been discussed for exchange factors.15,22 The concentrations of G•GDP should include a range in which vi is linearly proportional to [G•GDP] to a range where vi is insensitive to [G•GDP]. Fitting the curve of vi vs [G•GDP] to equation 1 gives estimates of Km and Vmax. Vmax is used to calculate kcat from the relationship
(with Vmax in dimension of concentration/time).
The kcat can be either k3, k2 or a combination of these (constants are from Figure 2B)ii as described by equation (3).
For example, if k3 is much less than k2, it will be the rate limiting step and, consequently, kcat. The Km is also a combination of constants, as described in equation (4).
Several properties can distinguish this reaction from the other reaction mechanism, ping pong bi bi, as discussed below. Importantly, neither [GTP] nor [G•GTP] should have an effect on the reaction rate when studying GDP dissociation. Note that the products of the reaction are apoGTPase and GDP.
Depending on the rate of dissociation relative to the association constant, the apparent rate of GTP binding might appear to be independent of GTP concentration over a large range of GTP. For example, assuming an association rate of 109M−1sec−1 and a dissociation rate of 1/sec, the GTP binding rate would be near maximal at concentrations above 10 nM and, hence, appear to be independence of [GTP] in the range of [GTP] (100 nM to 100 μM) often used to study binding.
Ping pong bi bi reaction mechanism
In this mechanism, we assume that nucleotide free G does not exist free in solution and the complex of nucleotide free G with GEF (G•GEF) is relatively stable compared with G•GXP•GEF. These assumptions are reasonable given the analysis of exchange factors for Ras superfamily members examined to date. The steps in the equilibrium scheme included in this mechanism are highlighted in Figure 3, panel A. Equilibria involving nucleotide free G are not considered. The mechanism is written as an enzyme scheme in panel B. There are two substrates, G•GDP and GTP, and two products, GDP and G•GTP, hence the designation bi bi. One substrate binds to the enzyme and a product leaves before the second substrate binds, which is referred to as a ping pong mechanism. The enzyme has two forms that are interconverted by each half reaction. Free enzyme binds to G•GDP. Release of GDP generates the complex of GEF•G, which we consider a second form of the enzyme as it is a stable complex. GTP, the second substrate, binds leading to the release of G•GTP and regeneration of the free enzyme. The relationship of initial velocity (vi) to substrate concentration was derived under the assumptions that (i) substrate is in excess of enzyme and (ii) there is a finite period of time before 10% of the substrates are consumed during which the concentration of the enzyme-substrate complexes can be considered constant (i.e., steady-state assumption) (equation 5).
where KG•GDP is the concentration of G•GDP at which vi is ½ of Vmax when [GTP] is saturating and KGTP is the concentration of GTP at which vi is ½ of Vmax when [G•GDP] is saturating. Each is comprised of microconstants (from Figure 3B).
The apparent Km and Vmax for G•GDP are dependent on the concentration of GTP, a distinction from the mono bi mechanism for which reaction rate is independent of [GTP]. At saturating concentrations of one substrate, the parameters for the second substrate can be determined by a simple titration. With saturating [GTP], the equation reduces to
And with saturating [G•GDP], the equation reduces to:
Determining parameters for one substrate at saturating concentrations of the second substrate is often sufficient to obtain useful parameters and is one way to reduce complexity when examining enzyme modifiers (e.g., see Jian et al.12). The kcat can be determined from equation (2). The rate constant is a combination of k2 and k4 (from Figure 3B).
An example of an experiment is shown in Figure 4. Binding of the guanine nucleotide analog methylanthranoyl (MANT) GTP to myrArf1 was determined by fluorescence energy tranfer from tryptophan in Arf to the methylanthranoyl fluorophore that is covalently bonded to GTP at either the 2’ or 3′ position of the ribose (use of methylanthranoyl derivatives of guanine nucleotides is discussed22,47,48). Brag2 was used as the exchange factor at a concentration of 0.1 nM, which is much less than the Km for either substrate (GTP or Arf•GDP), thus satisfying the assumptions necessary to interpret the substrate saturation initial velocity studies in which a substrate (in this case G•GDP) is titrated into the reaction until a concentration is reached at which the reaction velocity is independent of [G•GDP], i.e., saturating. The concentration of MANT-GTP was 20 µM, which is saturating.12 myrArf1•GDP was titrated into the reaction mixture incubated at 30 °C and binding was monitored as fluorescence at 450 nm in samples excited with 297 nm light (see Methods). The maximal signal achieved was used to calculate the relationship of FRET signal to binding stoichiometry, which was used to calculate the initial reaction velocity from the initial slope of the change in fluorescence. Note that Arf was quantified separately in an experiment that determined the amount of bound GTPΥS using radioactive tracer at a well-defined specific activity. The data were fit to equation 4, which is the Michaelis-Menten equation. Similar analyses were used to determine the Vmax and the Km for both GTP and myrArf1•GDP.12
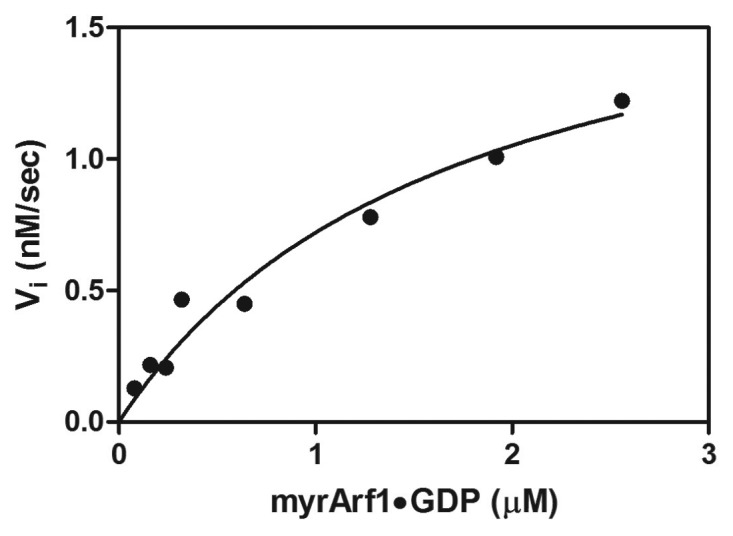
Figure 4. Substrate saturation analysis of His-Brag2. myrArf1•GDP was titrated into reaction containing 0.1 nM His-Brag2 and 20 µM MANT-GTP. Nuceotide binding over time was detected as an increase in resonance energy transfer from tryptophan on myrArf1 to MANT. Initial rates were determined and plotted against myrArf1•GDP concentration. The data were fit to a Michaelis-Menten equation (equation 1 in the text). Other details of the experiments are provided under “Experimental Procedures.”
A more robust analysis involves titrating one substrate at several concentrations of the second substrate. For example, at sub-saturating concentrations of GTP, the relation of the apparent Vmax (Vmax, app), when titrating Arf•GDP, to [GTP] is:
And the apparent Km for Arf•GDP (Km,Arf•GDP, app) when Arf•GDP is titrated at sub-saturating concentrations of GTP is
The effect of [GTP] on G•GDP dependence of the reaction rate is useful for a simple test to distinguish between the mono bi ordered and bi bi ping pong mechanisms. It is important in this test that the assumptions used to derive the equations, i.e., [GEF] < < [G•GDP], not be violated. In the mono-bi ordered mechanism, [GTP] will not affect the rate of GDP dissociation. In contrast, in the bi-bi ping pong mechanism, a single round of GDP release will occur, after which the GEF will be sequestered by the empty G, i.e., G•GEF. Thus, if [GEF] < < [G•GDP] and no displacing GTP is present, catalysis may not occur because the GEF will be sequestered in a complex with the empty G during the first round of catalysis. (Fig. 5) In designing this experiment, the dissociating nucleotide (i.e., GDP) must be sequestered or hydrolyzed (e.g., by including a nucleotidase in the reaction), because the reaction can proceed backward (Fig. Three and 5) with a futile cycle, giving the appearance of no exchange when in fact there is continuous re-exchange of GDP.
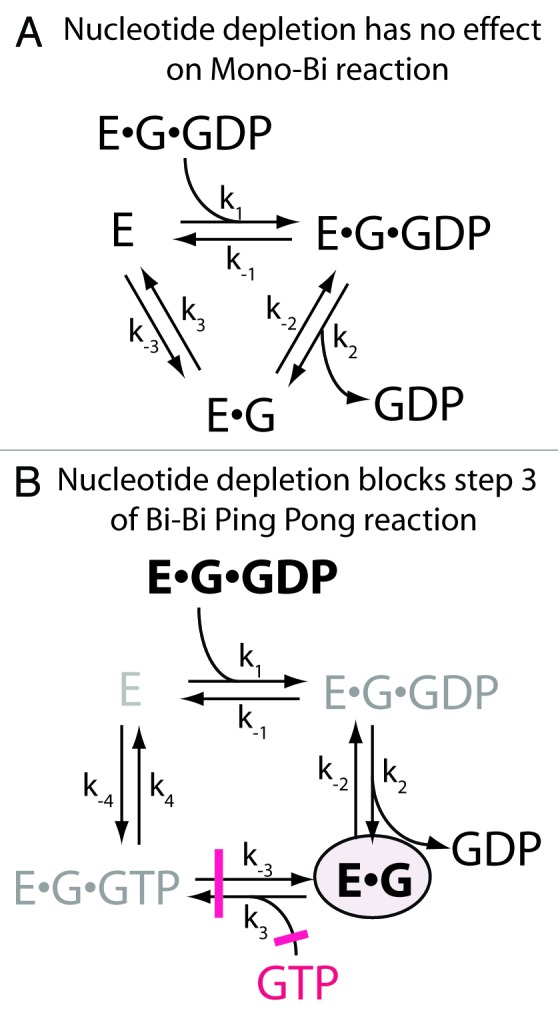
Figure 5. Nucleotide dependence can distinguish between enzyme mechanisms. (A) Mono-Bi is not affected by nucleotide depletion. The reaction scheme shows that the cycle of substrate binding and product dissociation does not depend on nucleotide at any step. Therefore, if using nucleotide dissocation as a measure of activity, a limited amount of GEF will go through successive cycles to induce dissociation of GDP from the G•GDP. (B) Bi-Bi ping pong is affected by nucleotide depletion. In the reaction scheme, nucleotide association is required for product formation and dissociation of G from the enzyme (steps 3 and 4 in the scheme). Under conditions where there is less GEF (E) than G•GDP and no free nucleotide, the reaction will be blocked at step 3, with the GEF sequestered (E•G, circled in scheme) after a single round of GDP dissociation. Consequently, no free GEF will be available to induce GDP dissociation from the remaining G•GDP. Abbreviations: E = exchange factor, G = guanine nucleotide binding protein.
Product inhibition studies can also be valuable for distinguishing mechanisms. For instance, G•GTP inhibits the conversion of G•GDP for the bi bi mechanism, but has no effect under the mono bi mechanism . The approach is discussed in general in several textbooks (e.g., Segel45) and specifically for GEFs in a manuscript that is being prepared (Northup and Randazzo).
Titration of GEF to determine enzymatic parameters
The GEF may be titrated into a reaction for several reasons. When titrated in excess of G•GDP and to concentrations greater than the Km, a single turnover can be followed providing a direct robust measure of the kcat or the maximum rate of nucleotide dissociation, kex, valuable whether examining the equilibrium or enzyme system. Unless the catalytic constant (kcat) is less than 0.1/sec, the experiment requires use of specialized equipment for rapid mixing of reactants. Because the purpose of this paper is to describe approaches to experiments that are more generally accessible to biochemists, we will not describe single turnover experiments here. The use of single turnover experiments for studying GEFs and GAPs has been described in depth elsewhere12,30,49,50 and is the topic of a manuscript in preparation (Randazzo, Northup and Jian).
Often, the GEF is titrated into a reaction with a fixed concentration of G•GDP because the approach is more tractable than substrate saturation experiments (i.e., G•GDP titration) for reasons including that the GTPase is difficult to prepare in concentrations necessary to achieve saturation, the signal to noise ratio is not sufficient to estimate initial rates at low concentrations of the GTPase or, in the case of screening experiments comparing many conditions or proteins, the number of assays is prohibitive. Although GEF titration can be useful, there are a number of pitfalls that should be considered. In this section, we describe two different experiments in which GEFs are titrated, one based on initial rates and the other on an end point assay. As will be illustrated, the experiments are most interpretable if the GTPase is present at concentrations less than the Km, in which case the kcat/Km ratio (also known as enzymatic power) may be determined. Enzymatic power is a useful parameter for the comparison of exchange factors and of exchange factors under different conditions.9 We then analyze how violation of the assumption of limited substrate affects interpretation of the data.
In experiments in which GEF is titrated into reactions containing [G•GDP] near or greater than the Km, the relationship of initial rate to [G•GDP ] and [GEF] concentration is a quadratic function.
| . |
The maximum velocity is observed with excess and saturating GEF is
and the concentration of GEF to achieve half maximum velocity is
An example is shown in Figure 6, which presents initial experiments designed to test the influence of phospholipid composition of the biochemical activity of the prototypic GPCR, rhodopsin. In panel A, progress curves for reactions containing 245 nM transducin and the indicated concentrations of rhodopsin in POPC vesicles. Note that this experiment confirms the enzyme formalism for rhodopsin-catalysis of GTP-exchange. The rate of the reaction increases with higher concentrations of rhodopsin whereas the reactions all progress to similar GTPγS-binding plateaus. The initial rates estimated from the progress curves are plotted as a function of Rhodopsin in panel B. The Vmax and [GEF]1/2max calculated by fitting this data to a single-site model are 0.89 uM/min and 56 nM. In this instance, the concentration of transducin utilized in the reactions was too great to allow determination of the Km. The [GEF]1/2max was less than transducin/2iii. From equation 15, this indicates that Km must be small compared with the transducin concentration and, consequently, Km cannot be determined from this experiment. However, kcat can be estimated using equation 14 to be 4 mol/mol/min. Because rhodopsin was titrated to concentrations greater than transducin, the experiment is very similar to a single turnover experiment. The rates were sufficiently slow so that rapid mixing machines were not required. Alternate ways of analyzing these results are presented elsewhere.30,51
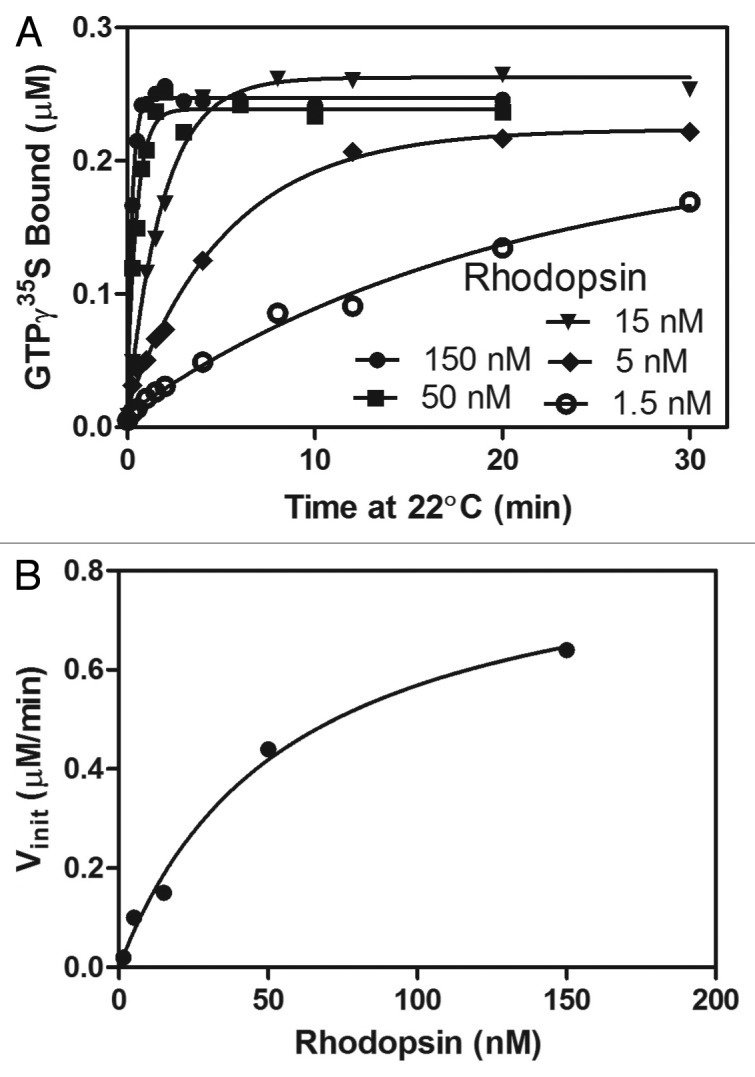
Figure 6. Analysis of transducin-rhodopsin interaction by varying rhodopsin. In panel A the progress of rhodopsin-catalyzed GTPγS binding to heterotrimeric transducin was measured by mixing the indicated concentrations of rhodopsin in DOPC vesicles with 245 nM transducin in a 1 μM GTPγS reaction and following the time-course of GTPγS35 binding at the indicated times. Details of this experiment are provided under “Experimental Procedures.” The lines drawn are the best fit for a single exponential approach to equilibrium. The rate constants derived from these fits are plotted against the rhodopsin concentrations in panel B. The line shown is the best fit for this data to a single-site binding model.
A fixed point assay can also be used to estimate enzymatic parameters with [G•GDP] less than the Km, kcat/Km can be determined. At saturating concentrations of G•GDP, the best that can be obtained is a relative kcat, which may be useful for some comparisons of enzymes and substrates (see discussion of Arf1 and Arf6 with Brag2 and ARNO).
Consider the general reaction scheme:
analogous here to
With E = GEF, S = G•GDP, ES = GEF•G•GDP and P = G•GTP.
We can consider the backward reaction negligible if the second substrate, GTP, is held saturating. Furthermore, under the condition of saturating GTP, it can be considered constant, and the reaction examined as if G•GDP were the single substrate (see eq. Five and 6). Total substrate is a sum of free substrate and substrate in complex with enzyme E, i.e.
From this, we know the change in total substrate equals the change in free substrate + change in substrate in complex with the enzyme, i.e.
which can be rewritten as
Written as a derivative:
The concentration of ES, under the rapid equilibrium assumption, is:
Assuming (1) rapid equilibrium of E, S and ES and (2) S and E < Km
and
So,
Rearranging
Integrating
Equation (26) can be rearranged
e.g.
A plot of
vs [Etot ] gives a line with a slope of the enzymatic power (Fig. 7).
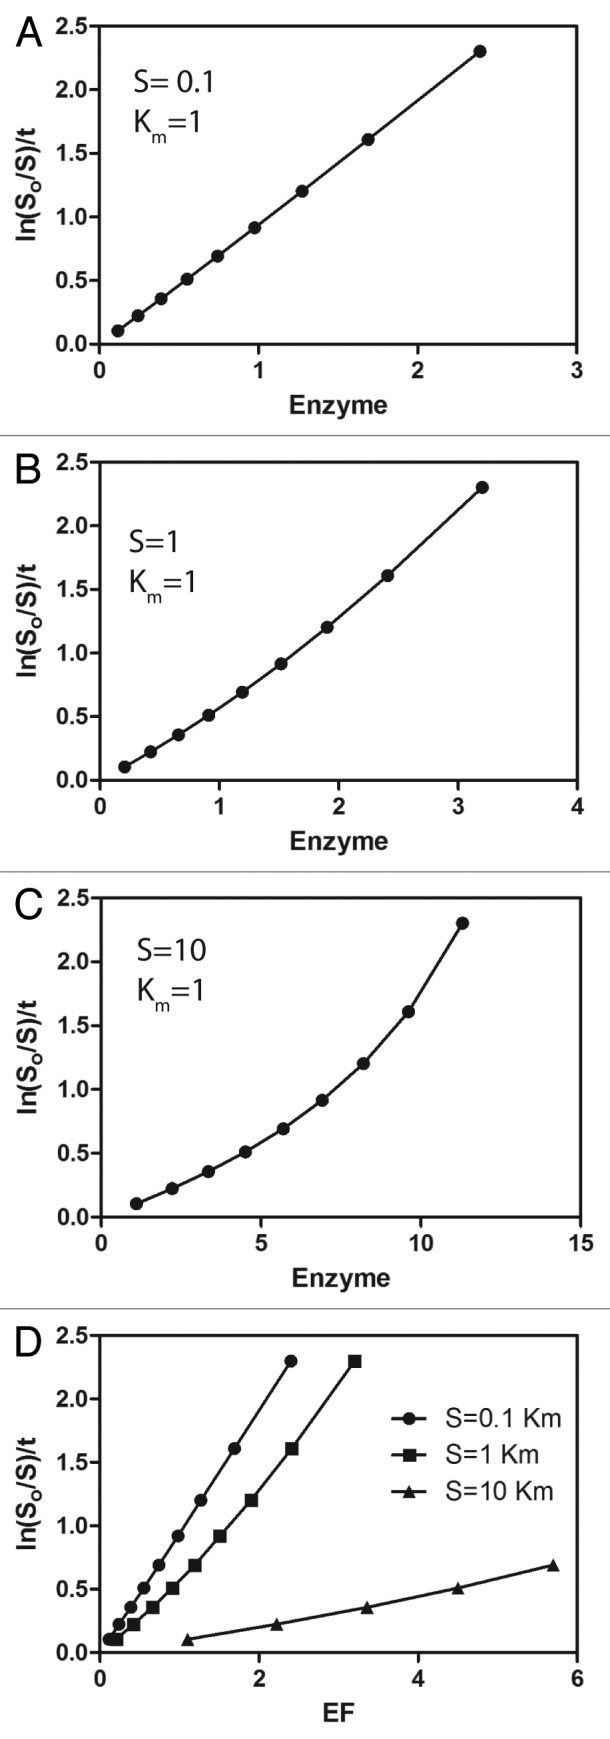
Figure 7. Relationship of substrate consumption to enzyme concentration. Equation 24 was used to calculate the amount of enzyme required to consume 10 – 90% substrate at the indicated initial concentration (S/Km), with a kcat of 1 arbitrary unit and a Km in 1 arbitrary unit of time. Ln(S0/S)/t was plotted against the enzyme concentrations. The enzymatic power (i.e., kcat/Km) for the plot in A (S = 0.1, Km = 1) is 1. The slope was 0.96. In B, (S = 1, Km = 1), the enzymatic power is 1 and that estimated as the slope was 0.73. In C, S = 10. The data were not fit to a line because of the obvious deviation from linearity. In panel D, the data are plotted together over a limited enzyme concentration range. Deviations from linearity are difficult to detect in this case because higher levels of substrate consumption were not examined with the potential for underestimating the kcat/Km.
Using this experiment to determine kcat/Km requires that the concentration of substrate is less than Km. Thus, the approach has the disadvantage in that if the Km is not known, one cannot be certain that the assumptions related to enzyme and substrate concentration are not being violated. We used an integrated rate equation (equation 28 described in Morangani52) to estimate the error that would be expected if the assumption that [S] < Km is violated (Fig. 7)v and to establish whether the plot of vs [Etot ] will be of diagnostic value.
In fact, when [S] is near the Km, deviation from linearity may be difficult to detect (Fig. 7). In this case, the estimate of kcat/Km from the plot of ln([S0]/[S])/t vs. E is 60–70% of the actual value. The plot has an obvious loss of linearity if S is more than 3-fold greater than the Km but only in experiments with more than 50% of the substrate consumed (i.e., when ln([S0]/[S]) = 0.69, see Figure 7). At relatively high concentrations of S, the estimate from this plot is not accurate, but sufficient substrate will be consumed to recognize nonlinearity of the plot. Therefore, an independent means of assuring saturation with substrate has not been achieved is important for confidence in the estimate of kcat/Km using this approach, e.g., a substrate concentration dependence of initial rate that is linear to the concentration used for the experiment. Practically, the experiment is performed with [G•GDP ]below saturation and [GTP] above saturation. The relationship is typically linear until greater than 80% of the substrate is consumed. Outside of this range, the product formation as well as assay noise and background, which are not taken into account in the equation, may result in loss of linearity. We encourage the reader to refer to DeNitto et al.41 for another approach for determining kcat/Km that can be used when a full analysis is not necessary e.g., for screening or comparing mutants.
Even if the conditions are not optimal (i.e., [G•GDP] is not less than Km), titration of the enzyme may still be valuable for determining relative enzymatic power. One such case is shown in Figure 8. The concentration of the substrate Arf (0.5 µM) was approximately twice the Km (0.2 μM).12 In these experiments, ARNO and Brag2 were titrated into a reaction containing Arf1•GDP or Arf6•GDP and 5 µM [35S]GTPγS (see figure legend for detailed contents of the reaction). The reaction was stopped after 3 min by dilution into ice cold buffer and rapidly filtered on nitrocellulose to trap the protein bound GTPγS. Using this analysis, the enzymatic power of Brag2, i.e., the slope of the line, was estimated to be 2.4-fold greater for Arf1 than for Arf6, similar to the difference based on a combination of stopped flow to determine kcat and substrate saturation to determine Km (kcat/Km was 8.8 x 10⁶ M−1s−1 for Arf1 and 2.7 x 10⁶M−1s−1 for Arf612). Similarly, ARNO used Arf1 twice as efficiently than Arf6, in line with the enzymatic parameters determined by single turnover kinetics. However, in these cases, the difference in enzymatic power was due to differences in kcat, which would be detected even with saturating amounts of substrate.
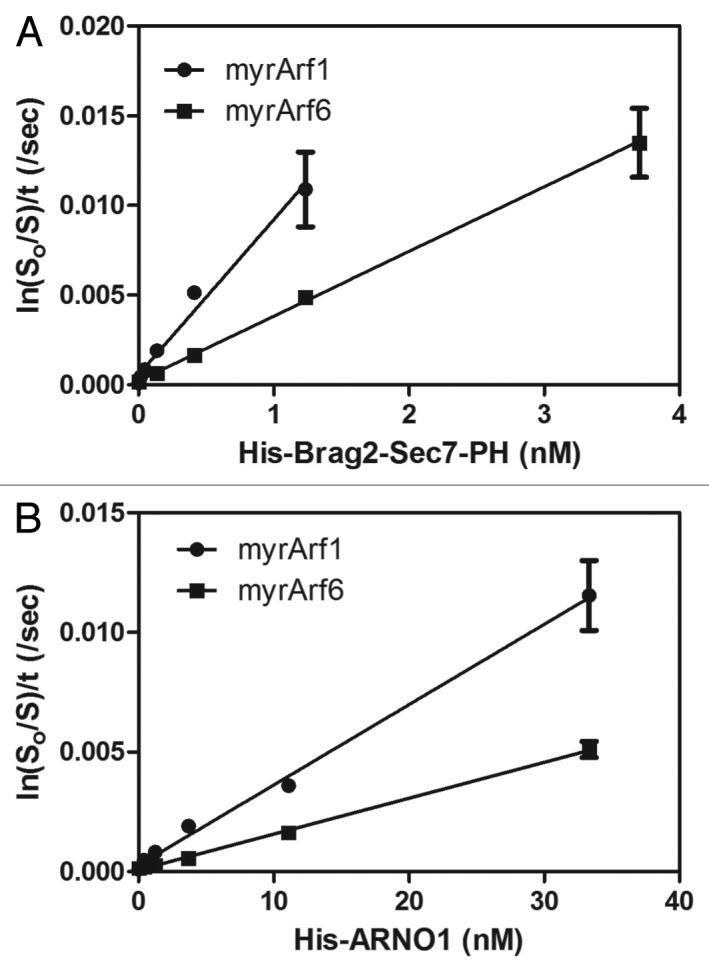
Figure 8. Determining relative enzymatic power by titrating the enzyme. His Brag (A) or His Arno (B) were titrated into a reaction mixture containing 0.5 µM myrArf1•GDP or myrArf6•GDP, as indicated, and 5 µM [35S]GTPγS. The fraction of myrArf1 or myrArf6 that exchanged nucleotide in 3 min was determined using a filter-binding assay as described in “Experimental Procedures.”
In summary,(i) the kcat/Km ratio will not be accurately determined if the assumption that S < Km is violated (ii) when comparing GEFs, substrates and/or conditions of the reaction, differences between Kms will not be detected if substrate is saturating and (iii) differences in kcat will be detected even under saturating conditions, so a “blind” titration is sometimes useful. This approach for determining kcat/Km may be applicable to other enzymes. We have, for instance, used this analysis for GTPase-activating proteins. An example is shown in Figure 9 for the ArfGAP ASAP1. In the experiment, [325–724]ASAP1, comprising the catalytic core of the protein, is titrated into a reaction containing mixed micelles of Triton X-100 and phosphatidylinositol 4,5 bisphosphate and 0.1 µM [L8K]Arf1•GTP. The kcat/Km is estimated from the plot to be 1.1 ± 0.1 x 10⁷ M−1sec−1.
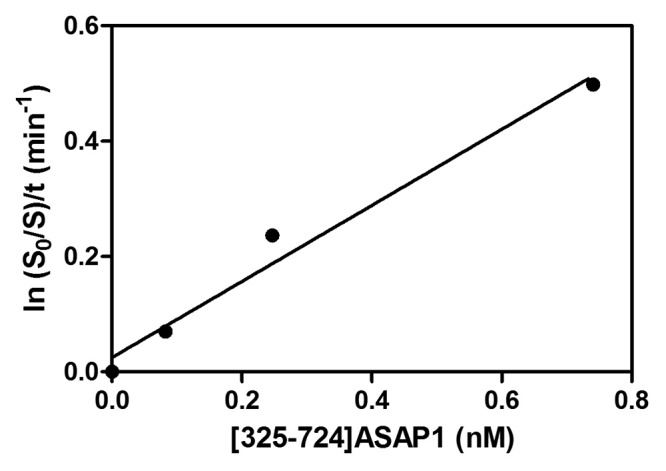
Figure 9. Determination of the enzymatic power of an ArfGAP. An active fragment of an ArfGAP, [325–724]ASAP1, was titrated into a reaction containing mixed micelles of Triton X-100 and phosphatidylinositol 4,5 bisphosphate and [L8K]Arf1•GTP. Conversion of [L8K]Arf1•GTP to [L8K]Arf1•GDP in 3 min at 30 C was determined. The data were transformed, plotted and fit to a line as indicated in the figure.
Thus, in its simplest form by determining rates of reaction with varying the concentration of the “enzyme,” the GEFs BRAG2 or ARNO1 in Figure 8, and plotting the results as depicted in Figure 7 one can determine the enzymatic power of one GEF for different GTPases or different GEFs for the same GTPase to make quantitative comparisons regarding specificity of a likely biologically relevance. The major drawback of titrating enzyme instead of substrate is that determining whether violation of assumptions used to derive the equations is difficult to determine from the titration alone, which could compromise the confidence in the values obtained and the comparisons based on the analysis.
Lipid bilayers: An uncharacterized contributor to some GTPase exchange reactions
Many GTPase and GEFs reversibly associate with lipid bilayers; however, the relationship of membrane association to activity is poorly characterized at this time. Consider Arfs for instance. The substrates of the GEFs, Arf•GDP and GTP, are both soluble, whereas the GEF•Arf complexes and Arf•GTP are membrane associated. Consequently, surface dilution may not have a role in the forward reaction, although it may have a role for the reverse reaction. The role of lipids in these reactions remains to be rigorously investigated. Until more is understand, we feel the most prudent approach for reporting on activity of GEFs and GTPases that depend on a lipid bilayer is to provide a precise description of the lipid system used in the experiments and ensure all comparisons are made under the same lipid conditions. A better understanding of the role of lipid bilayers in the reactions will be achieved by thoughtful application of the principles of chemical kinetics and is a topic of ongoing studies in our laboratories.
The value of determining kinetic constants and the kcat/Km ratio (enzymatic power)
The principal value of proper consideration of basic chemical kinetics is that it is necessary to understand the function and regulation of this important class of proteins. Goody14 emphasizes the importance by providing a number of examples of erroneous conclusions that have been reported in the literature. We hope our description of the relationship of the equilibrium system to the enzyme catalyzed reactions, together with the discussion of analysis and pitfalls will provide some guidance to ensure chemical kinetics are appropriately considered when studying the GEFs.
An additional value for determining enzyme parameters and, in particular the kcat/Km, is for comparing different GEFs with of a common substrate GTPase, of one GEF under different conditions, or of one GEF for different substrate GTPases. An example of the use of kcat/Km for such comparisons is a study of Grp125 Based on structural results, the existence of two autoinhibitory interactions within Grp1 was proposed. As a robust test of the hypothesis, the kcat/Km was determined for a series of Grp1 mutants. Similarly, kcat/Km ratio was used to quantify the effect of PIP2 on the activity of Brag2.12 Some typical values of kcat/Km and kex/K3 are presented in Table 1.
A long-term goal is to understand the function of exchange factors and their substrate G proteins within cells. We anticipate the kcat/Km ratio will be invaluable in this regard as more are determined and we acquire additional data on intracellular protein concentrations and distributions. For example, the rate of generation of G•GTP can be estimated by multiplying the concentration of the enzyme and substrate by the kcat/Km. Another example is the assessment of exchange factor and GAP functional pairing. Assuming that the increase in G•GTP levels occurs on the same time scale as the decrease, then the [GEF]·kcat,GEF/Km,GEF ≈[GAP]·kcat,GAP/Km, GAP. Thus, modeling the cellular pathways dependent on G proteins is dependent on determination of reliable enzymatic parameters.
Conclusions
The human genome encodes many hundreds of exchange factors for guanine nucleotide binding proteins but few have been characterized sufficiently for reliable comparisons or for relating kinetic properties with biological function. Furthermore, poorly performed kinetics have led to erroneous conclusions about the function and regulation of this important class of proteins.14 Chemical kinetics must be used to achieve a reliable understanding of the exchange factor. This class of proteins can be considered as enzymes, which convert the substrate G•GDP to the biologically active product G•GTP, which provides a straightforward analysis and yields results whose relevance to the biological processes is clear provided that the principles of kinetics are appropriately considered. Several Arf GEFs and GPCRs have already been studied as enzymes, providing insights into regulatory mechanisms and the action of inhibitors e.g.12,22,25,53,54 Application of the formalism to other enzymes of this class may provide insights into the diverse areas of biology in which guanine nucleotide binding proteins have a central role.
Disclosure of Potential Conflicts of Interest
No potential conflicts of interest were disclosed.
Acknowledgments
We thank Dr. Richard A. Kahn for critical review of the manuscript and Drs. Kahn and David Lambright for discussion and advice. The work was supported by the intramural program of the National Institutes of Health (Project BC 007365).
References
- 1.Oldham WM, Hamm HE. Heterotrimeric G protein activation by G-protein-coupled receptors. Nat Rev Mol Cell Biol. 2008;9:60–71. doi: 10.1038/nrm2299. [DOI] [PubMed] [Google Scholar]
- 2.Casanova JE. Regulation of Arf activation: the Sec7 family of guanine nucleotide exchange factors. Traffic. 2007;8:1476–85. doi: 10.1111/j.1600-0854.2007.00634.x. [DOI] [PubMed] [Google Scholar]
- 3.Rossman KL, Der CJ, Sondek J. GEF means go: turning on RHO GTPases with guanine nucleotide-exchange factors. Nat Rev Mol Cell Biol. 2005;6:167–80. doi: 10.1038/nrm1587. [DOI] [PubMed] [Google Scholar]
- 4.Fernández-Medarde A, Santos E. The RasGrf family of mammalian guanine nucleotide exchange factors. Biochim Biophys Acta. 2011;1815:170–88. doi: 10.1016/j.bbcan.2010.11.001. [DOI] [PubMed] [Google Scholar]
- 5.Bos JL, Rehmann H, Wittinghofer A. GEFs and GAPs: critical elements in the control of small G proteins. Cell. 2007;129:865–77. doi: 10.1016/j.cell.2007.05.018. [DOI] [PubMed] [Google Scholar]
- 6.Klebe C, Prinz H, Wittinghofer A, Goody RS. The kinetic mechanism of Ran--nucleotide exchange catalyzed by RCC1. Biochemistry. 1995;34:12543–52. doi: 10.1021/bi00039a008. [DOI] [PubMed] [Google Scholar]
- 7.Lenzen C, Cool RH, Prinz H, Kuhlmann J, Wittinghofer A. Kinetic analysis by fluorescence of the interaction between Ras and the catalytic domain of the guanine nucleotide exchange factor Cdc25Mm. Biochemistry. 1998;37:7420–30. doi: 10.1021/bi972621j. [DOI] [PubMed] [Google Scholar]
- 8.Itzen A, Pylypenko O, Goody RS, Alexandrov K, Rak A. Nucleotide exchange via local protein unfolding--structure of Rab8 in complex with MSS4. EMBO J. 2006;25:1445–55. doi: 10.1038/sj.emboj.7601044. [DOI] [PMC free article] [PubMed] [Google Scholar]
- 9.Itzen A, Rak A, Goody RS. Sec2 is a highly efficient exchange factor for the Rab protein Sec4. J Mol Biol. 2007;365:1359–67. doi: 10.1016/j.jmb.2006.10.096. [DOI] [PubMed] [Google Scholar]
- 10.Esters H, Alexandrov K, Iakovenko A, Ivanova T, Thomä N, Rybin V, Zerial M, Scheidig AJ, Goody RS. Vps9, Rabex-5 and DSS4: proteins with weak but distinct nucleotide-exchange activities for Rab proteins. J Mol Biol. 2001;310:141–56. doi: 10.1006/jmbi.2001.4735. [DOI] [PubMed] [Google Scholar]
- 11.Chin HF, Cai Y, Menon S, Ferro-Novick S, Reinisch KM, De La Cruz EM. Kinetic analysis of the guanine nucleotide exchange activity of TRAPP, a multimeric Ypt1p exchange factor. J Mol Biol. 2009;389:275–88. doi: 10.1016/j.jmb.2009.03.068. [DOI] [PMC free article] [PubMed] [Google Scholar]
- 12.Jian X, Gruschus JM, Sztul E, Randazzo PA. The pleckstrin homology (PH) domain of the Arf exchange factor Brag2 is an allosteric binding site. J Biol Chem. 2012;287:24273–83. doi: 10.1074/jbc.M112.368084. [DOI] [PMC free article] [PubMed] [Google Scholar]
- 13.Gromadski KB, Wieden HJ, Rodnina MV. Kinetic mechanism of elongation factor Ts-catalyzed nucleotide exchange in elongation factor Tu. Biochemistry. 2002;41:162–9. doi: 10.1021/bi015712w. [DOI] [PubMed] [Google Scholar]
- 14.Goody RS. How not to do kinetics: examples involving GTPases and guanine nucleotide exchange factors. FEBS J. 2013;1:12551. doi: 10.1111/febs.12551. [DOI] [PubMed] [Google Scholar]
- 15.Goody RS, Hofmann-Goody W. Exchange factors, effectors, GAPs and motor proteins: common thermodynamic and kinetic principles for different functions. Eur Biophys J. 2002;31:268–74. doi: 10.1007/s00249-002-0225-3. [DOI] [PubMed] [Google Scholar]
- 16.Hannan FM, Nesbit MA, Zhang C, Cranston T, Curley AJ, Harding B, Fratter C, Rust N, Christie PT, Turner JJ, et al. Identification of 70 calcium-sensing receptor mutations in hyper- and hypo-calcaemic patients: evidence for clustering of extracellular domain mutations at calcium-binding sites. Hum Mol Genet. 2012;21:2768–78. doi: 10.1093/hmg/dds105. [DOI] [PubMed] [Google Scholar]
- 17.Babey M, Kopp P, Robertson GL. Familial forms of diabetes insipidus: clinical and molecular characteristics. Nat Rev Endocrinol. 2011;7:701–14. doi: 10.1038/nrendo.2011.100. [DOI] [PubMed] [Google Scholar]
- 18.van Rhee AM, Jacobson KA. Molecular architecture of G protein-coupled receptors. Drug Dev Res. 1996;37:1–38. doi: 10.1002/(SICI)1098-2299(199601)37:1<1::AID-DDR1>3.0.CO;2-S. [DOI] [PMC free article] [PubMed] [Google Scholar]
- 19.Parnot C, Miserey-Lenkei S, Bardin S, Corvol P, Clauser E. Lessons from constitutively active mutants of G protein-coupled receptors. Trends Endocrinol Metab. 2002;13:336–43. doi: 10.1016/S1043-2760(02)00628-8. [DOI] [PubMed] [Google Scholar]
- 20.Donaldson JG, Jackson CL. ARF family G proteins and their regulators: roles in membrane transport, development and disease. Nat Rev Mol Cell Biol. 2011;12:362–75. doi: 10.1038/nrm3117. [DOI] [PMC free article] [PubMed] [Google Scholar]
- 21.Guo Z, Ahmadian MR, Goody RS. Guanine nucleotide exchange factors operate by a simple allosteric competitive mechanism. Biochemistry. 2005;44:15423–9. doi: 10.1021/bi0518601. [DOI] [PubMed] [Google Scholar]
- 22.Zeeh JC, Antonny B, Cherfils J, Zeghouf M. In vitro assays to characterize inhibitors of the activation of small G proteins by their guanine nucleotide exchange factors. Methods Enzymol. 2008;438:41–56. doi: 10.1016/S0076-6879(07)38004-X. [DOI] [PubMed] [Google Scholar]
- 23.Pacheco-Rodriguez G, Meacci E, Vitale N, Moss J, Vaughan M. Guanine nucleotide exchange on ADP-ribosylation factors catalyzed by cytohesin-1 and its Sec7 domain. J Biol Chem. 1998;273:26543–8. doi: 10.1074/jbc.273.41.26543. [DOI] [PubMed] [Google Scholar]
- 24.Pacheco-Rodriguez G, Patton WA, Adamik R, Yoo HS, Lee FJS, Zhang GF, Moss J, Vaughan M. Structural elements of ADP-ribosylation factor 1 required for functional interaction with cytohesin-1. J Biol Chem. 1999;274:12438–44. doi: 10.1074/jbc.274.18.12438. [DOI] [PubMed] [Google Scholar]
- 25.DiNitto JP, Delprato A, Gabe Lee MT, Cronin TC, Huang S, Guilherme A, Czech MP, Lambright DG. Structural basis and mechanism of autoregulation in 3-phosphoinositide-dependent Grp1 family Arf GTPase exchange factors. Mol Cell. 2007;28:569–83. doi: 10.1016/j.molcel.2007.09.017. [DOI] [PMC free article] [PubMed] [Google Scholar]
- 26.Béraud-Dufour S, Robineau S, Chardin P, Paris S, Chabre M, Cherfils J, Antonny B. A glutamic finger in the guanine nucleotide exchange factor ARNO displaces Mg2+ and the beta-phosphate to destabilize GDP on ARF1. EMBO J. 1998;17:3651–9. doi: 10.1093/emboj/17.13.3651. [DOI] [PMC free article] [PubMed] [Google Scholar]
- 27.Paris S, Béraud-Dufour S, Robineau S, Bigay J, Antonny B, Chabre M, Chardin P. Role of protein-phospholipid interactions in the activation of ARF1 by the guanine nucleotide exchange factor Arno. J Biol Chem. 1997;272:22221–6. doi: 10.1074/jbc.272.35.22221. [DOI] [PubMed] [Google Scholar]
- 28.Chen PW, Jian X, Luo R, Randazzo PA. Approaches to studying Arf GAPs in cells: in vitro assay with isolated focal adhesions. Curr Protoc Cell Biol. 2012;Chapter 17:13. doi: 10.1002/0471143030.cb1713s55. [DOI] [PMC free article] [PubMed] [Google Scholar]
- 29.Luo R, Miller Jenkins LM, Randazzo PA, Gruschus J. Dynamic interaction between Arf GAP and PH domains of ASAP1 in the regulation of GAP activity. Cell Signal. 2008;20:1968–77. doi: 10.1016/j.cellsig.2008.07.007. [DOI] [PMC free article] [PubMed] [Google Scholar]
- 30.Luo R, Ahvazi B, Amariei D, Shroder D, Burrola B, Losert W, Randazzo PA. Kinetic analysis of GTP hydrolysis catalysed by the Arf1-GTP-ASAP1 complex. Biochem J. 2007;402:439–47. doi: 10.1042/BJ20061217. [DOI] [PMC free article] [PubMed] [Google Scholar]
- 31.Litman BJ. Purification of rhodopsin by concanavalin A affinity chromatography. Methods Enzymol. 1982;81:150–3. doi: 10.1016/S0076-6879(82)81025-2. [DOI] [PubMed] [Google Scholar]
- 32.Wald G, Brown PK. The molar extinction of rhodopsin. J Gen Physiol. 1953;37:189–200. doi: 10.1085/jgp.37.2.189. [DOI] [PMC free article] [PubMed] [Google Scholar]
- 33.Fawzi AB, Northup JK. Guanine nucleotide binding characteristics of transducin: essential role of rhodopsin for rapid exchange of guanine nucleotides. Biochemistry. 1990;29:3804–12. doi: 10.1021/bi00467a030. [DOI] [PubMed] [Google Scholar]
- 34.Jian X, Brown P, Schuck P, Gruschus JM, Balbo A, Hinshaw JE, Randazzo PA. Autoinhibition of Arf GTPase-activating protein activity by the BAR domain in ASAP1. J Biol Chem. 2009;284:1652–63. doi: 10.1074/jbc.M804218200. [DOI] [PMC free article] [PubMed] [Google Scholar]
- 35.Jian X, Cavenagh M, Gruschus JM, Randazzo PA, Kahn RA. Modifications to the C-terminus of Arf1 alter cell functions and protein interactions. Traffic. 2010;11:732–42. doi: 10.1111/j.1600-0854.2010.01054.x. [DOI] [PMC free article] [PubMed] [Google Scholar]
- 36.Soubias O, Teague WE, Jr., Hines KG, Mitchell DC, Gawrisch K. Contribution of membrane elastic energy to rhodopsin function. Biophys J. 2010;99:817–24. doi: 10.1016/j.bpj.2010.04.068. [DOI] [PMC free article] [PubMed] [Google Scholar]
- 37.Sakurai A, Jian X, Lee CJ, Manavski Y, Chavakis E, Donaldson J, Randazzo PA, Gutkind JS. Phosphatidylinositol-4-phosphate 5-kinase and GEP100/Brag2 protein mediate antiangiogenic signaling by semaphorin 3E-plexin-D1 through Arf6 protein. J Biol Chem. 2011;286:34335–45. doi: 10.1074/jbc.M111.259499. [DOI] [PMC free article] [PubMed] [Google Scholar]
- 38.Terui T, Kahn RA, Randazzo PA. Effects of acid phospholipids on nucleotide exchange properties of ADP-ribosylation factor 1. Evidence for specific interaction with phosphatidylinositol 4,5-bisphosphate. J Biol Chem. 1994;269:28130–5. [PubMed] [Google Scholar]
- 39.Randazzo PA, Kahn RA. GTP hydrolysis by ADP-ribosylation factor is dependent on both an ADP-ribosylation factor GTPase-activating protein and acid phospholipids. J Biol Chem. 1994;269:10758–63. [PubMed] [Google Scholar]
- 40.Fawzi AB, Fay DS, Murphy EA, Tamir H, Erdos JJ, Northup JK. Rhodopsin and the retinal G-protein distinguish among G-protein beta gamma subunit forms. J Biol Chem. 1991;266:12194–200. [PubMed] [Google Scholar]
- 41.Goldberg J. Structural basis for activation of ARF GTPase: mechanisms of guanine nucleotide exchange and GTP-myristoyl switching. Cell. 1998;95:237–48. doi: 10.1016/S0092-8674(00)81754-7. [DOI] [PubMed] [Google Scholar]
- 42.Mossessova E, Corpina RA, Goldberg J. Crystal structure of ARF1*Sec7 complexed with Brefeldin A and its implications for the guanine nucleotide exchange mechanism. Mol Cell. 2003;12:1403–11. doi: 10.1016/S1097-2765(03)00475-1. [DOI] [PubMed] [Google Scholar]
- 43.Mossessova E, Gulbis JM, Goldberg J. Structure of the guanine nucleotide exchange factor Sec7 domain of human arno and analysis of the interaction with ARF GTPase. Cell. 1998;92:415–23. doi: 10.1016/S0092-8674(00)80933-2. [DOI] [PubMed] [Google Scholar]
- 44.Hutchinson JP, Eccleston JF. Mechanism of nucleotide release from Rho by the GDP dissociation stimulator protein. Biochemistry. 2000;39:11348–59. doi: 10.1021/bi0007573. [DOI] [PubMed] [Google Scholar]
- 45.Segel IH. Enzyme Kinetics: Behavior and Analysis of Rapid Equilibrium and Steady-State Enzyme Systems. New York: John Wiley and Sons, 1975. [Google Scholar]
- 46.Chang CH, Cha S, Brockman RW, Bennett LL., Jr. Kinetic studies of adenosine kinase from L1210 cells: a model enzyme with a two-site ping-pong mechanism. Biochemistry. 1983;22:600–11. doi: 10.1021/bi00272a012. [DOI] [PubMed] [Google Scholar]
- 47.Ahmadian MR, Wittinghofer A, Herrmann C. Fluorescence methods in the study of small GTP-binding proteins. Methods Mol Biol. 2002;189:45–63. doi: 10.1385/1-59259-281-3:045. [DOI] [PubMed] [Google Scholar]
- 48.Alexandrov K, Scheidig AJ, Goody RS. Fluorescence methods for monitoring interactions of Rab proteins with nucleotides, Rab escort protein, and geranylgeranyltransferase. Methods Enzymol. 2001;329:14–31. doi: 10.1016/S0076-6879(01)29062-4. [DOI] [PubMed] [Google Scholar]
- 49.Kraemer A, Brinkmann T, Plettner I, Goody R, Wittinghofer A. Fluorescently labelled guanine nucleotide binding proteins to analyse elementary steps of GAP-catalysed reactions. J Mol Biol. 2002;324:763–74. doi: 10.1016/S0022-2836(02)01136-1. [DOI] [PubMed] [Google Scholar]
- 50.Ahmadian MR, Hoffmann U, Goody RS, Wittinghofer A. Individual rate constants for the interaction of Ras proteins with GTPase-activating proteins determined by fluorescence spectroscopy. Biochemistry. 1997;36:4535–41. doi: 10.1021/bi962556y. [DOI] [PubMed] [Google Scholar]
- 51.Luo R, Jacques K, Ahvazi B, Stauffer S, Premont RT, Randazzo PA. Mutational analysis of the Arf1*GTP/Arf GAP interface reveals an Arf1 mutant that selectively affects the Arf GAP ASAP1. Curr Biol. 2005;15:2164–9. doi: 10.1016/j.cub.2005.10.065. [DOI] [PubMed] [Google Scholar]
- 52.Marangoni AG. Enzyme Kinetics: A Modern Approach. Hoboken, New Jersey: John Wiley and Sons, 2003. [Google Scholar]
- 53.Peyroche A, Antonny B, Robineau S, Acker J, Cherfils J, Jackson CL. Brefeldin A acts to stabilize an abortive ARF-GDP-Sec7 domain protein complex: involvement of specific residues of the Sec7 domain. Mol Cell. 1999;3:275–85. doi: 10.1016/S1097-2765(00)80455-4. [DOI] [PubMed] [Google Scholar]
- 54.Renault L, Christova P, Guibert B, Pasqualato S, Cherfils J. Mechanism of domain closure of Sec7 domains and role in BFA sensitivity. Biochemistry. 2002;41:3605–12. doi: 10.1021/bi012123h. [DOI] [PubMed] [Google Scholar]