Abstract
We evaluated several methods for characterizing hypoxic chemosensitivity in the conscious rat. Adult Sprague-Dawley rats (n = 30) were exposed to normobaric hypoxia [inspired oxygen fraction (Fio2) 0.15, 0.12, and 0.09]. We measured ventilation (V̇e; barometric plethysmography), arterial oxygen saturation (SpO2; pulse oximeter), and oxygen consumption and carbon dioxide production (V̇o2 and V̇co2; analysis of expired air). Linear regression analysis was used to define stimulus-response relationships. Testing was performed on 2 days to assess day-to-day reproducibility. Exposure to graded, steady-state hypoxia caused progressive reductions in SpO2 that were, for any given Fio2, quite variable (SpO2 range, 20–30%) among individuals. Hypoxia produced progressive increases in V̇e caused by increases in both tidal volume (VT) and breathing frequency. Hypoxia also increased the VT:inspiratory time (Ti) ratio, an indicator of central respiratory “drive.” Hypoxia caused consistent, progressive declines in V̇o2, V̇co2, and core temperature (>20% at the lowest SpO2). We propose that optimal quantification of carotid chemoreceptor hypoxic sensitivity in the unanesthetized rodent should employ SpO2 [a surrogate for arterial Po2 (PaO2)] as the stimulus variable and the ventilatory equivalent for V̇co2 (V̇e/V̇co2) and/or mean inspiratory flow rate (VT/Ti) normalized for V̇co2 as the response variables. Both metrics take into account not only the important influence of a falling metabolic rate, but also SpO2, which represents the hypoxic stimulus at the carotid body. Because of the somewhat curvilinear nature of these responses, exposure to multiple levels of graded hypoxia provides the most complete characterization of hypoxic chemosensitivity.
Keywords: chemoreflex, hypoxic ventilatory response, metabolic rate
traditionally, the slope of the ventilatory response to graded hypoxia has been used to quantify carotid chemoreceptor hypoxic sensitivity and document changes in sensitivity caused by altered environments or disease states (13, 36, 40). Evidence that this response does indeed require carotid chemoreceptors is found by the absence of a hypoxic ventilatory response in the carotid body-denervated animal or human (1, 14, 30, 38). Nevertheless, in small mammals such as rodents with relatively high metabolic rates, several adaptations attending acute hypoxic exposure make it difficult to attribute the ventilatory response slope solely to carotid chemoreceptor sensitivity. The goal of this study was to examine the relative importance of hypoxia-induced changes in metabolic rate and circulating carotid chemoreceptor stimulus levels in determining the magnitude and reproducibility of the hypoxic ventilatory response in the awake rat. We were hopeful that this study might lead to an improved method of quantifying peripheral chemoreceptor sensitivity in the awake, intact rodent.
METHODS
General
Thirty adult male Sprague-Dawley rats (body wt 375–400 g) served as subjects. Rats were housed in accordance with recommendations set forth in the National Institutes of Health “Guide for the Care of Laboratory Animals” (8th ed.). Ad libitum access was provided to drinking water and standard chow (Harlan Teklad no. 8604). The protocol was approved by the University of Wisconsin-Madison School of Medicine and Public Health's Institutional Animal Care and Use Committee.
Barometric Plethysmography
Tidal volume (VT) and respiratory frequency (fB) were measured by the method of Drorbaugh and Fenn (12) using a custom-designed system (28). The plethysmograph pressure signal was sampled at 100 Hz. A pressure calibration signal was obtained via repeated rapid injections and withdrawals of a known volume of air (0.2 ml) with a motor-driven pump prior to placement of the animal. Peak-to-peak pressure deviations were used to calculate VT using the Drorbaugh and Fenn formula (12); therefore, our measurements represent a mean of inspiratory and expiratory VT. A noise detection algorithm that utilized a moving average of the pressure waveforms was used to identify periods of sniffing and/or pressure-changing noise due to movement, grooming, and other activity, and labeled these as artifacts (see below). Minute ventilation (V̇e) was calculated as the product of VT and fB. Rat body temperature was measured using a telemeter surgically implanted within the abdominal cavity (no. VM-FH Mini-Mitter; Starr Life Sciences, Oakmont, PA) and verified by measurement of rectal temperature. Temperature within the plethysmograph chamber was controlled at 25.4°C and humidity was maintained at 60–70%. A prefiltered proportional-integral-differential-type algorithm regulated the mass flow controllers that balanced impedance to flow into and out of the chamber, so that flow through the system was maintained at 2 l/min. Oxygen consumption and carbon dioxide production (V̇o2 and V̇co2) were measured by sampling O2 and CO2 concentrations in the inspired and expired air (no. FCX-MV O2 analyzer, Fujikura, Tokyo; and no. LB-2 CO2 analyzer, Beckman Instruments, Fullerton CA). A 3-point gas calibration was performed each day prior to testing. The calibration gas concentrations bracketed the range of values expected for inspired oxygen fraction (Fio2) and expired oxygen fraction (FeO2) during the hypoxic response tests (0.22 O2 and 0.02 CO2, 0.10 O2 and 0.01 CO2, and 0.00 O2 and 0.00 CO2). A dedicated computer with custom-written software controlled the plethysmograph and saved all ventilatory and metabolic measures every 15 s. Fifteen-second segments of the pressure tracing that contained >40% artifact were excluded from further analysis.
Arterial oxygen saturation (SpO2) was measured by pulse oximetry via neck collar (MouseOx; Starr Life Sciences, Oakmont, PA). In most cases, heart rate was acquired from the oximeter signal. In six rats, heart rate, arterial pressure, and body temperature were obtained by telemetry (no. TRM56SP; Millar Instruments, Houston, TX). The telemeter body was implanted into the abdominal cavity and the pressure catheter was inserted into the terminal aorta. PowerLab 16/35 and LabChart Pro (ADInstruments, Colorado Springs, CO) were used to acquire SpO2, heart rate, and arterial pressure data.
Hypoxic Ventilatory Response Testing
At least 2 wk were allowed for recovery from telemeter implantation surgery. Rats were exposed to graded hypoxia within the plethysmograph chamber by supplementation of the inspired air with nitrogen. Data were collected during the final 5 min of a 15- to 20-min baseline period of ambient air breathing (Fio2, 0.21) and the final 5 min of 15-min periods in which Fio2 was maintained at 0.15, 0.12, and 0.09. This length of exposure was chosen because in pilot experiments we noted that 15 min was adequate time for the expired fractions of O2 and CO2 to reach new steady states after a step-down in Fio2. These assessments were performed on two separate days so that day-to-day variation in the hypoxic ventilatory response could be evaluated.
Data Analysis
Cardiorespiratory and metabolic variables during normoxia and graded hypoxia were compared by one-way, repeated-measures ANOVA with Dunnett post hoc tests. Because of the curvilinear nature of the ventilatory responses, we attempted to characterize the responses using a curve-fitting approach. We first tried a logistic fit and second- and third-order polynomials but were not able to find a nonlinear model that characterized the response in all animals. Piecewise regression with a “knot” value of 80% SpO2 was not feasible because there were only two data points above 80%—too few to provide meaningful results. Therefore, linear regression analysis was used to quantify stimulus-response relationships. V̇e, VT:inspiratory time (Ti) ratio, and ventilatory equivalents for V̇o2 and V̇co2 were expressed relative to Fio2 and SpO2. Day-to-day reproducibility of the slopes of these relationships was evaluated by calculating coefficients of variation (CV; standard deviation of the day 1 vs. day 2 difference scores/grand mean) to assess random error, and paired t-tests comparing the day 1 vs. day 2 scores to assess systematic error. Differences with P values < 0.05 were considered statistically significant. In the text, tables, and figures, data are shown as means ± SE.
RESULTS
Ventilatory Responses to Acute Reductions in Fio2
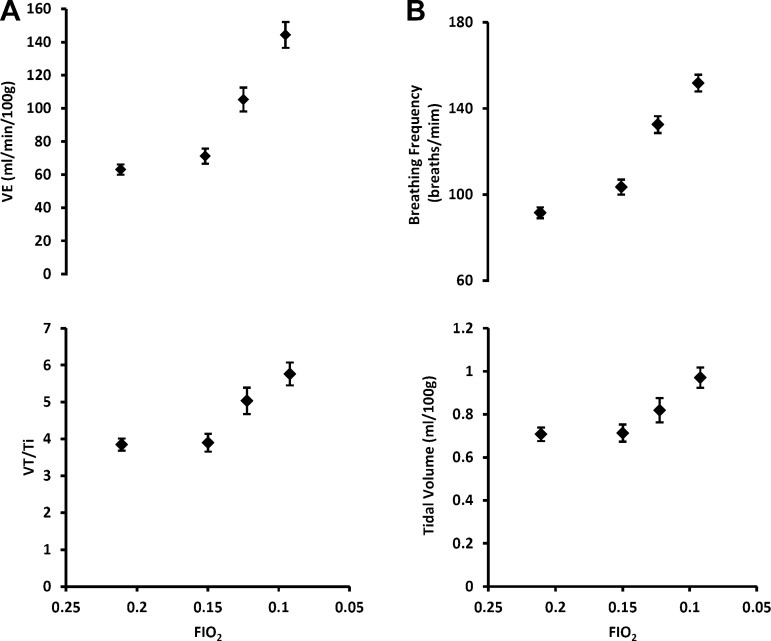
Exposure to graded, steady-state hypoxia produced robust, progressive increases in V̇e to values that were, on average, over two times greater than air-breathing eupnea at the most severe level of acute hypoxia (Table 1 and Fig. 1A). These increases in V̇e were caused by increases in both fb and VT (Table 1 and Fig. 1B). Reductions in Fio2 also produced increases in the VT:Ti ratio or mean inspiratory flow rate, an index of central respiratory “drive,” which averaged a nearly 50% increase above the eupneic value at the lowest Fio2 (Table 1 and Fig. 1A, bottom). The increase in VT/Ti was caused by simultaneous increases in VT and decreases in Ti; however, the decrease in Ti was statistically significant only at 0.12 Fio2.
Table 1.
Cardiorespiratory and metabolic variables during normoxia and graded hypoxia
| Fio2 (target) | ||||
|---|---|---|---|---|
| 0.21 | 0.15 | 0.12 | 0.09 | |
| Fio2 (actual) | 0.21 ± 0.0001 | 0.15 ± 0.0006* | 0.12 ± 0.0005* | 0.09 ± 0.0004* |
| SpO2, % | 94.3 ± 0.2 | 81.4 ± 0.7* | 72.9 ± 0.7* | 64.7 ± 0.8* |
| V̇e, ml·min−1·100 g−1 | 63.1 ± 3.1 | 71.2 ± 4.6 | 105.3 ± 7.2* | 144.3 ± 7.8* |
| fB, breaths/min | 91.5 ± 2.5 | 103.5 ± 3.5* | 132.5 ± 4.0* | 151.8 ± 3.9* |
| VT, ml | 0.71 ± 0.03 | 0.71 ± 0.04 | 0.82 ± 0.06* | 0.97 ± 0.05* |
| Ti, s | 0.185 ± 0.005 | 0.189 ± 0.006 | 0.166 ± 0.003* | 0.172 ± 0.004 |
| VT/Ti, ml/s | 3.8 ± 0.2 | 3.9 ± 0.2 | 5.0 ± 0.4* | 5.8 ± 0.3* |
| V̇o2, ml·min−1·100 g−1 | 2.36 ± 0.05 | 2.03 ± 0.04* | 1.95 ± 0.05* | 1.76 ± 0.07* |
| V̇co2 ml·min−1·100 g−1 | 1.90 ± 0.04 | 1.59 ± 0.03* | 1.46 ± 0.04* | 1.33 ± 0.04* |
| V̇e/V̇o2 | 27.05 ± 1.18 | 35.91 ± 2.16* | 55.79 ± 3.86* | 87.07 ± 5.04* |
| V̇e/V̇co2 | 33.81 ± 1.46 | 45.93 ± 2.66* | 75.11 ± 4.91* | 114.79 ± 6.79* |
| RQ | 0.80 ± 0.01 | 0.78 ± 0.02 | 0.77 ± 0.02 | 0.79 ± 0.03 |
| Core temperature, °C | 37.9 ± 0.3 | 37.8 ± 0.4 | 37.7 ± 0.4 | 37.1 ± 0.3* |
| Mean arterial pressure, mmHg (n = 6) | 119.4 ± 4.7 | 113.7 ± 4.3 | 110.6 ± 6.8* | 103.6 ± 4.1* |
| Heart rate, beats/min | 364 ± 4 | 374 ± 4 | 342 ± 7* | 319 ± 5* |
Values are means ± SE (n = 30; each rat's responses on day 1 and day 2 were averaged before generating the group means). Fio2, inspired oxygen fraction; SpO2, arterial oxygen saturation; V̇e, minute ventilation; fB, breathing frequency; VT, tidal volume, Ti, inspiratory time; V̇o2, oxygen consumption; V̇co2, carbon dioxide production; RQ, respiratory quotient. *P < 0.05 vs. normoxia.
Fig. 1.
A, top: minute ventilation (V̇e) increased in a curvilinear fashion during graded reductions in inspired oxygen fraction (Fio2). B: this increase was contributed to by increases in both breathing frequency (fB) and tidal volume (VT). A, bottom: falling Fio2 also elicited increases in VT/inspiratory time (Ti), an index of “central respiratory drive,” which was caused by both increased VT and reduced Ti. Values shown are means ± SE (n = 30; each rat's responses on day 1 and day 2 were averaged before generating group means).
Effects of Acute Reductions in Fio2 on SpO2
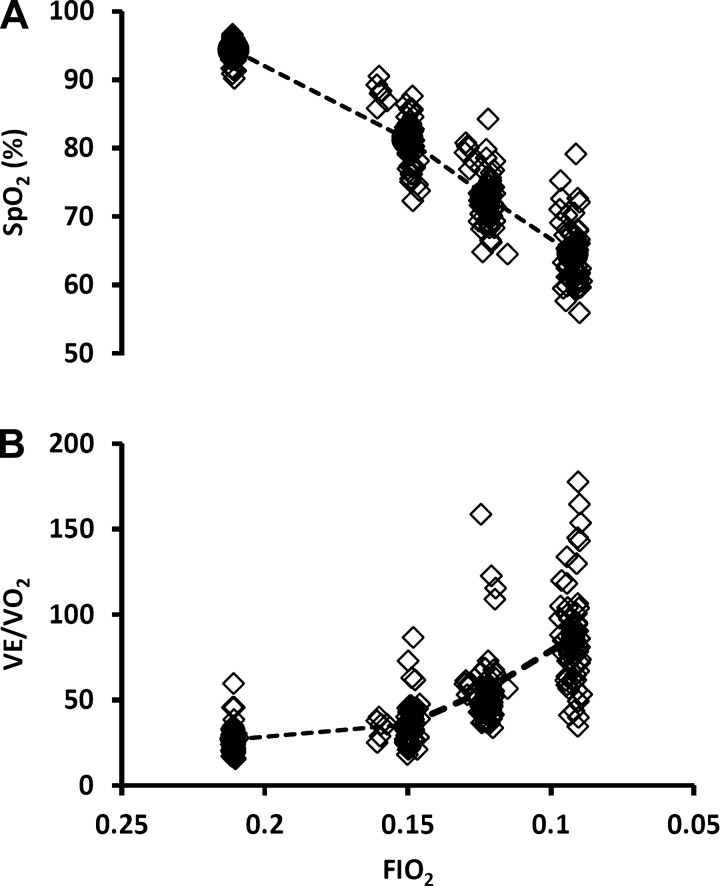
Exposure to graded hypoxia produced progressive reductions in SpO2 (Table 1 and Fig. 2A). At any given Fio2, SpO2 was quite variable among individual subjects. The variation in individual values for SpO2 for any given Fio2 increased with increasing severity of acute hypoxemia, approximating a range of 20% absolute SpO2 at 0.15 Fio2 to 30% at 0.09 Fio2. A similar variability existed in the individual V̇e/V̇o2 responses to hypoxia at any given Fio2 (Fig. 2B). This variation in V̇e/V̇o2 serves as an approximation of variability in alveolar ventilation (V̇a/V̇o2) and therefore in alveolar Po2 at any given Fio2.
Fig. 2.
A: means (circles and dashed line) and individual values (diamonds) depicting decreases in arterial oxygen saturation (SpO2) during graded reductions in Fio2 in all 60 plethysmograph tests, i.e., 2 tests per rat. Note the variability in SpO2 (carotid body stimulus level) for any given Fio2. B: means and individual values showing increases in V̇e/oxygen consumption (V̇o2) during graded reductions in Fio2 (n = 60; 2 tests per rat). Interindividual variation in the ventilatory response (V̇e/V̇o2 for any given Fio2) would be expected to result in widely ranging alveolar Po2, which may explain, at least in part, variation in SpO2.
V̇e vs. SpO2 Dose:Response Relationship
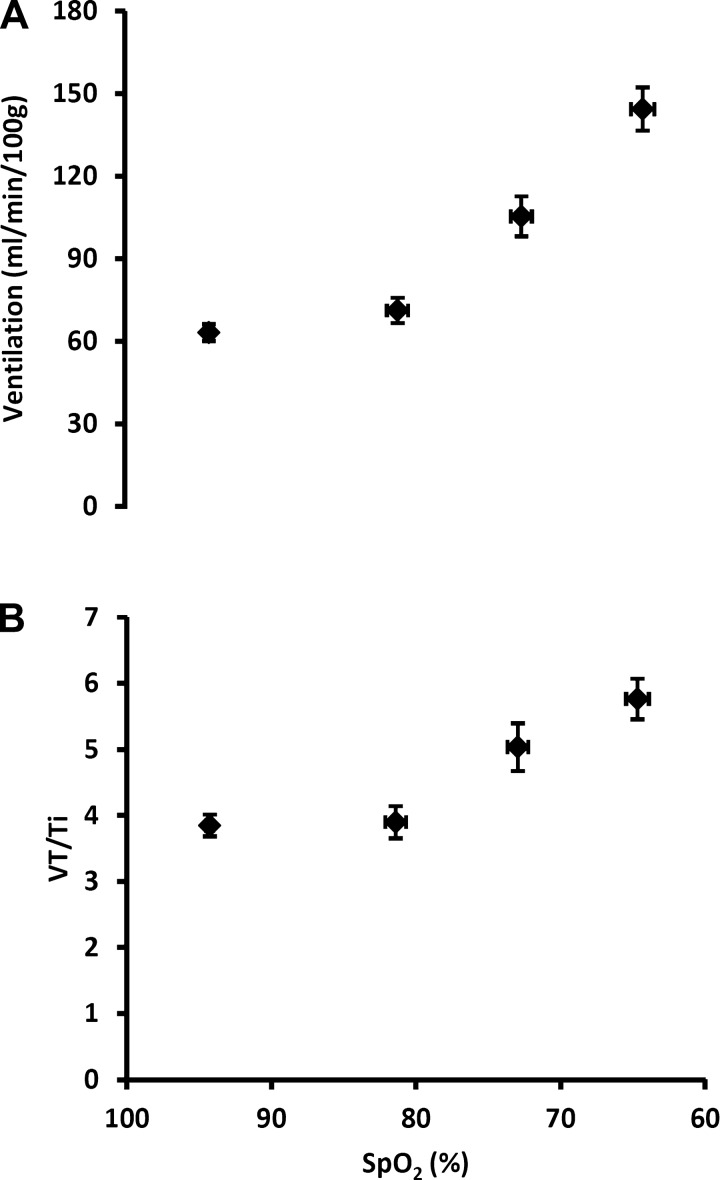
Figure 3 shows the increases in V̇e and VT/Ti produced by exposure to graded hypoxia. Characterizations of the hypoxic dose response are shown with V̇e and VT/Ti plotted vs. SpO2, with SpO2 serving as a surrogate for PaO2, i.e., the carotid body stimulus level.
Fig. 3.
Hypoxia-induced increases in V̇e (a) and VT/Ti (B) plotted vs. SpO2. Values are means ± SE (n = 30; see above).
Metabolic Response to Acute Reductions in Fio2
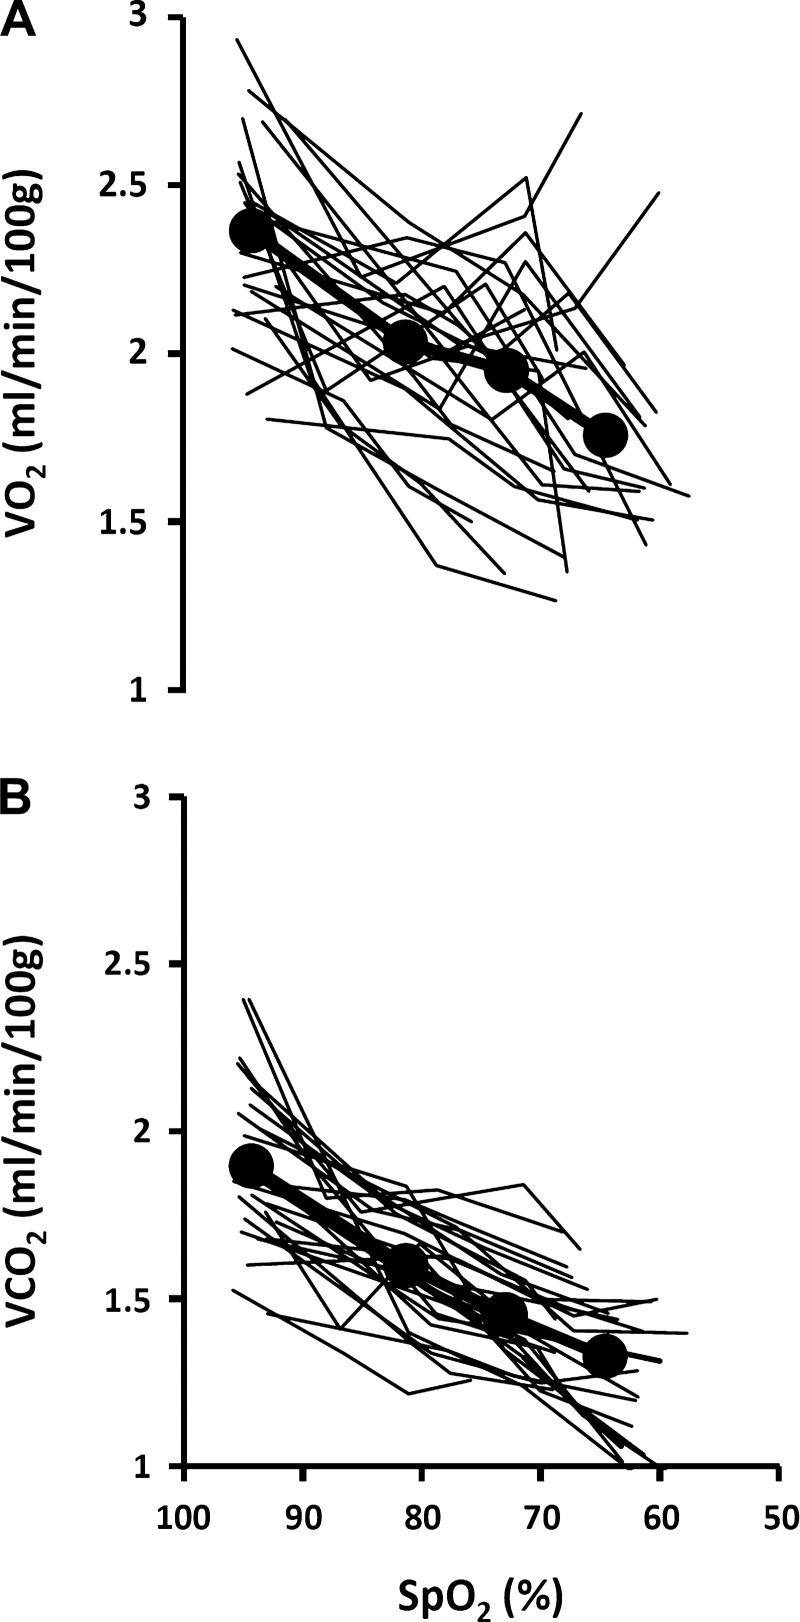
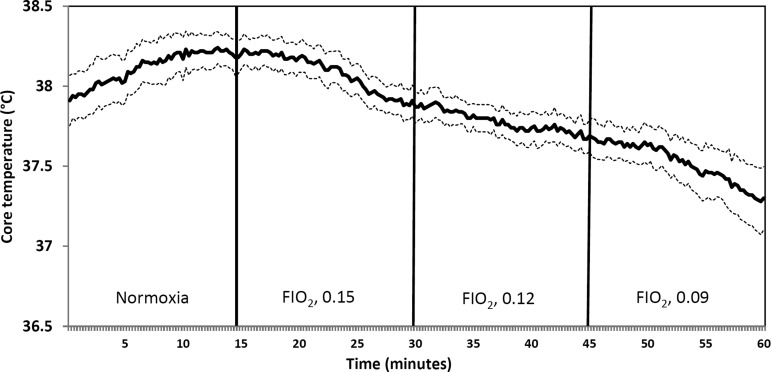
Our rats demonstrated consistent, progressive declines in V̇o2, V̇co2, and core temperature in response to acute hypoxia (Table 1 and Fig. 4, A and B; and Fig. 5). This metabolic change amounted to an average 22 ± 2% (SE) reduction in V̇co2 and a slightly less than 1°C reduction in core temperature at the lowest SpO2.
Fig. 4.
Individual responses and group mean values (circles and heavy lines) for V̇o2 (A) and carbon dioxide production (V̇co2) (B) during exposure to graded hypoxia (n = 30; see above).
Fig. 5.
Core temperature is plotted every 15 s to illustrate the time course of responses to graded reductions in Fio2. Temperature fell within 3–5 min of the transition to a lower Fio2. Data shown are mean values (solid line) and SE (dashed lines) (n = 6).
The time course of this decrease in metabolic rate during exposure to acute hypoxia was examined in more detail using core temperature as a surrogate for V̇co2 (we were not able to make continuous measurements of V̇co2 with our plethysmograph system) (Fig. 5). In six rats with high-fidelity temperature measurements, i.e., the ones with TRM56SP transmitters, we observed stable temperatures over the final 5 min of normoxic baseline period followed by a clear decrease in temperature that occurred within approximately 3–5 min of transition to each lower level of Fio2. This time course of temperature change is consistent with previous findings that the hypoxia-induced reduction in temperature occurred after several minutes of hypoxia (15, 25). These same studies showed that the hypoxia-induced reduction in metabolic rate occurred 1–2 min before the drop in core temperature.
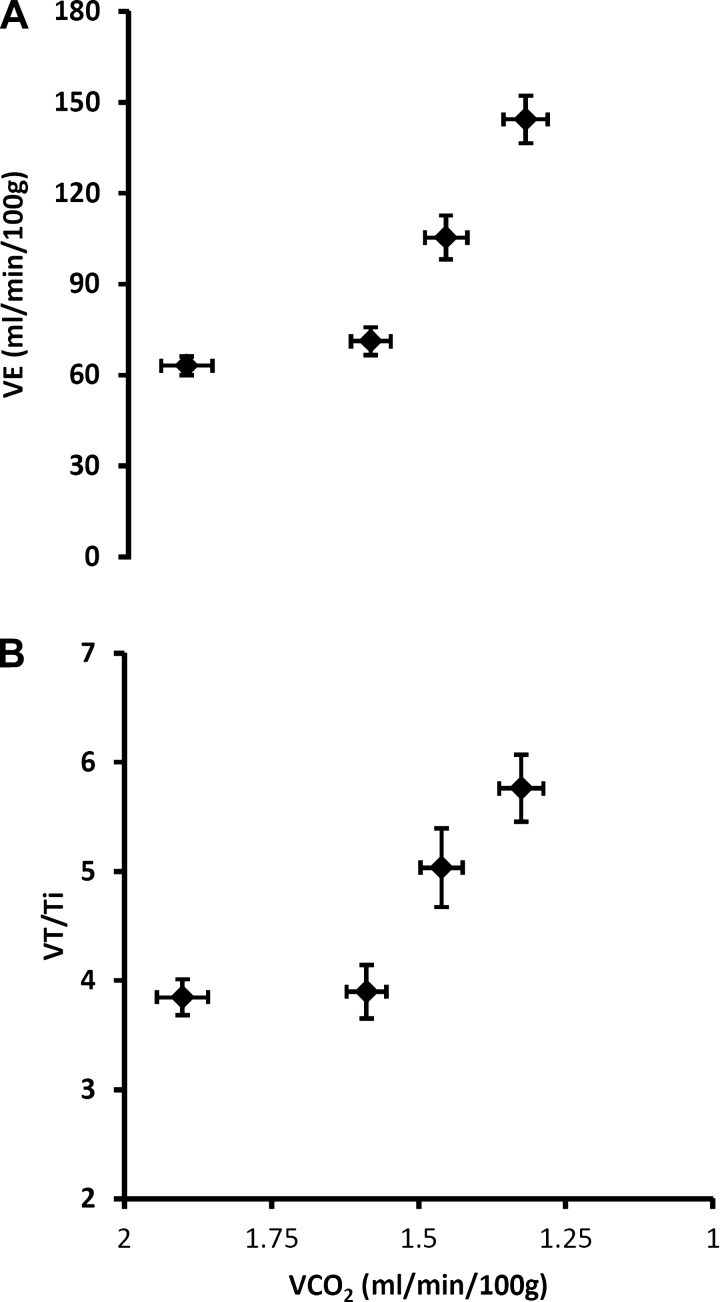
Figure 6 shows increases in V̇e and VT/Ti caused by exposure to acute, graded hypoxia plotted vs. V̇co2. Despite the inhibitory influence of a falling V̇co2, both central respiratory “drive” and V̇e increased in a curvilinear fashion. Thus, at the mildest level of hypoxia, the V̇e/V̇co2 ratio increased through comparable contributions of an increase in V̇e and decrease in V̇co2, whereas at the more severe levels of hypoxia, the increase in V̇e made a relatively greater contribution to the rising V̇e/V̇co2 vs. that contributed from a further steady decline in V̇co2.
Fig. 6.
Acute hypoxia-induced increases in V̇e (A) and central respiratory “drive” (B) are shown in relation to V̇co2 as Fio2 is progressively reduced from 0.21 to 0.09. Hyperventilation is evident, as V̇e increases in a curvilinear fashion despite the falling V̇co2 (see text for further explanation). Values are means ± SE (n = 30; see above).
Cardiovascular Responses to Reduced Fio2
Acute hypoxic exposure produced a fall in arterial pressure. Mean arterial pressure was reduced by nearly 20 mmHg at the most severe level of hypoxia (Table 1). The heart rate response to acute hypoxia was more complex, with a small increase noted during mild hypoxia (Fio2, 0.015), followed by a decrease below baseline at the two more severe levels of hypoxia (Table 1).
Hypoxic Ventilatory Response Characterized by the V̇e/V̇co2 and VT/Ti/V̇co2 vs. SpO2 Relationships
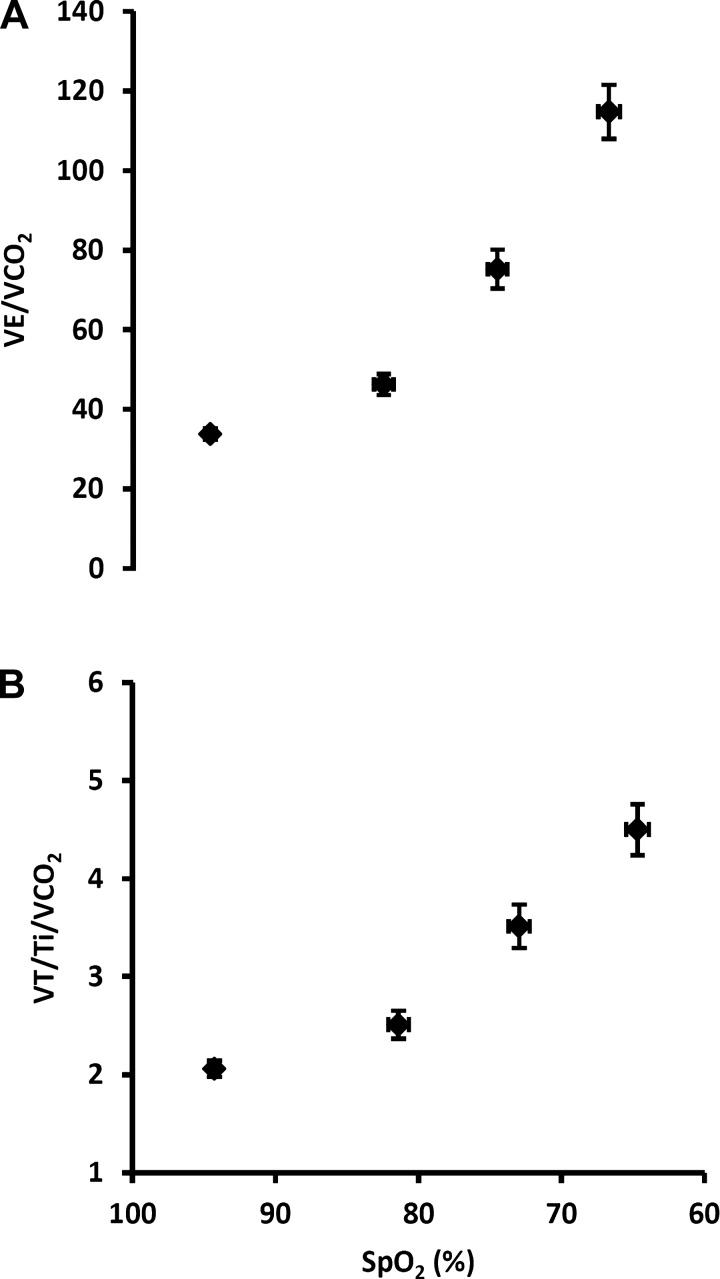
Figure 7 shows what we consider to be optimal characterizations of carotid chemoreceptor hypoxic sensitivity in awake rats. In Fig. 7A, we plot the ventilatory equivalent for V̇co2, which takes into account the important influence of a falling metabolic rate, vs. SpO2, which represents the hypoxic stimulus at the level of the carotid body. Exposure to acute, graded hypoxia caused substantial, progressive increases in the V̇e/V̇co2 vs. SpO2 relationship. Similarly, Fig. 7B shows the effects of acute hypoxia on respiratory “drive” by plotting VT/Ti normalized for V̇co2 vs. SpO2. Acute hypoxia caused progressive increases in the VT/Ti/V̇co2 vs. SpO2 relationship.
Fig. 7.
Ventilatory equivalent for V̇co2 (A) and mean inspiratory flow rate (VT/Ti) normalized for V̇co2 (B) plotted vs. SpO2. We propose that these are the most relevant estimates of peripheral chemoreceptor hypoxic sensitivity in the awake rodent. Values are means ± SE (n = 30; see above).
Reproducibility of the Hypoxic Ventilatory Response
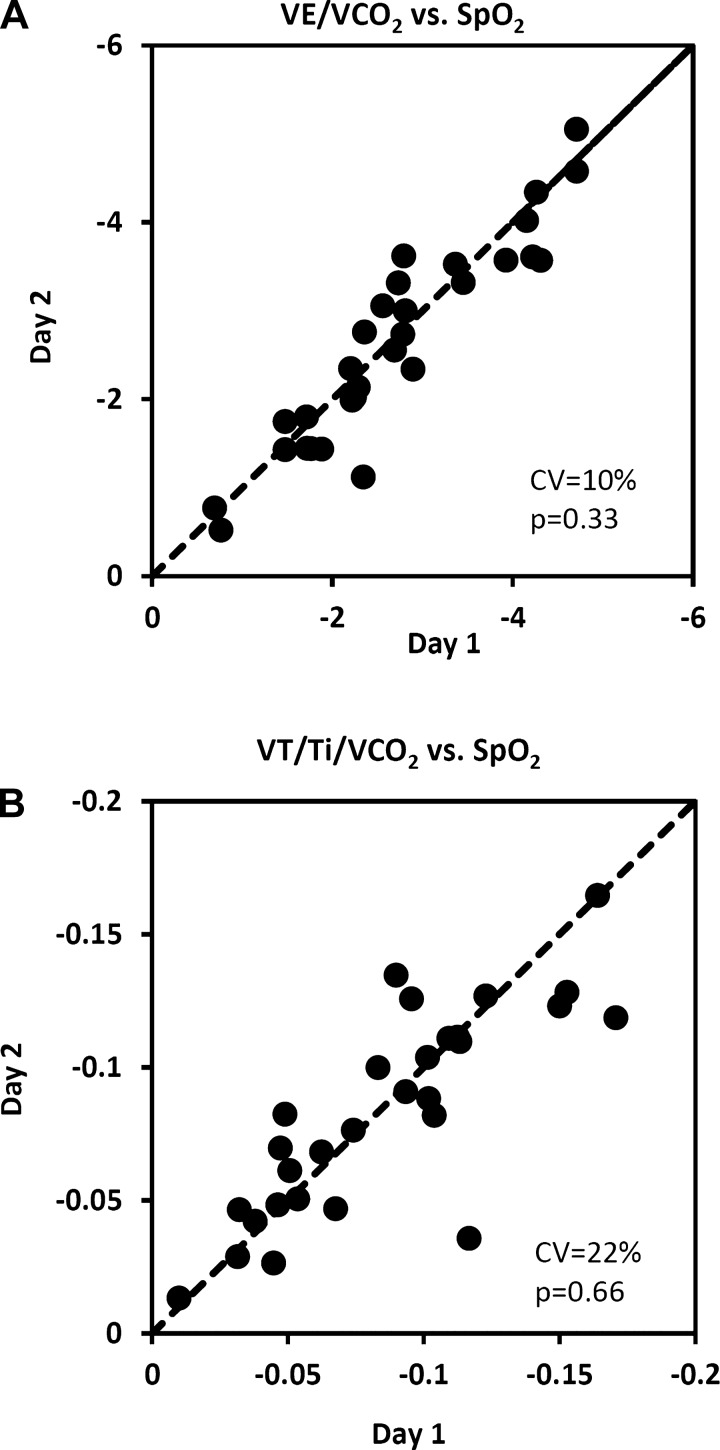
We evaluated day-to-day reproducibility by calculating the slopes of the somewhat linear relationships between ventilatory equivalent for V̇co2 vs. SpO2 and VT/Ti normalized for V̇co2 vs. SpO2. Identity plots of day 1 vs. day 2 slopes are shown in Fig. 8, A and B. No systematic changes between mean values on day 1 vs. day 2 were noted in either of these relationships (P values > 0.05, Table 2). The coefficients of variation indicate that, of these relationships, V̇e/V̇co2 vs. SpO2 was the more reproducible with the smaller day-to-day random error (CV = 10%). Considerably greater random errors were noted with indexes that did not take into account the hypometabolic effect and those in which Fio2 was the stimulus variable (Table 2).
Fig. 8.
Day-to-day reproducibility of the slopes of the relationships between ventilatory equivalent for V̇co2 (A) and mean inspiratory flow rate (VT/Ti) normalized for V̇co2 (B) vs. SpO2 in 30 rats. The dashed line is the line of identity. CV, coefficient of variation; p, P value associated with the paired t-test comparing day 1 mean with day 2 mean.
Table 2.
Measures of the day-to-day reproducibility of several methods for characterizing the hypoxic ventilatory response
| R2 | CV, % | P Value | |
|---|---|---|---|
| V̇e vs. Fio2 | 0.74 | 17 | 0.41 |
| V̇e vs. SpO2 | 0.78 | 15 | 0.67 |
| V̇e/V̇co2 vs. Fio2 | 0.82 | 15 | 0.82 |
| V̇e/V̇co2 vs. SpO2 | 0.85 | 10 | 0.33 |
| V̇e/V̇o2 vs. Fio2 | 0.78 | 22 | 0.10 |
| V̇e/V̇o2 vs. SpO2 | 0.81 | 24 | 0.56 |
| VT/Ti vs. Fio2 | 0.58 | 26 | 0.33 |
| VT/Ti vs. SpO2 | 0.61 | 31 | 0.78 |
| VT/Ti/V̇co2 vs. Fio2 | 0.79 | 25 | 0.53 |
| VT/Ti/V̇co2 vs. SpO2 | 0.81 | 22 | 0.66 |
The slopes of the stimulus:response relationships (linear regression analysis) were used to quantify the responses. We used either Fio2 or SpO2 as the stimulus variable and, for the response variable, either one that took into account hypoxia-induced hypometabolism or one that did not. CV, coefficient of variation; P value, comparison of day 1 and day 2 means by paired t-test.
DISCUSSION
We provide three sets of observations that are of importance to the quantitation of peripheral chemoreceptor hypoxic sensitivity in the awake rodent. First, acute steady-state hypoxia causes highly consistent dose-dependent reductions in V̇o2 and V̇co2 which per se would be expected to reduce alveolar ventilation as much as 25–30% at the most severe level of hypoxemia. Second, for any given Fio2, SpO2 (as a reflection of the circulating chemoreceptor stimulus, PaO2), varies markedly among animals. Third, test-retest (day to day) reproducibility within animals showed a moderate random variation for all indexes of hypoxic responsiveness, with ΔV̇e/V̇co2:ΔSpO2 index showing the smallest random variation. We recommend the use of V̇e/V̇co2 vs. SpO2 and VT/Ti/V̇co2 vs. SpO2 measured over multiple levels of hypoxia as the most relevant estimates of peripheral chemoreceptor hypoxic sensitivity available in the awake rodent.
Defining the Dose:Response Relationship
These recommendations are based on several theoretical considerations. First, the choice of a dose-response index for the hypoxic ventilatory response depends upon the research question. If the question is a very broad one (i.e., how an animal responds to reduced Po2 in the environment), then the appropriate index is clearly the slope of ΔV̇e vs. ΔFio2. This index reflects both hypoxic chemoreceptor sensitivity and accompanying changes in metabolic rate as the major determinants of the hypoxic ventilatory response. If, however, the aim is to quantify the carotid chemoreceptor-mediated ventilatory response to arterial hypoxemia, then the changing “metabolic” determinant of ventilation, i.e., V̇co2, must be accounted for via the use of V̇e/V̇co2 as the response variable. Our justifications for the need to account for these reductions in V̇co2 are the many experiments in humans and animals that support a causative link of respiratory CO2 exchange to proportional changes in alveolar ventilation. These experimental manipulations of V̇co2 have included: 1) diet-induced changes in the respiratory exchange ratio (11, 42); 2) manipulation of “CO2 flow” (blood flow × venous CO2 content) to the lung via the use of extracorporeal gas exchange (44); 3) the use of sinusoidal changes in exercise work rate at varying frequencies (4, 43); and 4) the gradually rising gaseous component of tissue metabolism in the developing chick embryo (24). Correlative evidence suggests that the link of alveolar ventilation to V̇co2 is strongest with the pulmonary exchange of CO2 rather than with the tissue metabolic production of CO2 (24, 25, 43).
Accordingly, in acute hypoxia in the rodent, the accompanying reduction in V̇co2 would be expected, by itself, to elicit a progressive proportional reduction in alveolar ventilation that our data would predict to be more than 20% below control at the most severe level of acute hypoxemia (see Fig. 4). Moreover, many newborn mammals show as much as 50% or more reductions in metabolic rate during acute hypoxia (26). The ventilatory equivalent for V̇o2, i.e., V̇e/V̇o2, is also commonly used to “control” for metabolic rate effects on V̇e, but we know of no experimental evidence directly linking changes in V̇o2, per se, to V̇e. Thus ΔV̇e/ΔV̇co2 vs. SpO2 would appear to be the most appropriate expression of the ventilatory response slope as an index of chemoreceptor responsiveness, although we caution that the exact stimulus and site of action of changes in respiratory CO2 exchange on ventilatory drive remain uncertain (25, 42, 43).
The recommendation to consider the inspiratory volume:time profile or VT/Ti (also standardized for V̇co2), an index of the rate of rise in inspiratory motor output, as a response variable is based on the concept that VT/Ti represents the primary neural drive to inspiration. Changes in minute ventilation, on the other hand, also depend largely on breath timing changes, which in turn are primarily determined by vagal feedback resulting from lung stretch (46). Of course, VT/Ti is also determined by the mechanical properties of the upper airway, lung, and chest wall, so changes in VT/Ti will only accurately reflect inspiratory motor output as represented by the rate of rise of phrenic nerve activity or diaphragm electromyogram under conditions of normal and/or unchanged respiratory mechanics (45).
Defining the stimulus on the x-axis of the dose:response relationship is less straightforward. On the one hand, Fio2 is clearly not the carotid chemoreceptor stimulus, which is best represented in the awake animal by SpO2 as a surrogate for PaO2. On the other hand, SpO2 is clearly not entirely independent of the ventilatory response to hypoxia. Rather, the steady-state value of SpO2 (and PaO2) during hypoxic exposure results primarily from a process of reiteration between stimulus and (ventilatory) response effects on alveolar Po2. This variable effect on alveolar Po2 is indicated by the large interindividual differences in V̇e/V̇o2 (at a given Fio2) which accompanied the variability in SpO2. A further smaller source of variation in SpO2, somewhat independent of PaO2, would be variations in the degree of respiratory alkalosis which, in turn, would shift the HbO2 dissociation curve by variable amounts (see below). Nevertheless, because of the demonstrated interindividual variability in SpO2 for a given Fio2, a quantification of carotid chemoreceptor sensitivity based on SpO2 as the stimulus variable is substantially more precise than one based on Fio2. This consideration would seem especially relevant in case-control comparisons where impairments in pulmonary gas exchange could further alter the Fio2:SpO2 relationship. Validation studies for the rodent pulse oximeter vs. arterial blood gas measurements have shown the device to be quite accurate over a substantial range of SpO2 (35). In our experience, rats tolerate the oximeter collar well, after a minimal amount of training. Finally, we caution that SpO2 is not only determined by PaO2 but will also be influenced by changes in PaCO2, pH, and temperature during hypoxic exposure via changes in position of the HbO2 dissociation curve. Accordingly, although methodologically much more complex in awake rodents, direct multiple sampling of arterial blood (20, 29, 30) would provide more accurate assessment of the chemoreceptor hypoxic sensitivity via quantification of the PaO2 vs. V̇e/V̇co2 dose:response relationship.
Our data highlight the importance of using multiple levels of the stimulus to assess hypoxic chemosensitivity. We observed somewhat curvilinear ventilatory responses, with more substantial increases in the ventilatory response variables occurring at the more severe levels of hypoxemia. With acute hypoxic exposures the ventilatory response represents the net effect of metabolic inhibition vs. carotid chemoreceptor stimulation, with relative domination of the metabolic rate effect at the lesser levels of hypoxemia and domination of the chemoreceptor stimulation of V̇e at the more severe levels of hypoxia (see Fig. 6). These curvilinear ventilatory responses were observed regardless of whether Fio2 or SpO2 was used as the stimulus variable. For this reason, it is not possible to predict the full range of response based on only one level of hypoxia. Interestingly, ventilatory responses were most linear when response variables incorporated the fall in V̇co2 (Fig. 7 vs. Fig. 3). Further, given the apparent differences in influences over the ventilatory response at the various intensities of acute hypoxia, it might be of value to determine the effects of a given perturbation on hypoxic responsiveness by comparing relatively mild vs. more severe levels of acute stimuli.
Complexities/Limitations in Quantifying the Hypoxic Response
We propose that the best index currently available to quantify peripheral chemoreceptor hypoxic sensitivity in the awake, intact rodent is the slope of the ventilatory response, over several levels of steady-state hypoxia, of V̇e/V̇co2 vs. SpO2. In addition to the considerations outlined in the forgoing sections, support for the suitability of this index to define the true chemoreceptor dose response, we note that this response index also showed the smallest amount of within-animal, day-to-day random variation. Nevertheless, several important limitations and complexities must be considered in applying this methodology to defining hypoxic chemoreceptor sensitivity. These are outlined below. We emphasize that the ventilatory and metabolic effects of acute hypoxia we report here pertain only to our protocol in which measurements were made up to 45 min after the initial reduction in Fio2. The pattern and magnitude of effect might well differ with protocols with other patterns of exposure; however, we believe that the basic principles of defining dose response as explained here would apply to other protocols.
Effects of hypocapnia.
It is not possible to continuously monitor and therefore to precisely control end-tidal CO2 (or PaCO2) during exposure to graded hypoxia in awake rodents. Even seemingly minor 1- to 2-mmHg changes in PaCO2 would be expected to have a major inhibitory effect at the level of both the central and peripheral chemoreceptors on the drive to breathe and thus on the slope of the hypoxic ventilatory response (9, 19). Accordingly, the magnitude of the poikilocapnic hypoxic ventilatory responses is determined by both hypoxic and CO2 chemosensitivities and their interactive effects in addition to the magnitude of the hypoxia-induced hypometabolic effects on alveolar ventilation (see below).
Ventilatory effects of hypotension.
As we have previously demonstrated (22), acute exposure to hypoxia causes a fall in arterial pressure in the awake rat (Table 2). This relative hypotension, a response that has also been observed in anesthetized rats (6), would by itself be expected to elicit a baroreflex-induced increase in ventilation (3, 17, 33).
Multiple “extra-chemoreceptor” sites of hypoxic responsiveness.
The hypoxic ventilatory response in the intact animal likely represents more than just the contribution from the carotid chemoreceptors, although intact carotid chemoreceptors appear to be obligatory to the ventilatory response (1, 14, 30). Two additional sources of the hypoxic response include 1) a relatively small but significant dose:response stimulatory effect of central nervous system hypoxia, as illustrated in the intact, unanesthetized animal with carotid chemoreceptors isolated, perfused, and maintained normal while systemic hypoxemia was induced via reductions in Fio2 (7, 10, 41); and 2) a dependence of central CO2 chemosensitivity on the magnitude of carotid chemoreceptor sensory input (2, 8, 18, 32, 37).
Multiple roles for carotid chemoreceptors.
Although we have viewed the hypoxic ventilatory response slope to represent two separate mechanisms, i.e., carotid chemoreceptor responsiveness on the one hand vs. reduced metabolic rate on the other, recent findings suggest that these processes may be causally linked via the sympathetic nervous system response to carotid body stimulation. In recent years, Cannon and Nedergaard (3a) and Morrison (24a) have shown that metabolism and heat production via nonshivering thermogenesis in brown adipose tissue (BAT) are under the control of the sympathetic nervous system. Hypoxic stimulation of arterial chemoreceptor afferents was shown to coincide with a reduction in sympathetic outflow to BAT which, in turn, inhibited nonshivering thermogenesis, thereby contributing to hypoxia-evoked reductions in body temperature and metabolic rate (21). Thus carotid chemoreceptor sensitivity appears likely to have a significant bearing on the slope of the ventilatory response to acute hypoxemia through both its (direct) reflex stimulatory effect on the medullary respiratory pattern generator and also (indirectly) through its inhibitory effect on metabolic rate via withdrawal of sympathetic outflow to BAT.
Accordingly, when carotid chemoreceptor sensitivity changes, such as with chronic intermittent hypoxia (31), chronic constant hypoxia (5, 27, 39), or with reduced blood flow as in chronic heart failure (34), one might expect concomitant changes in both carotid sinus nerve activity and metabolic rate. For example, we recently observed marked reductions in V̇co2 (as well as V̇o2 and body temperature) in normoxia and during acute exposure to graded hypoxia following 3 wk of daily exposure to intermittent hypoxia (unpublished observations). These data are consistent with the metabolic consequences of increased carotid chemoreceptor output; nevertheless, in a previous study of rats exposed to constant moderate hypobaric hypoxia, metabolic rate was also markedly reduced in the initial hours of exposure but gradually returned to normoxic control levels over 3 days of continuous hypoxic exposure (29). That extra-carotid body mechanisms must also contribute to the metabolic inhibitory effects of acute hypoxia has been shown by the metabolism-reducing effect of acute hypoxia even following carotid body denervation (16, 23).
Summary
We have attempted to demonstrate the multiple determinants of the slope of the hypoxic ventilatory response in the unanesthetized, intact rodent. On the one hand, contributions from the inhibitory effects of the accompanying hypocapnia and the additional excitatory effects associated with central nervous system hypoxia, systemic hypotension, and central projections of carotid body sensory input confound the interpretation that the hypoxic response slope exclusively reflects carotid chemosensitivity. We cannot control or account for these relatively minor yet significant influences on the hypoxic response. On the other hand, we suggest that use of V̇e/V̇co2 vs. SpO2 accounts for the major determinants of the hypoxic dose response, i.e., metabolic rate and circulating O2 stimulus level, and we recommend its use for the quantification of carotid chemoreceptor dose:response hypoxic sensitivity in the rodent.
GRANTS
This research was funded by National Heart, Lung, and Blood Institute Grant UO1-HL105365 (to J.M. Dopp).
DISCLOSURES
No conflicts of interest, financial or otherwise, are declared by the author(s).
AUTHOR CONTRIBUTIONS
Author contributions: B.J.M., J.M.D., and J.A.D. conception and design of research; B.J.M. and R.A. performed experiments; B.J.M., R.A., and M.L.B. analyzed data; B.J.M., M.L.B., and J.A.D. interpreted results of experiments; B.J.M. prepared figures; B.J.M. and M.L.B. drafted manuscript; B.J.M., M.L.B., J.M.D., and J.A.D. edited and revised manuscript; B.J.M., R.A., M.L.B., J.M.D., and J.A.D. approved final version of manuscript.
ACKNOWLEDGMENTS
We are grateful to Dr. J. Mortola for insightful discussion of our data. We are also indebted to Dr. E. B. Olson, Jr., and Dr. S. Polishinski and D. Pegelow for assistance with design and operation of the plethysmograph, and to A. Jacques for help with preparation of the manuscript.
REFERENCES
- 1.Bisgard GE, Forster HV, Orr JA, Buss DD, Rawlings CA, Rasmussen B. Hypoventilation in ponies after carotid body denervation. J Appl Physiol 40: 184–190, 1976 [DOI] [PubMed] [Google Scholar]
- 2.Blain GM, Smith CA, Henderson KS, Dempsey JA. Peripheral chemoreceptors determine the respiratory sensitivity of central chemoreceptors to CO2. J Physiol 588: 2455–2471, 2010 [DOI] [PMC free article] [PubMed] [Google Scholar]
- 3.Brunner MJ, Sussman MS, Greene AS, Kallman CH, Shoukas AA. Carotid sinus baroreceptor reflex control of respiration. Circ Res 51: 624–636, 1982 [DOI] [PubMed] [Google Scholar]
- 3a.Cannon B, Nedergaard J. Brown adipose tissue: function and physiological significance. Physiol Rev 84: 277–359, 2004 [DOI] [PubMed] [Google Scholar]
- 4.Casaburi R, Whipp BJ, Wasserman K, Beaver WL, Koyal SN. Ventilatory and gas exchange dynamics in response to sinusoidal work. J Appl Physiol 42: 300–301, 1977 [DOI] [PubMed] [Google Scholar]
- 5.Chen J, He L, Dinger B, Stensaas L, Fidone S. Role of endothelin and endothelin A-type receptor in adaptation of the carotid body to chronic hypoxia. Am J Physiol Lung Cell Mol Physiol 282: L1314–L1323, 2002 [DOI] [PubMed] [Google Scholar]
- 6.Cui F, Gao L, Yuan F, Dong ZF, Zhou ZN, Kline DD, Zhang Y, Li DP. Hypobaric intermittent hypoxia attenuates hypoxia-induced depressor response. PLoS One 7: e41656, 2012 [DOI] [PMC free article] [PubMed] [Google Scholar]
- 7.Curran AK, Rodman JR, Eastwood PR, Henderson KS, Dempsey JA, Smith CA. Ventilatory responses to specific CNS hypoxia in sleeping dogs. J Appl Physiol (1985) 88: 1840–1852, 2000 [DOI] [PubMed] [Google Scholar]
- 8.Dahan A, Nieuwenhuijs D, Teppema L. Plasticity of central chemoreceptors: effect of bilateral carotid body resection on central CO2 sensitivity. PLoS Med 4: e239, 2007 [DOI] [PMC free article] [PubMed] [Google Scholar]
- 9.Daristotle L, Berssenbrugge AD, Bisgard GE. Hypoxic-hypercapnic ventilatory interaction at the carotid body of awake goats. Respir Physiol 70: 63–72, 1987 [DOI] [PubMed] [Google Scholar]
- 10.Dempsey JA, Powell FL, Bisgard GE, Blain GM, Poulin MJ, Smith CA. Role of chemoreception in cardiorespiratory acclimatization to, and deacclimatization from, hypoxia. J Appl Physiol (1985) 116: 858–866, 2014 [DOI] [PMC free article] [PubMed] [Google Scholar]
- 11.Douglas CG, Priestley JG. The regulation of the breathing after the ingestion of sugar. J Physiol 59: 30–36, 1924 [DOI] [PMC free article] [PubMed] [Google Scholar]
- 12.Drorbaugh JE, Fenn WO. A barometric method for measuring ventilation in newborn infants. Pediatrics 16: 81–87, 1955 [PubMed] [Google Scholar]
- 13.Forster HV, Dempsey JA, Birnbaum ML, Reddan WG, Thoden JS, Grover RF, Rankin J. Comparison of ventilatory responses to hypoxic and hypercapnic stimuli in altitude-sojourning lowlanders, lowlanders residing at altitude and native altitude residents. Fed Proc 28: 1274–1279, 1969 [PubMed] [Google Scholar]
- 14.Forster HV, Pan LG, Lowry TF, Serra A, Wenninger J, Martino P. Important role of carotid chemoreceptor afferents in control of breathing of adult and neonatal mammals. Respir Physiol 119: 199–208, 2000 [DOI] [PubMed] [Google Scholar]
- 15.Frappell P, Saiki C, Mortola JP. Metabolism during normoxia, hypoxia and recovery in the newborn kitten. Respir Physiol 86: 115–124, 1991 [DOI] [PubMed] [Google Scholar]
- 16.Gautier H, Bonora M. Ventilatory and metabolic responses to cold and hypoxia in intact and carotid body-denervated rats. J Appl Physiol (1985) 73: 847–854, 1992 [DOI] [PubMed] [Google Scholar]
- 17.Heistad D, Abboud FM, Mark AL, Schmid PG. Effect of baroreceptor activity on ventilatory response to chemoreceptor stimulation. J Appl Physiol 39: 411–416, 1975 [DOI] [PubMed] [Google Scholar]
- 18.Hodges MR, Opansky C, Qian B, Davis S, Bonis JM, Krause K, Pan LG, Forster HV. Carotid body denervation alters ventilatory responses to ibotenic acid injections or focal acidosis in the medullary raphe. J Appl Physiol (1985) 98: 1234–1242, 2005 [DOI] [PubMed] [Google Scholar]
- 19.Hornbein TF, Griffo ZJ, Roos A. Quantitation of chemoreceptor activity: interrelation of hypoxia and hypercapnia. J Neurophysiol 24: 561–568, 1961 [DOI] [PubMed] [Google Scholar]
- 20.Lee EJ, Woodske ME, Zou B, O'Donnell CP. Dynamic arterial blood gas analysis in conscious, unrestrained C57BL/6J mice during exposure to intermittent hypoxia. J Appl Physiol (1985) 107: 290–294, 2009 [DOI] [PMC free article] [PubMed] [Google Scholar]
- 21.Madden CJ, Morrison SF. Hypoxic activation of arterial chemoreceptors inhibits sympathetic outflow to brown adipose tissue in rats. J Physiol 566: 559–573, 2005 [DOI] [PMC free article] [PubMed] [Google Scholar]
- 22.Marcus NJ, Olson EB, Bird CE, Philippi NR, Morgan BJ. Time-dependent adaptation in the hemodynamic response to hypoxia. Respir Physiol Neurobiol 165: 90–96, 2009 [DOI] [PMC free article] [PubMed] [Google Scholar]
- 23.Matsuoka T, Dotta A, Mortola JP. Metabolic response to ambient temperature and hypoxia in sinoaortic-denervated rats. Am J Physiol Regul Integr Comp Physiol 266: R387–R391, 1994 [DOI] [PubMed] [Google Scholar]
- 24.Menna TM, Mortola JP. Metabolic control of pulmonary ventilation in the developing chick embryo. Respir Physiol Neurobiol 130: 43–55, 2002 [DOI] [PubMed] [Google Scholar]
- 24a.Morrison SF. 2010 Carl Ludwig Distinguished Lectureship of the APS Neural Control and Autonomic Regulation Section. Central neural pathways for thermoregulatory cold defense. J Appl Physiol (1985) 110: 1137–1149, 2011 [DOI] [PMC free article] [PubMed] [Google Scholar]
- 25.Mortola J, Gautier H. Interaction between metabolism and ventilation: effects of respiratory gases and temperature. In: Regulation of Breathing, edited by Dempsey J, Pack AI. New York: Dekker, 1994, p. 1011–1064 [Google Scholar]
- 26.Mortola JP, Rezzonico R, Lanthier C. Ventilation and oxygen consumption during acute hypoxia in newborn mammals: a comparative analysis. Respir Physiol 78: 31–43, 1989 [DOI] [PubMed] [Google Scholar]
- 27.Nielsen AM, Bisgard GE, Vidruk EH. Carotid chemoreceptor activity during acute and sustained hypoxia in goats. J Appl Physiol (1985) 65: 1796–1802, 1988 [DOI] [PubMed] [Google Scholar]
- 28.Olson EB. Physiological dead space increases during initial hours of chronic hypoxemia with or without hypocapnia. J Appl Physiol (1985) 77: 1526–1531, 1994 [DOI] [PubMed] [Google Scholar]
- 29.Olson EB, Dempsey JA. Rat as a model for humanlike ventilatory adaptation to chronic hypoxia. J Appl Physiol 44: 763–769, 1978 [DOI] [PubMed] [Google Scholar]
- 30.Olson EB, Vidruk EH, Dempsey JA. Carotid body excision significantly changes ventilatory control in awake rats. J Appl Physiol (1985) 64: 666–671, 1988 [DOI] [PubMed] [Google Scholar]
- 31.Peng Y, Kline DD, Dick TE, Prabhakar NR. Chronic intermittent hypoxia enhances carotid body chemoreceptor response to low oxygen. Adv Exp Med Biol 499: 33–38, 2001 [DOI] [PubMed] [Google Scholar]
- 32.Rodman JR, Curran AK, Henderson KS, Dempsey JA, Smith CA. Carotid body denervation in dogs: eupnea and the ventilatory response to hyperoxic hypercapnia. J Appl Physiol (1985) 91: 328–335, 2001 [DOI] [PubMed] [Google Scholar]
- 33.Saupe KW, Smith CA, Henderson KS, Dempsey JA. Respiratory and cardiovascular responses to increased and decreased carotid sinus pressure in sleeping dogs. J Appl Physiol (1985) 78: 1688–1698, 1995 [DOI] [PubMed] [Google Scholar]
- 34.Schultz HD, Li YL, Ding Y. Arterial chemoreceptors and sympathetic nerve activity: implications for hypertension and heart failure. Hypertension 50: 6–13, 2007 [DOI] [PubMed] [Google Scholar]
- 35.Strohl K, Baekey D, Dase S, Hete B. Validation of the MouseOx Arterial Oxygen Saturation Measurements. Starr Life Sciences, 2007 [Google Scholar]
- 36.Sun SY, Wang W, Zucker IH, Schultz HD. Enhanced activity of carotid body chemoreceptors in rabbits with heart failure: role of nitric oxide. J Appl Physiol (1985) 86: 1273–1282, 1999 [DOI] [PubMed] [Google Scholar]
- 37.Takakura AC, Moreira TS, Colombari E, West GH, Stornetta RL, Guyenet PG. Peripheral chemoreceptor inputs to retrotrapezoid nucleus (RTN) CO2-sensitive neurons in rats. J Physiol 572: 503–523, 2006 [DOI] [PMC free article] [PubMed] [Google Scholar]
- 38.Timmers HJ, Wieling W, Karemaker JM, Lenders JW. Denervation of carotid baro- and chemoreceptors in humans. J Physiol 553: 3–11, 2003 [DOI] [PMC free article] [PubMed] [Google Scholar]
- 39.Wang ZY, Olson EB, Bjorling DE, Mitchell GS, Bisgard GE. Sustained hypoxia-induced proliferation of carotid body type I cells in rats. J Appl Physiol (1985) 104: 803–808, 2008 [DOI] [PubMed] [Google Scholar]
- 40.Weil JV, Byrne-Quinn E, Sodal IE, Friesen WO, Underhill B, Filley GF, Grover RF. Hypoxic ventilatory drive in normal man. J Clin Invest 49: 1061–1072, 1970 [DOI] [PMC free article] [PubMed] [Google Scholar]
- 41.Weizhen N, Engwall MJ, Daristotle L, Pizarro J, Bisgard GE. Ventilatory effects of prolonged systemic (CNS) hypoxia in awake goats. Respir Physiol 87: 37–48, 1992 [DOI] [PubMed] [Google Scholar]
- 42.Whipp B. Control of exercise hyperpnea: the unanswered question. In: Integration of Respiratory Control, edited by Poulin MJ, Wilson RJ. New York: Springer, 2008, p. 16–24 [Google Scholar]
- 43.Whipp BJ. The coupling of ventilation to pulmonary gas exchange during exercise. In: Respiratory Physiology and Pathophysiology of Exercise, edited by Whipp B, Wasserman K. New York: Dekker, 1991, p. 271–307 [Google Scholar]
- 44.Yamamoto WS, Edwards MW. Homeostasis of carbon dioxide during intravenous infusion of carbon dioxide. J Appl Physiol 15: 807–818, 1960 [DOI] [PubMed] [Google Scholar]
- 45.Younes M, Milic-Emili J, Whitelaw W, Grassino A. Measurement and testing of respiratory drive. In: Regulation of Breathing, edited by Hornbein T. New York: Dekker, 1981, p. 675–730 [Google Scholar]
- 46.Younes M, Remmers J. Control of tidal volume and respiratory frequency. In: Regulation of Breathing, edited by Hornbein T. New York: Dekker, 1981, p. 621–665 [Google Scholar]


