

Abstract
Nasal delivery of lung targeted pharmaceutical aerosols is ideal for drugs that need to be administered during high flow nasal cannula (HFNC) gas delivery, but based on previous studies losses and variability through both the delivery system and nasal cavity are expected to be high. The objective of this study was to assess the variability in aerosol delivery through the nose to the lungs with a nasal cannula interface for conventional and excipient enhanced growth (EEG) delivery techniques. A database of nasal cavity computed tomography (CT) scans was collected and analyzed, from which four models were selected to represent a wide range of adult anatomies, quantified based on the nasal surface area-to-volume ratio (SA/V). Computational fluid dynamics (CFD) methods were validated with existing in vitro data and used to predict aerosol delivery through a streamlined nasal cannula and the four nasal models at a steady state flow rate of 30 L/min. Aerosols considered were solid particles for EEG delivery (initial 0.9 μm and 1.5 μm aerodynamic diameters) and conventional droplets (5 μm) for a control case. Use of the EEG approach was found to reduce depositional losses in the nasal cavity by an order of magnitude and substantially reduce variability. Specifically, for aerosol deposition efficiency in the four geometries, the 95% confidence intervals (CI) for 0.9 and 5 μm aerosols were 2.3-3.1 and 15.5-66.3%, respectively. Simulations showed that the use of EEG as opposed to conventional methods improved delivered dose of aerosols through the nasopharynx, expressed as penetration fraction (PF), by approximately a factor of four. Variability of PF, expressed by the coefficient of variation (CV), was reduced by a factor of four with EEG delivery compared with the control case. Penetration fraction correlated well with SA/V for larger aerosols, but smaller aerosols showed some dependence on nasopharyngeal exit hydraulic diameter. In conclusion, results indicated that the EEG technique not only improved lung aerosol delivery, but largely eliminated variability in both nasal depositional loss and lung PF in a newly developed set of nasal airway models.
Keywords: Nasal variability, nasal aerosol deposition, controlled condensational growth, submicrometer aerosols, excipient enhanced growth, respiratory drug delivery
1. Introduction
Delivering inhaled medications to the lungs from a nasal interface has a number of advantages (Ari et al., 2011; Bhashyam et al., 2008; Dhand, 2012). For medications with long delivery times, frequent dosing routines, or those that require continuous nebulization, nose-to-lung delivery with a nasal cannula interface allows for convenient hands-free administration. Considering patients receiving noninvasive ventilation (NIV) with a nasal interface, high flow nasal cannula (HFNC) or low flow nasal cannula (LFNC) gas delivery, and continuous positive airway pressure (CPAP), nose-to-lung delivery allows for simultaneous administration of the aerosol and ventilation gas. Noninvasive ventilation, HFNC and LFNC gas delivery, and CPAP are increasingly popular forms of respiratory support (Aboussouan & Ricaurte, 2010; Brochard et al., 1995; Dhand, 2012; Lee et al., 2013; Lightowler et al., 2003; Parke et al., 2011; Ram et al., 2004). With each of these gas delivery systems, a nasal interface is typically implemented. Simultaneous administration of aerosol therapy through a nasal interface during gas delivery is needed so that the supply of gas does not need to be halted for the patient to receive respiratory medicines (Dhand, 2012).
A potential disadvantage of nose-to-lung aerosol delivery is the expected high depositional loss in the nasal cavity with conventional pharmaceutical aerosols. It is well known that one function of the nose is to filter inhaled particles. The deposition of toxicological and pharmaceutical aerosols in the nasal cavity has been assessed or reviewed by numerous in vivo (Bennett & Zeman, 2005; Cheng, 2003; Stahlhofen et al., 1989; Swift & Strong, 1996), in vitro (Garcia et al., 2009; Golshahi et al., 2011; Guilmette et al., 1994; Kelly et al., 2004a, 2004b; Longest et al., 2011; Storey-Bishoff et al., 2008), and in silico (Inthavong et al., 2011; Kimbell et al., 2007; Liu et al., 2007; Schroeter et al., 2006; Schroeter et al., 2011; Shanley et al., 2008; Shen et al., 2004; Xi & Longest, 2008b; Xi et al., 2011) studies. The results of these various studies typically provide correlations that can be used to estimate the deposition of aerosols in the nasal cavity. For example, pharmaceutical nebulizers generate droplets in the size range of 3-7 μm (Finlay, 1998; Kuhli et al., 2009). Considering a 5 μm aerosol inhaled through the nose with an airflow of 30 LPM, the in vitro study of Kelly et al. (2004b) predicts an average deposition of 40% based on nasal models created from a single subject. Under identical aerosol conditions, the in vivo nasal deposition correlation of Stahlhofen et al. (1989), which represents average deposition taken over multiple studies, predicts 80% nasal deposition. Based on a large majority of nasal deposition data, aerosol losses in the nasal cavity are unacceptably high for conventional aerosols delivered at typical nasal inhalation flow rates to achieve efficient nose-to-lung drug delivery.
In addition to high nasal losses, significant aerosol deposition is also expected in the delivery system and nasal interface during nose-to-lung administration. Studies by Bhashyam et al. (2008) and Ari et al. (2011) considered aerosol delivery through nasal cannulas with flow rates in the range of 3-6 LPM. Both studies reported depositional losses in the delivery system in the range of 75-98%, which did not include losses in a nasal cavity geometry. Longest et al. (2013b) reported the delivery of a nebulized aerosol with a mass median aerodynamic diameter (MMAD) of 4.7 μm through a commercial adult large bore nasal cannula (Optiflow; Fisher & Paykel, Irvine, CA) at a flow rate of 20 LPM. Depositional losses in the cannula plus 20 cm of inlet tubing based on in vitro experiments and computational fluid dynamics (CFD) simulations were 67.6 and 74.2%, respectively. As with nasal depositional losses, aerosol deposition in the delivery system circuit makes nose-to-lung delivery of conventional sized aerosols highly inefficient.
Controlled condensational growth is a newly proposed technique that significantly reduces aerosol losses in the extrathoracic region and ensures deposition of the aerosol in the lungs (Hindle & Longest, 2010, 2012; Longest & Hindle, 2010, 2011). With this approach, submicrometer aerosols are delivered to the nose or mouth to minimize extrathoracic deposition of the particles or droplets (Cheng, 2003; Xi & Longest, 2008a, 2008b). Size increase of the aerosol in the airways is then fostered by either the inclusion of a hygroscopic excipient in the particles or droplets (excipient enhanced growth, EEG) (Hindle & Longest, 2012), or the generation of supersaturated airway conditions (enhanced condensational growth, ECG) (Tian et al., 2011). Recent studies have illustrated highly efficient nose-to-lung delivery with condensational growth. For example, Longest et al. (2011) implemented an ECG technique and demonstrated a reduction in nose-mouth-throat (NMT) loss from approximately 70% with a conventional aerosol to 15% based on in vitro experiments and CFD simulations. Matching the aerosol and humidity delivery airflow rates further reduced NMT depositional losses to 5% in CFD simulations. Golshahi et al. (2013) recently considered both EEG and ECG techniques applied to nose-to-lung aerosol administration under steady flow conditions consistent with a high flow nasal cannula. Both condensational growth techniques resulted in <1% cannula deposition and <3% NMT deposition, which were significantly improved compared to conventional sized aerosols, with lung delivery efficiencies near 80%. The study of Golshahi et al. (2013) included a streamlined nasal cannula interface, which was previously designed to maximize aerosol delivery during HFNC gas delivery (Longest et al., 2013a; Longest, et al., 2013b). With both EEG and ECG delivery, continuous growth of the aerosol is expected as it travels through the conducting airways with final size increase to the range of conventional pharmaceutical aerosols (Hindle & Longest, 2012; Longest & Hindle, 2011, 2012; Longest et al., 2012; Tian, et al., 2011).
While condensational growth has previously been demonstrated to reduce depositional losses in the extrathoracic region, variability in deposition is also an important factor. Variability in lung delivery of inhaled medications should be as low as possible so that all patients in a population receive the prescribed dosage within an acceptable range. With pharmaceutical aerosols for oral inhalation, the drug mass that is not lost in the extrathoracic airways is typically delivered to the lungs and retained. Based on a number of studies, the mouth throat (MT) geometry is known to be highly variable (Grgic et al., 2004; McRobbie et al., 2003; McRobbie & Pritchard, 2005; Pritchard & McRobbie, 2004). It is expected that high MT deposition from an oral inhaler produces large intersubject variability in MT deposition and corresponding variability in lung delivery across a population of subjects. Borgstrom et al. (2006) demonstrated more directly that high MT deposition produces large variability in lung delivery, and conversely that variability is much less for low MT deposition. Therefore, lung delivery variability during oral inhalation can be minimized by minimizing MT depositional losses. With orally inhaled products, the lowest reported MT deposition for pharmaceutical inhalers was approximately 40% correlating to a lung deposition variability of 10-20% (coefficient of variation) (Borgstrom, et al., 2006). For conventional sized aerosols and oral inhalation, Clark and Hartman (2012) recently demonstrated that the central to peripheral lung deposition ratio across a population of subjects varied by a factor of 4-fold. These results imply that targeting aerosol deposition within the airways is even more difficult when considering delivery across a population of subjects.
Compared with variability in MT deposition following oral inhalation (Grgic, et al., 2004), intersubject variability in nasal aerosol deposition (Garcia, et al., 2009; Golshahi et al., 2012; Stahlhofen, et al., 1989) is potentially higher. A number of studies have directly addressed variability in the nasal deposition of aerosols (Garcia, et al., 2009; Golshahi, et al., 2011; Storey-Bishoff, et al., 2008). Considering the study of Golshahi et al. (2011), nasal deposition of a conventional 5 μm particle inhaled at 15 LPM can vary from 20-80% in adults and 20-60% in children. Recent studies have demonstrated that plots of deposition fraction in terms of pressure drop or non-dimensional numbers, including the Stokes and Reynolds numbers with flow and anatomy defined critical dimensions, collapse the data onto a single curve. This correlation-based approach is extremely useful for estimating depositional losses in the nasal cavity as a function of relevant parameters. However, it often hides the very high intersubject variability that is present with the nasal inhalation of aerosols. Nasal studies that consider more than one model or subject demonstrate that variability in nasal deposition is decreased with decreased nasal deposition. This observation is consistent with the study of Borgstrom et al. (2006) for oral inhalation where decreasing the MT deposition decreased variability in lung delivery. As a result, controlled condensational growth techniques should reduce nasal deposition variability compared with conventional aerosols, thereby leading to more reproducible lung dose across a population. However the amount of variability in nasal deposition occurring with controlled condensational growth is currently not known. Estimates of nasal deposition and variability with current correlations may be inadequate based on the dynamic size increase of the aerosol in the nasal airways using the condensational growth methods.
The objective of this study is to assess the variability in aerosol delivery through the nose to the lungs from a nasal cannula interface for conventional and EEG aerosol sizes. To assess variability in nasal aerosol deposition, a previously implemented nasal geometry with a relatively open nasal passage (Golshahi, et al., 2013; Longest, et al., 2011; Xi & Longest, 2008b) was implemented along with three new models that span a broad range of surface area to volume ratios. Conventional size nebulized droplets and submicrometer EEG combination particle aerosols are delivered to the four nasal geometries using a previously developed (Longest, et al., 2013a) streamlined nasal cannula. A CFD model of aerosol size change and deposition is first validated using comparisons with previous in vitro data (Golshahi, et al., 2013) in a NMT geometry. The CFD model is then applied to simulate transport and deposition of the conventional and submicrometer EEG aerosols in the four nasal geometries. Results are presented in order to characterize the geometric and flow field conditions of the four nasal geometries, predict deposition based on existing correlations, and predict deposition based on the CFD model simulations including aerosol size change. Deposition fractions and efficiencies are presented in terms of the nasal cannula and the nasal geometry. For effective nose-to-lung delivery, low nasal deposition is required as well as low variability in nasal deposition values and consistent lung delivery. It is expected that EEG delivery with submicrometer aerosols will be able to achieve less than 15% device and nasal depositional loss with a range in deposition fraction values of less than 10% across the four models considered.
2. Methods
2.1 Development of Nasal Geometries
To test variability in the delivery of aerosols through the nose to the lungs, an anatomical dataset was assembled that consisted of pre-existing adult computed tomography (CT) scans compiled for this study and from published sources. A set of 31 CT scans from VCU Medical Center was procured using a previously approved IRB protocol for pre-existing data. The in-house scans were produced by a SIEMENS Sensation 16 scanner with a slice thickness ranging from 0.4 mm to 1.5 mm and each included the entire nasal cavity. An otolaryngologist checked the scans for any morphological defects. The number of scans selected for use in the dataset was reduced from 31 to 12 after scans were disqualified due to low resolution (scan thickness > 1.0 mm) or obvious anatomical defects that were noted by the otolaryngologist. The final set consisted of 3 males and 9 females, with ages ranging from 19-60 years, heights between 150-180 cm, and weights between 45-95 kg. CT scan data was then extracted into a 3D surface file using the commercial software package MIMICS (Materialise, Belgium). A feature of the software allowed for surface area and volume measurements to be calculated, which were evaluated within the airspace between the nasal valve area and the septum.
The regional definition of the nasal cavity boundaries varies in the literature (Garcia, et al., 2009; Liu et al., 2009; Segal et al., 2008; Taylor et al., 2010; Xi et al., 2012; Yokley, 2006; Zhu et al., 2011), so only studies that measured surface area to volume ratios (SA/V) from the nasal valve area to the septum (Garcia, et al., 2009; Xi, et al., 2012; Yokley, 2006) were considered for consistent comparisons. CT scan data set measurements were adopted from an anthropological study by Yokley (2006) on nasal cavity evolution (n = 49), a study by Garcia et al. (2009) regarding intersubject nasal filtration variability (n = 4), and a study by Xi et al. (2012) concerning ultrafine particle deposition in nasal-laryngeal airways from different age groups (where only the adult model was used for this study). The SA/V values from Yokley (2006) were measured by only considering the least congested nasal passage to eliminate the transient effect of nasal cycling, which is known to produce a difference in airway dimensions at nearly all times (Lang et al., 2003). However, Garcia et al. (2009) and Xi et al. (2012) used an approach that included the measurements of both sides. Considering the CT scans collected for this study, the SA/V values were measured considering only the least congested side, similar to Yokley (2006). The overall effect of this minor discrepancy was not expected to be large enough to merit exclusion of the data from Garcia et al. (2009) and Xi et al. (2012). The complete database from both collected CT scans and published sources included 66 adult subjects, though the sex demographics were largely unknown because the literature data frequently did not include this information.
Analysis of the collected dataset describing 66 subjects yielded an average SA/V value of 1.07 ± 0.24 mm-1, and ideally the models chosen would cover two standard deviations from the mean (95% of the variation) or a range of values 0.59-1.55 mm-1 from a normal distribution. A complete test of the dataset for normality was not possible, since the data from Yokley (2006) was only given as a mean and a standard deviation, but a Shapiro Wilk test performed on the rest of the dataset (n = 17) did not show any significant deviation from normality (p = 0.21). The dataset did not include models to cover this desired range exactly. Selection among the available models covered a SA/V range of 0.74-1.42 mm-1, which theoretically should approximate 84% of the variation from a normal distribution, which represents a large fraction of the population. The four nasal models chosen to represent the range of variability in SA/V measurements are depicted in Fig. 1, and each includes nostrils, the nasal cavity, the nasopharynx, and the streamlined nasal cannula attached to a tube with a 90° bend. Coronal cross sections of each model are shown in four different regions: (1) termination of the nasal valve area, (2) nasal cavity with two meatuses, (3) nasal cavity with three meatuses, and (4) entrance to the nasopharynx. The four models were named ‘Open’, ‘Average’, ‘Constricted1’, and ‘Constricted2’, with values of surface area (SA), volume (V), SA/V, minimum coronal cross-sectional hydraulic diameter of the nasal cavity (dh,min), average nostril entrance hydraulic diameter (dh,nostril), and nasopharynx exit hydraulic diameter (dh,nasopharynx), shown in Table 1. All of the models were derived from VCU Medical Center CT scans, except for the ‘Open’ geometry, which has been frequently used with in vitro (Golshahi, et al., 2013; Longest, et al., 2011) and CFD studies (Golshahi, et al., 2013; Longest, et al., 2011; Xi & Longest, 2008b) and represents the lower limit of the SA/V values.
Fig.1.

Four nasal models denoted (a) Open, (b) Average, (c) Constricted1, and (d) Constricted2. Coronal cross-sectional Regions (1 to 4) are depicted, beginning with the termination of the nasal valve area (1), followed by regions showing two and three meatuses (2 and 3, respectively), and ending with the entrance to the nasopharynx (4). The tube and nasal cannula used with each model is illustrated in part (e).
Table 1.
Geometric measurements of each nasal model, including surface area (SA), volume (V), surface area-to-volume ratio (SA/V), minimum nasal cavity hydraulic diameter (dh,min), average nostril hydraulic diameter (dh,nostril), and nasopharynx hydraulic diameter (dh,nasopharynx).
| SA (mm2) | V (mm3) | SA/V (mm-1) | dh,min (mm) | dh,nostril (mm) | dh,nasopharynx (mm) | |
|---|---|---|---|---|---|---|
| Open | 8024.20 | 10832.35 | 0.74 | 3.83 | 12.06 | 5.94 |
| Average | 10509.34 | 10488.66 | 1.00 | 2.81 | 11.44 | 9.74 |
| Constricted1 | 8237.14 | 7194.61 | 1.14 | 2.40 | 11.21 | 5.87 |
| Constricted2 | 9661.46 | 6790.42 | 1.42 | 1.98 | 13.00 | 8.78 |
The 3D surface files extracted from the Average, Constricted1, and Constricted2 models were exported as .stl files, a surface file type often used in rapid prototyping. In order to import these files into a CAD software package, the files were converted into a volumetric file type (.igs) using the mesh development software 3-Matic (Materialise, Belgium). These files were then imported into the CAD software package SolidWorks 2011 (Dassault Systèmes Solidworks Corp., Waltham, MA) for further modification. The inlets of the nostril airspaces were truncated to produce a flat surface that would be compatible with a velocity inlet for a computational mesh. The plane of truncation was chosen in each case to minimize the amount of airspace removed. Additionally, the exit of the nasopharynx was truncated to produce a flat outlet surface, where the slicing plane was chosen to be perpendicular to the direction of flow. Numerical extensions were added to each of the three models through extrusions of the outlet cross section by 10 hydraulic diameter lengths. Regarding the Open model, it was initially available through GAMBIT 2.4 (ANSYS Inc., Canonsburg, PA), and after small modifications to the nostril outlets to produce a flat surface, it was imported into SolidWorks using a parasolid (.x_t) file format.
A previously developed (Longest, et al., 2013a) streamlined nasal cannula was added to the four models, along with a 20 cm inlet tube that was shaped into a 90° bend and positioned on a plane perpendicular to gravity (Fig. 1e). The tube was imported from GAMBIT into Solidworks, as described above, and then the nasal prongs were placed into each nostril in a manner that maximized the space between the nostril and cannula walls, yet maintained an orientation that allowed for delivery of the aerosol to the middle region of the nasal cavity. Some enlargement of the nostril region was necessary to accommodate the cannula in two of the models, which seems reasonable given that nostrils are flexible and would expand if nasal prongs larger than the unstressed nares were inserted. However, as is consistent with HFNC gas delivery, each model remained an open system since enlargement was only necessary in a few select locations along the perimeter of the oblong nostril openings. Realistic wall thickness of the cannula was considered unimportant for flow determination and a potential obstacle for mesh development, and thus the wall was modeled with an infinitesimal thickness.
In addition to the four nasal models described above that represent a range of SA/V ratios (i.e. constriction), a model of the NMT region was considered for comparison to existing in vitro results in order to validate the CFD model predictions of deposition. This NMT geometry consisted of the Open nasal model combined with a CT scan model of the mouth and throat as previously described and evaluated in the study of Golshahi et al. (2013). In the previous study of Golshahi et al. (2013), the same cannula and flow rates were considered as in the current study for control and EEG aerosol formulations. Previous CFD simulations of these conditions matched the in vitro results to a high degree in terms of aerosol size change and depositional loss. However, minor modifications to the meshing approach and boundary conditions made in the current study require new validations of the CFD predictions.
2.2 Mesh Development
The computational meshes for each model, including the new mesh of the NMT model from Golshahi et al. (2013) and the four models developed for this study, were constructed using ICEM CFD 12.0.1 (ANSYS Inc., Canonsburg, PA). The tube and cannula were modeled using a structured hexahedral mesh with a butterfly blocking pattern rather than the tetrahedral mesh employed by the study of Golshahi et al. (2013), since hexahedral meshes are numerically preferred where possible (Longest & Vinchurkar, 2007; Vinchurkar & Longest, 2008). The near wall control volume height of the mesh in the tube and cannula for each model was approximately 0.025 mm throughout, and consisted of ∼1 million control volumes. Due to the geometric complexity of the nasal cavity, an unstructured tetrahedral mesh was deemed necessary in that region. A surface mesh was first applied with a curvature sensitive feature that used smaller elements in regions of greater curvature. A Delauney mesh was applied to the volume of each nasal cavity with a spacing scaling factor of 1.2-1.3, and a maximum cell dimension of 1 mm. Pentahedral elements were added along the walls to increase the accuracy of the boundary layer simulations and particle deposition. Golshahi et al. (2013) utilized five near wall layers with a near wall control volume height of 0.05 mm, but it was found through several mesh construction iterations that decreasing the near wall control volume height to 0.011 mm and increasing the number of layers to seven improved resolution of flow field features. The mesh density of the new version of the NMT model from Golshahi et al. (2013) was increased from ∼1.3 million cells to ∼4.4 million cells using the new meshing scheme. The four models used for this study were meshed in the same manner, producing models with mesh densities between ∼3 million (Open) and ∼6 million (Constricted2) cells.
The applicability of the k-ω turbulence model used in this study was assessed by checking the y+ values at the walls. The y+ parameter is a non-dimensional number that identifies the multiple turbulence zones at the wall (laminar sub-layer, transition, or fully turbulent). It is calculated as
| (1) |
where τw is the shear stress at the wall, y is the normal distance from the control volume center to the wall, ρ is the local density, and υ is the kinematic viscosity. Values of y+ < 5 indicate a laminar sub-layer, whereas values of y+ > 30 indicate the fully turbulent layer, both of which are considered to be accurately resolved by ANSYS FLUENT 14.5 (ANSYS Inc., Canonsburg, PA). Accurate resolution of the laminar sub-layer requires the use of a low Reynolds number correction, which was utilized in this study. The transition layer (5 < y+ < 30) is associated with a loss of resolution, though some accuracy is maintained for values of 5 < y+ < 11.2. The values of y+ are solution dependent since they are based on shear stress at the wall, density, and kinematic viscosity and should be checked after running simulations. It was found that the y+ values in each model did not exceed 6.5 in the tube at 30 L/min, so that the near wall control volumes were mostly in the laminar sub-layer region, with a few locations that were nearly laminar. The y+ values in the nasal cavity near wall control volumes were all ∼1, indicating adequate near-wall mesh resolution.
2.3 Inlet and Flow Field Conditions
In this study, simulations are considered for both the NMT validation and to evaluate variability in the four nasal models across different aerosol sizes. A steady state flow rate of 30 LPM was used in all cases applied at the inlet tube and additional airflow was not introduced to the nostrils outside of the two nasal prongs. Considering the validation study, inlet conditions were consistent with conventional mesh nebulizer generated aerosols. In this case, the aerosol from the nebulizer evaporates until the relative humidity (RH) reaches 100% at the ambient temperature, which prevents additional droplet size change. Therefore, in the validation case study, the inlet temperature and RH were 25°C and 99%, respectively. The aerosol size for the validation case study at the tube inlet was 2.9 μm, which was measured by Golshahi et al. (2013) at the cannula outlets. For evaluating variability among the four nasal geometries, particle aerodynamic diameters at the tube inlet were 0.9, 1.5, and 5.0 μm. The 0.9 and 1.5 μm aerosols were dried particles with an EEG formulation and were assumed to be generated with a previously developed mixer-heater (Longest, et al., 2013b). The resulting inlet temperature and RH for these cases were 35°C and 40%, respectively. The 5 μm droplet aerosol was assumed to be generated with a mesh nebulizer without the mixer-heater. Therefore, as with the conventional aerosol in the validation study, the inlet T and RH from the mesh nebulizer were assumed to be 25°C and 99%, respectively.
Table 2 describes differences in the boundary conditions between the current study and the simulations performed in the study of Golshahi et al. (2013). In the current study, the particle size exiting the cannula was employed in the validations. Therefore, a RH of 99% was assumed at the inlet to prevent aerosol evaporation in the tubing. Moreover, a more comfortable RH with EEG delivery of 40% is assumed, compared with the previous low value of 14%. Finally, the current study considered a larger control aerosol of 5.0 μm, which is consistent with most aerosols produced by mesh nebulizers (Longest, et al., 2013a; Martin et al., 2010; Rao et al., 2010; Scherer et al., 2011).
Table 2.
Boundary conditions and particle parameters from the study of Golshahi et al. (2013) and the current study, including inlet relative humidity (RH), the total number of particles (npart) and the initial aerodynamic diameters of the control (dae,control) and EEG (dae,EEG) aerosols.
| RHControl | RHEEG | npart | dae,control (μm) | dae,EEG(nm) | |
|---|---|---|---|---|---|
| Golshahi et al. (2013) | 90% | 14% | 9000 | 3.6 | 900 |
| Current Study | 99% | 40% | 9000 | 5.0 | 900, 1500 |
Though it is known that transient effects play a role in particle deposition, the models were simulated with a steady state approximation. A steady state approximation is advantageous for computational efficiency and is sufficient for achieving the primary objective of this study, which is a relative quantification of the nasal deposition and its variation in the four models. Effects of transient breathing and the need to synchronize aerosol delivery with inhalation for efficient nose-to-lung aerosol delivery have recently been explored by Golshahi et al. (2014).
For all cases, airway wall surfaces had an RH of 99% and a temperature of 37 °C. Additionally, all cases had 0.0001% turbulent intensity at the tubing inlet, which is reasonable since laminar flow is expected in this region. The outlet conditions of the four models and the NMT model were selected to closely mimic envisioned EEG nose-to-lung delivery. For all simulations used in this study, including the validation of the NMT model, constant pressure outlets were used at the nostrils and the trachea exit. The nostrils were held at a gauge pressure of zero and the negative pressure at the tracheal exit was determined iteratively to provide a constant flow rate of 30 L/min throughout the model.
2.4 Particle Formulations
Multiple particle/droplet sizes were used to characterize depositional variability in the nasal geometries, which represented control (conventional) and EEG delivery. For control conditions in the four nasal models and the NMT validation, the formulation used was 0.1% albuterol sulfate (AS): 0.1% sodium chloride (NaCl) w/v in water, while the droplet aerodynamic size was 5 μm. The droplets or particles are injected as a monodisperse bolus of 9,000 discrete elements for each case in this study, with a parabolic profile at the inlet of the tube. For EEG conditions, solid combination EEG particles composed of 50:50 drug (AS):excipient (NaCl) were used. Two particle sizes were investigated for the EEG delivery, 0.9 μm and 1.5 μm, where the sizes are given as aerodynamic diameters since the particle densities were significantly different than that of water. The hygroscopicity of each substance is quantified by its hygroscopic parameter (Longest & Hindle, 2011), where a large number indicates a greater potential for particle size increase due to water uptake. For the formulation used, the hygroscopic parameters were 77.9 kmol/m3 for NaCl and 4.9 kmol/m3 for AS, which indicated that NaCl has much greater growth potential than AS (Longest & Hindle, 2011).
2.5 CFD Simulations
A combination of user-defined routines and the commercially available CFD package ANSYS FLUENT 14.5 (ANSYS Inc., Canonsburg, PA) was used to simulate the fluid flow, heat, and mass transfer of the nasal models. Additionally, this combination was used to calculate the trajectories, size changes and deposition of all particulate matter. Since the maximum Reynolds number (Re) in the four models was estimated to be ∼5,000 at 30 L/min, some regions of the models were considered to be in transition to turbulent or fully turbulent flow. A low-Reynolds number (LRN) k-ω model was selected for modeling both laminar and turbulent conditions, as it has been shown to accurately estimate flow field conditions in an upper respiratory geometry, particularly as they relate to aerosol deposition and transport (Xi et al., 2008). The variable temperature and RH fields were resolved using coupled equations of heat and mass transfer previously reviewed in Longest et al. (2007) and Longest & Xi (2008).
Particle trajectories, including hygroscopic size change, were modeled using a Lagrangian transport set of equations (Longest & Hindle, 2010). Turbulent dispersion was estimated using a random walk method, while user-defined functions were implemented to simulate Brownian motion, anisotropic near-wall turbulent dispersion, and near-wall interpolation of fluid velocities. Additionally, evaporation and condensation of the particles were modeled using user-defined functions. Particle size changes included the effects of both the droplet surface vapor pressure change due to temperature and the hygroscopicity of the excipients and drugs, as well as the Kelvin effect. Influences of the particles on the fluid phase were neglected, and thus the system was modeled as one-way coupled. Further details of the equations can be found in previous studies (Longest, et al., 2011; Tian et al., 2013).
Solution methods for ANSYS FLUENT 14.5 were selected to reflect previously implemented models and established best practices (Longest, et al., 2012). Double precision was used for all calculations to improve accuracy, which is particularly important in regions of rapid change for flow, heat, and mass transport. The pressure-velocity coupling was modeled using the SIMPLEC algorithm, and the spatial discretization of all convective terms utilized a second order upwind scheme. Flow field convergence was achieved when the global mass-residual had been reduced five orders of magnitude and the residual rates of reduction for both mass and momentum approached the numerical precision limit.
2.6 Existing Correlations
Previously developed correlations for nasal deposition (Cheng, 2003; Golshahi, et al., 2011) were applied to the four nasal models developed for this study to provide initial deposition efficiency (DE) estimates. However, unlike the CFD predictions of this study, neither correlation was based on data that included condensational size change effects, so comparison with each correlation is intended to provide a first order approximation rather than a nearly exact match. Cheng (2003) developed a correlation between Stokes number and DE in the nasal cavity due to impaction using in vitro data reported by Swift (1991) for an adult and an infant model, with minimum coronal cross-sectional area (Amin) values of 1.61 and 0.54 cm2, respectively. The models were built using magnetic resonance imaging (MRI) data with a 3 mm build layer thickness, and a polydisperse NaCl solution was generated and passed through the system at 7, 15, 30, and 50 L/min via a breathing chamber (Swift, 1991). The correlation that Cheng (2003) produced using the data from Swift (1991) was
| (2) |
where DE is the depositional efficiency of the nasal cavity and Stk is the Stokes number. The non-dimensional Stokes number the study of Cheng (2003) was calculated as
| (3) |
where Stk is the Stokes number, ρw is the density of water, dae is the aerodynamic diameter, Q is the flow rate, μ is the dynamic viscosity of the fluid medium (in this case, air), and Amin is the minimum coronal cross-sectional area of the nasal cavity. The values of Amin for each of the four models used in this study ranged from 119.69 mm2 for the Constricted2 model to 169.61 mm2 for the Open model (Walenga, 2014). A correlation for deposition due to diffusion was also developed by Cheng (2003), which is not reported here since it was for particles smaller (<500 nm) than those investigated for this study.
Nasal DE was correlated with Stk and Re by Golshahi et al. (2011), using in vitro data from 13 pediatric upper airway models. The models were developed using CT scans of children age 4 to 14 years, and included the nasal cavity through the larynx and up to the beginning of the trachea (Golshahi, et al., 2011). Data was then collected by placing the models in a breathing chamber and passing polydisperse sunflower oil particles through each model (Golshahi, et al., 2011). The correlation developed by Cheng (2003) was explored by Golshahi et al. (2011) as a means of describing their in vitro data, but it produced a prediction that was well above the experimental results, so the correlation of Golshahi et al. (2011) is also considered in this study applied to adult geometries. Cheng (2003) used Amin1.5 to describe a characteristic diameter (dc), which was aimed at capturing the geometric contribution to the variability of nasal deposition, but Golshahi et al. (2011) found another form of dc that yielded a high R2 value (0.91) with relatively easily collected variables, given as
| (4) |
where dc is the characteristic diameter, Vtotal is the volume of the airway up to and including the larynx, and LCP is the central path length. The values of Vtotal, Lcp, and dc for each of the four models considered in the present study are available in Walenga (2014). The characteristic diameter dc was then applied by Golshahi et al. (2011) to find Re and Stk as
| (5) |
| (6) |
where ρa and ρw are the densities of air and water, dae is the aerodynamic diameter of the particle, Q is the flow rate, μ is the fluid dynamic viscosity, and Cca is the Cunningham correction factor for the aerodynamic diameter. The final correlation from Golshahi et al. (2011) for the DE was then stated as
| (7) |
where X is defined as
| (8) |
2.7 Deposition Factors
The percentage of initial drug mass that deposits in a given region is denoted by deposition fraction (DF), which is defined as
| (9) |
In this study the emitted dose directly enters the inlet tube. The deposition efficiency (DE) is the percentage of drug mass that enters a given region and deposits within that region, given by
| (10) |
Deposition efficiency values are calculated for the nasal region in this study to capture nasal deposition independent of loss in the cannula, which enables consistent comparison with predictions based on the existing correlations of Cheng (2003) and Golshahi et al. (2011). The penetration fraction (PF) is the percentage of initial drug mass that exits the nasopharynx, and is calculated as
| (11) |
The variability of the DE, PF, and the MMAD at the nasopharynx exit is characterized using the coefficient of variation, given as
| (12) |
where SD is the standard deviation and M is the mean value.
3. Results
3.1 Nasal Model Characterization
As described, the selected nasal models represent a SA/V range of 0.74-1.42 mm-1, which theoretically should approximate 84% of the variation from a normal distribution based on the assembled dataset. Though the nasal cavity models are selected for constriction, expressed as SA/V, other parameters, including dh,nostril, dh,nasopharynx, and nasal cannula insertion depth vary without any apparent relationship to SA/V (Table 1). Minimum nasal cavity cross sectional hydraulic diameter (dh,min) correlates inversely with SA/V (correlation coefficient R = -0.97, p < 0.03), indicating gradual constriction of the models from the Open model to the Constricted2 model. However, a linear correlation was not found for dh,nostril (R = 0.46) and dh,nasopharynx (R = 0.41) with SA/V. The insertion depth values of the cannula for each of the models, which are defined as the shortest and longest distances from the edge of the cannula opening to the plane of the nostril opening, had minimum and maximum value ranges of 0.17-3.24 mm and 4.39-8.12 mm, respectively. The right nostril cannula insertion of the Average model is illustrated in Fig. 2 to provide further context and demonstrate that the prongs protrude into the nasal cavity by only a small amount. These insertion depth values vary based on the open nostril volume available for prong insertion, and are also unrelated to nasal cavity constriction. Thus, the controlled variation in the four models (SA/V) is in the nasal cavity region, which has defined boundaries between the termination of the nasal valve area and the end of septum. Consequently, the collection of models should test the hypothesis that deposition fraction in the nasal cavity increases as SA/V values of the nasal cavity increase, since other variables (cannula insertion depth, dh,nostril, and dh,nasopharynx) are based on the patient specific dimensions.
Fig. 2.
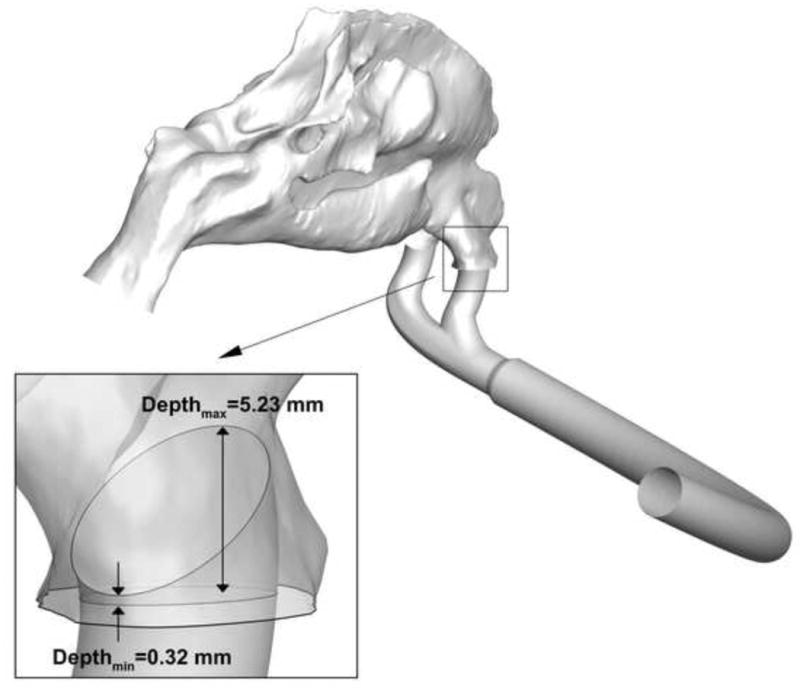
Minimum and maximum insertion depth values of the nasal cannula in the right nostril of the Average model. For clarity, a translucent close up of the model is shown in the same orientation as the far field view. The prongs are observed to protrude into the nasal vestibule only a small amount.
3.2 Validation of CFD Predictions
Deposition of drug mass for the NMT model is compared in Fig. 3 between the CFD predictions and previous in vitro study of Golshahi et al. (2013). Two formulations were tested, 0.1% AS: 0.1% mannitol (MN) and 0.1% AS: 0.1% NaCl, and the MMAD of the droplets at the tube inlet was 2.9 μm in both cases. The results are presented as DE in the cannula and NMT region, and the new mesh was found to provide a very close match to the experimental data. In particular, the NMT deposition efficiency of 0.1% AS:0.1% NaCl particles was predicted by CFD to be 9.5%, a 7% relative increase from the value of 8.9% that was found experimentally by Golshahi et al. (2013), while the relative increase for 0.1% AS:0.1% MN particles was even smaller (2%). This close agreement of nasal cannula predictions provides confidence that the CFD methods employed for this study will provide a good estimate of aerosol deposition and transport.
Fig. 3.
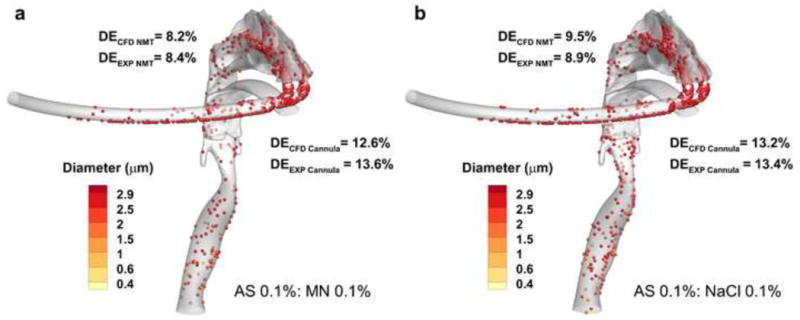
Comparison of CFD predictions with the experimental deposition fraction (DF) results from Golshahi et al. (2013) with formulations (a) 0.1% albuterol sulfate (AS): 0.1% mannitol (MN) and (b) 0.1% AS: 0.1% NaCl.
3.3 Flow Field Analysis
Expected values of Re in the four different regions depicted in Fig. 1 for each model are given in Table 3. The values of Re are calculated as
Table 3.
Expected Reynolds numbers for each model in coronal cross-sectional Regions 1-4 (as shown in Fig. 1), defined as (1) the termination of the nasal valve area, (2) location with two meatuses, (3) location with three meatuses, and (4) entrance to the nasopharynx.
| Model | Region 1 | Region 2 | Region 3 | Region 4 |
|---|---|---|---|---|
| Open | 799 | 361 | 419 | 1402 |
| Average | 861 | 304 | 345 | 1248 |
| Constricted1 | 1058 | 361 | 392 | 1456 |
| Constricted2 | 968 | 317 | 322 | 1510 |
| (13) |
where Q is the flow rate, dh is the hydraulic diameter of each region depicted in Fig. 1, υ is the kinematic viscosity, and A is the cross-sectional area of each region. The values of SA/V do not correlate well with the Re values of the various regions, where the strongest correlation was found between the SA/V and Re values of Region 3 (R = -0.79). A strong correlation exists between the dh,nasopharynx and Re values of Region 2 (R = -0.9996, p < 0.0003), and a weak correlation exists between the dh,nasopharynx and Re values of Region 3 (R = -0.88). However, reasons for this possible relationship are unclear.
Static pressure profiles at the walls of each model are illustrated in Fig. 4, with units given in Pascal (Pa). The tube in each model shows a gradual decrease in pressure, while a sharp decrease in pressure is visible at the junction of the tube and cannula. The transition from the cannula to the nasal cavity shows another sharp decrease in pressure, while the pressure drop from the nostril inlet to the nasopharynx outlet is more gradual. The olfactory region (i.e. superior meatus) of each model has a higher pressure at the wall than the inferior and middle meatus, which is to be expected given that the airspace in this region is more confined. While SA/V and dh,nasopharynx provide a poor linear fit for Δp, dividing SA/V by dh,nasopharynx provides a good fit (R = 0.98, p < 0.03), which shows that the pressure drop is affected by the constriction of both the nasal cavity (SA/V) and the nasopharynx exit (dh,nasopharynx). As the pressure drop is expected to influence particle deposition (Garcia, et al., 2009; Heyder & Rudolf, 1975; Hounam et al., 1971; Kesavanathan et al., 1998), the variability may not only correlate with SA/V as expected, but with dh,nasopharynx as well.
Fig. 4.
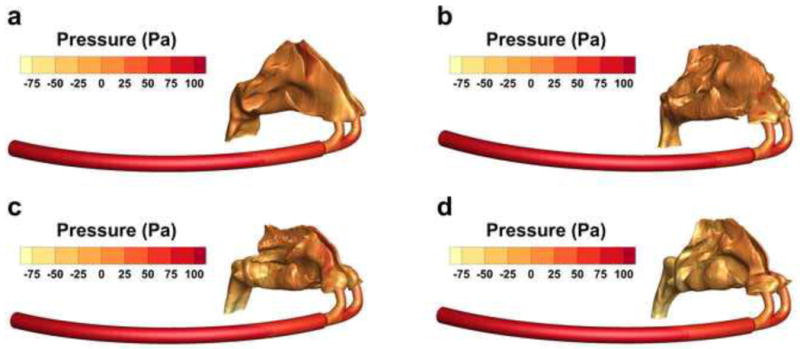
Wall pressure of (a) Open, (b) Average, (c) Constricted1, and (d) Constricted2 models, shown in Pa.
3.4 Predictions Based on Existing Correlations
The correlation from Cheng (2003) was applied to each of the four models and the DE values were plotted against dae, as shown in Fig. 5a. Also shown in the figure is the range between the maximum and minimum predicted values of DE in the nasal cavity region for each initial particle size (0.9 μm, 1.5 μm, 5 μm). The predictions show that the greatest and smallest ranges occur for 1.5 μm and 5 μm particles, which were 25.8-39.5% and 96.4-99.6%, respectively. According to the correlation, full nasal cavity retention is expected for particles greater than 6 μm, regardless of the SA/V value. Submicrometer particle deposition is predicted to be as low as 10%.
Fig. 5.
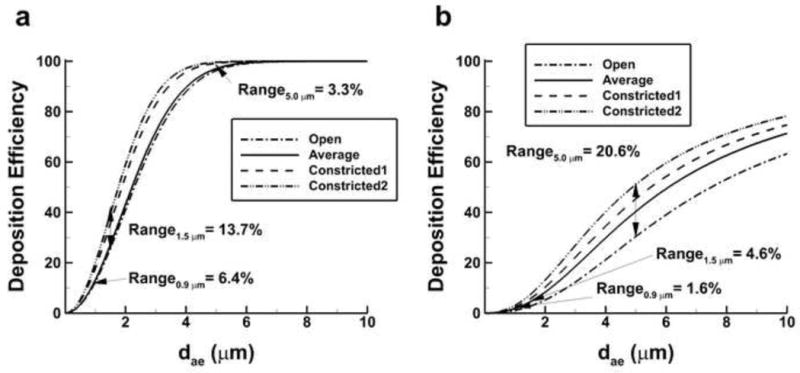
Predictions of deposition efficiency (DE) based on aerodynamic diameter (dae) from the correlations of (a) Cheng et al. (2003) and (b) Golshahi et al. (2011) applied to the four nasal models. Range values representing the difference between maximum and minimum predicted DE are also presented for particles of initial size 0.9 μm, 1.5 μm, and 5.0 μm.
Predictions based on the correlation produced by Golshahi et al. (2011) for DE in the nasal cavity as a function of dae are shown in Fig. 5b. Consistent with the findings of Golshahi et al. (2011), predicted depositions are lower than those of Cheng (2003) for each of the four models. The range values follow a much different pattern than with the Cheng (2003) predictions, since the greatest and smallest ranges occur for 5 μm and 0.9 μm particles, which were 30.5-51.1% and 0.9-2.4%, respectively. These findings provide evidence that use of the smaller EEG formulation aerosols will yield significant reductions in variability of the nasal depositional drug loss. CFD simulations of this variability are explored below and nasal deposition predictions are then compared with the predictions of the correlations.
3.5 CFD Predictions of Deposition
Predictions of regional DF and total nasal DE are presented in Tables 4 and 5 for cases without and with condensational size change, respectively. Size change was excluded in the first set of simulations so that its effects on deposition and variability as well as comparisons to the existing nasal deposition correlations could be assessed. Regional nasal cannula DF predictions showed that nearly half of the initial drug mass deposited in this region for the control case (5 μm), with and without condensational size change, but that for the EEG cases (0.9 μm and 1.5 μm) very little of the aerosol mass deposited (<4%). Likewise, there is very little deposition of the aerosol drug mass in the nostrils for the EEG cases, and significantly more in the control case.
Table 4.
Regional deposition fraction (DF) values (given in %) for simulations without condensational aerosol size change in the cannula, nostrils, and nasal cavity of each model. Also shown is the deposition efficiency (DE) of the total nasal region including the nostrils, nasal cavity, and nasopharynx. The particles considered include 0.9 μm and 1.5 μm solid formulations of 50:50 albuterol sulfate (AS):NaCl, and a 5 μm droplet of 0.1% AS:0.1% NaCl. The mean, 95% confidence interval (CI), and coefficient of variation (CV) for the total nasal DE of each initial particle size are also included.
| Cannula DF | Nostril DF | Nasal Cavity DF | Total Nasal DE | |||||||||
|---|---|---|---|---|---|---|---|---|---|---|---|---|
|
| ||||||||||||
| 0.9 μm | 1.5 μm | 5 μm | 0.9 μm | 1.5 μm | 5 μm | 0.9 μm | 1.5 μm | 5 μm | 0.9 μm | 1.5 μm | 5 μm | |
| Open | 1.6 | 3.7 | 50.2 | 0.1 | 0.3 | 2.8 | 1.5 | 2.4 | 7.3 | 1.8 | 3.0 | 24.5 |
| Average | 1.7 | 3.5 | 49.6 | 0.3 | 0.4 | 5.1 | 2.2 | 3.5 | 11.5 | 2.6 | 4.2 | 38.6 |
| Constricted1 | 1.6 | 2.8 | 49.4 | 0.2 | 0.3 | 2.9 | 2.0 | 3.0 | 16.4 | 2.4 | 3.7 | 45.1 |
| Constricted2 | 1.7 | 2.9 | 48.5 | 0.2 | 0.3 | 7.9 | 2.4 | 3.5 | 16.5 | 2.7 | 4.1 | 54.9 |
|
| ||||||||||||
| Mean | 2.4 | 3.8 | 40.8 | |||||||||
| 95% CI | 1.6-3.2 | 2.7-4.8 | 15.3-66.3 | |||||||||
| CV | 17% | 15% | 31% | |||||||||
Table 5.
Regional DF values (given in %) with condensational size change for the cannula, nostrils, and nasal cavity of each model. Also shown is the DE of the total nose-throat region including the nostrils, nasal cavity, and nasopharynx. The particles considered include 0.9 μm and 1.5 μm solid formulations of 50:50 AS:NaCl, and a 5 μm droplet of 0.1% AS:0.1% NaCl. The mean, 95% CI, and CV for the total nasal DE of each initial particle size are also included.
| Cannula DF | Nostril DF | Nasal Cavity DF | Total Nasal DE | |||||||||
|---|---|---|---|---|---|---|---|---|---|---|---|---|
|
| ||||||||||||
| 0.9 μm | 1.5 μm | 5 μm | 0.9 μm | 1.5 μm | 5 μm | 0.9 μm | 1.5 μm | 5 μm | 0.9 μm | 1.5 μm | 5 μm | |
| Open | 1.9 | 3.4 | 50.0 | 0.2 | 0.2 | 2.7 | 2.0 | 2.5 | 7.4 | 2.6 | 3.2 | 24.3 |
| Average | 2.0 | 3.7 | 49.9 | 0.3 | 0.3 | 4.7 | 2.4 | 3.5 | 11.2 | 2.9 | 4.1 | 37.4 |
| Constricted1 | 1.4 | 3.1 | 48.8 | 0.1 | 0.3 | 3.3 | 2.2 | 3.1 | 15.9 | 2.5 | 3.8 | 44.5 |
| Constricted2 | 1.5 | 3.1 | 48.5 | 0.3 | 0.4 | 7.9 | 2.4 | 3.6 | 15.9 | 2.9 | 4.2 | 53.0 |
|
| ||||||||||||
| Mean | 2.7 | 3.8 | 39.8 | |||||||||
| 95% CI | 2.3-3.1 | 2.9-4.7 | 15.5-64.1 | |||||||||
| CV | 8% | 12% | 30% | |||||||||
The total nasal DE of 0.9 μm and 5 μm aerosols for cases with condensational size change are illustrated in Figs. 6 and 7, respectively, for each of the four models. The mean, 95% confidence interval (CI), and the coefficient of variation (CV) are shown for cases without and with condensational size change in Tables 4 and 5, respectively. The control aerosol size (5 μm) shows an average nasal DE that is an order of magnitude higher than the EEG cases, both without and with condensational size change. Variability without and with condensational growth is also higher for the control case with CV's of 31% and 30% compared to the 0.9 μm cases (17% and 8%), and the 1.5 μm (15% and 12%) cases, respectively. There is a small increase in the average total nasal DE for 0.9 μm and 1.5 μm particles in the presence of condensational size changes compared to predictions without size change, but the values of DE remain about an order magnitude less than the control estimates. Condensational size change was also observed to decrease variability for the 0.9 μm and 1.5 μm cases and to increase it slightly for the 5 μm case. In terms of population DE range as estimated by the four geometries with size change considered, the 5 μm aerosol size produces a 95% CI of 15.5-64.1%, which is compared to the 95% CI for 0.9 μm EEG delivery of 2.3-3.1%.
Fig. 6.

Deposition efficiency (DE) of droplets with a mass median aerodynamic diameter (MMAD) of 900 nm for (a) Open, (b) Average, (c) Constricted1, and (d) Constricted2 airway models.
Fig. 7.
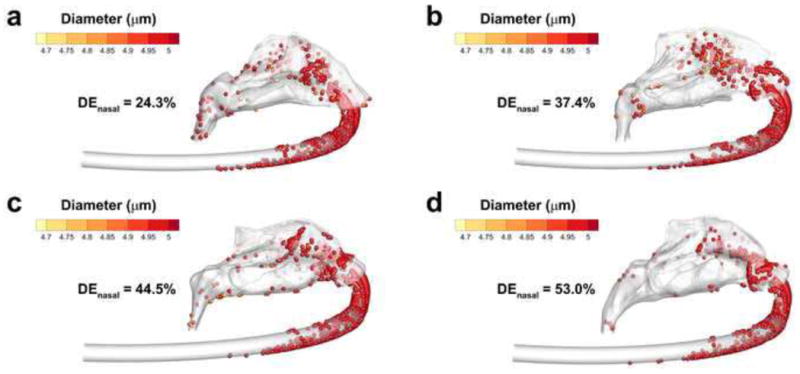
Deposition efficiency (DE) of droplets with a mass median aerodynamic diameter (MMAD) of 5 μm for (a) Open, (b) Average, (c) Constricted1, and (d) Constricted2 airway models.
Considering aerosol size change, MMAD predictions of the droplets at the exit of the nasopharynx are shown in Table 6 with the mean, 95% CI, and the CV. Very little evaporation is evident for the 5 μm case, which is expected given the high RH value throughout the system (99%). Significant size increase of EEG droplets is evident for both the 0.9 μm and 1.5 μm cases, with average values of 1.56 and 2.40 μm at the exits. There did appear to be an increased variability observed for the condensational growth of the 0.9 μm EEG aerosol with the 4 model geometries, however this represented a CV of only 10%, with a 95% CI population range of particle sizes at the exit of the nasal cavity of 1.24 – 1.88 μm.
Table 6.
Mass median aerodynamic diameters (MMAD), given in μm, at the exit of the cannula and the exit of the nasal cavity for the three initial aerodynamic diameter (dae) cases (900 nm and 1.5 μm for 50:50 AS:NaCl, 5 μm for 0.1% AS:0.1% NaCl). The mean, 95% CI, and CV are listed for each initial particle size.
| Exit | |||
|---|---|---|---|
|
| |||
| 0.9 μm | 1.5 μm | 5 μm | |
| Open | 1.33 | 2.20 | 4.90 |
| Average | 1.62 | 2.49 | 4.85 |
| Constricted1 | 1.58 | 2.39 | 4.91 |
| Constricted2 | 1.70 | 2.50 | 4.90 |
|
| |||
| Mean | 1.56 μm | 2.40 μm | 4.89 μm |
| 95% CI | 1.24 − 1.88 μm | 2.12 − 2.67 μm | 4.84 − 4.94 μm |
| CV | 10 % | 6 % | 1 % |
Droplet trajectories are illustrated in Fig. 8 for the 0.9 μm EEG case, with MMADs at the nasopharynx exit also provided. The nasal cannula directs particles toward the middle and upper meatuses for all four models, with fewer trajectories visible in the lower meatus. Also of note are the recirculation regions present near the nostrils and nasal cannula of each model, presumably due to the pressure difference between the atmospheric nostril openings and the fast moving flow exiting the cannula.
Fig. 8.
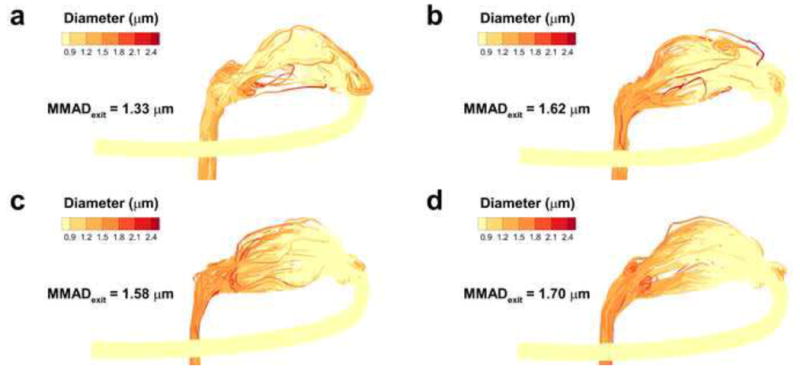
Growth and evaporation of particles with an MMAD of 900 nm for (a) Open, (b) Average, (c) Constricted1, and (d) Constricted2 airway models.
Total nasal DE values for each model and aerosol size are shown in Figs. 9a and 9b, without and with condensational size change, and compared to the correlations developed by Golshahi et al. (2011). Differences were too great for direct comparison of the data to the correlation developed by Cheng (2003). The individual values as predicted by CFD show a good match with the correlation values of Golshahi et al. (2011) in terms of magnitude and rank order, despite the considerable size change observed with the EEG cases. The variation (expressed as CV) of 5 μm aerosols without and with size change (31% and 30%) are somewhat larger than predicted by Golshahi et al. (2011), who estimated a CV value of 21%. However, the variation predicted by Golshahi et al. (2011) for the 0.9 μm and 1.5 μm cases (39% and 38%) is much higher than those predicted by CFD for this study (17% and 15% without condensational size change; 8% and 12% with condensational size change). A reduction in variability is observed in conjunction with the inclusion of condensational size change effects, though it does not fully explain the differences in the CFD predictions and those of Golshahi et al. (2011). The mode of aerosol delivery is an additional possible source of the discrepancy, as the correlation developed by Golshahi et al. (2011) was based on flow through an environmental chamber, while this study introduced aerosols through a nasal cannula. Penetration fraction (PF) values through the entire geometry without and with condensational size change are provided in Table 7 along with the mean, 95% CI, and the CV. It is noted that the PF values only include aerosols that exited the nasopharynx and do not include those that exit through the nostrils, which was on the order of ∼10% for all cases using the EEG technique with matched cannula and inhalation flow, but only ∼1% for the four models under control conditions. The relative difference in losses through the nostril inlets is most likely due to the greater inertia of the 5 μm droplets, causing those particles to not enter the recirculation region. Average PF values for EEG cases were similar for both initial particle sizes as well as without and with condensational size change. The EEG delivery approach (0.9 μm and 1.5 μm particles) increased lung PF values by a factor of four compared with the control case. Variation of the control cases was about five times higher than the EEG cases, with average CV values of 17% and 15% without and with condensational size change, as opposed to 3-4% for the EEG simulations. While the PF values for the control cases without and with condensational size change correlated very strongly with SA/V (R = -0.998, p < 0.002 and R = -0.997, p < 0.003), the EEG PF values did not show the same dependence. However, some correlation was observed between the EEG PF values and dh,nasopharynx values, considering cases without and with size change for initial particle sizes of 0.9 μm (R = -0.93 and R = -0.90) and 1.5 μm (R = -0.96, p < 0.05 and R = -0.93).
Fig. 9.
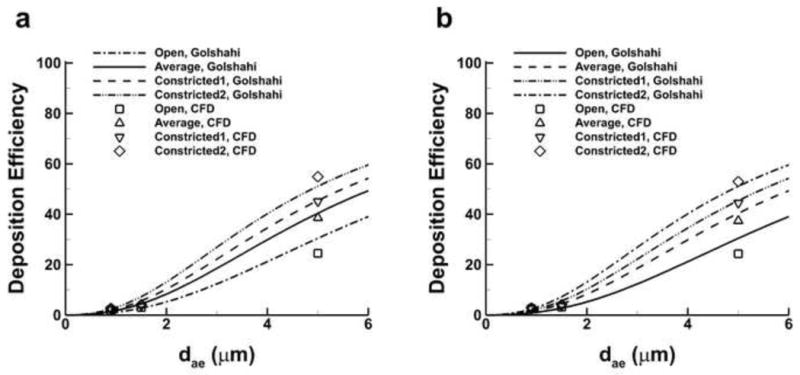
Deposition efficiency (DE) predicted with the Golshahi et al. (2011) correlation and compared with CFD predictions (a) without size change and (b) with size change.
Table 7.
Penetration fraction (PF) values of each model, listed without simulated size change and with size change. The PF indicates the percentage of initial drug mass that exits the nasopharynx and enters the pharynx upstream of the larynx. Values include loss at the nostril inlets. The mean, 95% CI, and CV are listed for each initial particle size.
| Without Size Change | With Size Change | |||||
|---|---|---|---|---|---|---|
|
| ||||||
| 900 nm | 1.5 μm | 5 μm | 900 nm | 1.5 μm | 5 μm | |
| Open | 83.4 | 81.3 | 28.3 | 82.7 | 80.4 | 28.4 |
| Average | 80.0 | 77.3 | 24.6 | 79.6 | 76.4 | 25.0 |
| Constricted1 | 85.7 | 83.3 | 22.1 | 85.5 | 83.4 | 22.7 |
| Constricted2 | 80.6 | 78.4 | 18.6 | 81.1 | 77.5 | 19.7 |
|
| ||||||
| Mean | 82.4 | 80.1 | 23.4 | 82.2 | 79.4 | 24.0 |
| 95% CI | 77.1 – 87.7 | 74.6 – 85.5 | 15.2 – 31.6 | 77.2 – 87.3 | 73.1 – 85.7 | 16.6 – 31.3 |
| CV | 3 % | 3 % | 17 % | 3 % | 4 % | 15 % |
4. Discussion
A primary outcome of this study is that the EEG approach allows for significantly reduced depositional losses and variability during nose-to-lung pharmaceutical aerosol delivery. Other results of the study include the collection of CT scan nasal cavity measurements into a database and the creation of four models with their accompanying meshes, which were selected to represent a wide range of nasal airway SA/V. Comparison of these four models using validated CFD methods showed that for the same flow rate, approximately four times as much delivered dose, expressed as PF, was observed at the nasopharynx outlet under EEG conditions compared with the control aerosol case. Regarding the initial goal of reducing system losses below a maximum of 15%, an average PF value of 82.2% for 0.9 μm particles under EEG conditions was predicted, which implied total average losses of 17.8% in the nasal airways, through the nostrils, and in the device. A majority of the lost fraction (∼10%) was from aerosol exiting the nostrils due to the matched flow rate between the cannula and inhalation. Nonetheless, considering the high reported delivery device (Ari, et al., 2011; Bhashyam, et al., 2008; Longest, et al., 2013a) and nasal (Kelly, et al., 2004b; Stahlhofen, et al., 1989) depositional losses from other studies that were outlined in the Introduction, the results indicated that EEG methods may provide an order of magnitude improvement compared with conventional aerosol sizes in terms of PF. Substantial reductions in variability were observed when EEG delivery was employed in favor of conventional sizes, with resulting PF coefficients of variation (CV) reduced from 15% to 3-4%.
In this study, the aerosol delivery flow rate of 30 LPM was matched by the tracheal inhalation flow rate. As a result, recirculation occurred in the nostrils and approximately 10% of the EEG dose was lost through the nostril openings to the atmosphere. To prevent this loss, we considered an additional case where the nasal inhalation flow rate was greater than the aerosol delivery flow rate. The Average model was considered with a cannula flow of 30 LPM and an additional flow of 15 LPM through the nostrils producing a tracheal flow rate of 45 LPM. Values of PF for the Average model under EEG conditions with condensational size change improved from 80% to 93% for the 0.9 μm aerosols and from 76% to 91% for the 1.5 μm aerosols. In contrast, with the control aerosol values of PF were reduced from 25% to 22% for the 5 μm cases. There were no losses observed through the nostril inlets for all cases. Regarding improvements of PF under EEG conditions, the aerosol recirculation regions in the nostrils were greatly reduced due to the presence of additional inhaled flow, which prevented depositional losses through the nostrils and potentially in the entrance of the nasal cavity. Moreover, depositional losses in the nasal cavity with the smaller EEG particles were low, so any relative increase due to the increased flow rate was expected to be small. Conversely, for control conditions, the presence of additional inhaled flow through the nostril inlets does not have a great effect on PF because losses near the nasal prongs were already low and the increased flow rate increases nasal depositional losses. The predicted high efficiency delivery of aerosols using the EEG technique indicates that delivered dose may be maximized with a system that synchronizes aerosol delivery with inhalation and ceases delivery during exhalation (Golshahi, et al., 2014).
Predicted delivery device losses under control conditions with a 5 μm aerosol were found to be about 55% on average when including tube and nasal cannula loss, which is less than the range of observed losses (67-98%) that other studies in the literature had reported for aerosol delivery through commercial nasal cannulas under various flow conditions (Ari, et al., 2011; Bhashyam, et al., 2008; Longest, et al., 2013b). The improvement may be explained in part by the use of the streamlined nasal cannula as opposed to typically available cannulas like the Optiflow™ (Fisher and Paykel), which was shown by Longest et al. (2013b) through computational and in vitro methods to exhibit greater depositional loss than a streamlined version. The comparison to Ari et al. (2011) and Bhashyam et al. (2008) is limited by demographics, since both studies considered pediatric and neonatal HFNC gas and aerosol delivery, where it is known that efficiency is reduced by the smaller cannula size as compared to adult cannulas. However, a recent study by Perry et al. (2013) suggested that adult delivery of nominal dose using a commercial cannula with a Vapotherm (Stevensville, MD) HFNC system was not much greater than for a pediatric or infant case. For the adult case, nominal dose delivery was reported to be 2.5% or less, depending on flow rate, and for pediatric and infant cases it was 1.2% or less and 0.6% or less, respectively (Perry, et al., 2013). Another limitation to the comparison is the difference in tube positioning, where the current study utilized a 90° bend of tubing intended to mimic the Optiflow device with a single inlet, whereas the studies of Ari et al. (2011) and Bhashyam et al. (2008) studied in vitro systems with tubing in various positions. The positioning of the tubing was considered far less significant than the choice of cannula for EEG delivery, since the smaller particles are expected to pass through the gradual bend of the tubing more easily than the more rapid bend of the cannula. For EEG delivery, tube and cannula system losses predicted by this study were much less than for control conditions, with about 2% and 4% for the 0.9 μm and 1.5 μm initial particle sizes, respectively, which is due to the small initial aerosol size and the use of the streamlined cannula. For all cases, including condensational size change did not have a significant effect on average device losses.
Nasal cavity depositional loss comparisons are more difficult to characterize due to the disparity between in vivo and in vitro results present in the literature. Stahlhofen et al. (1989) provided a fit of in vivo data from several studies and measured 80% nasal loss (expressed as deposition efficiency) for a 5 μm aerosol at 30 L/min, while Kelly et al. (2004b) showed a 40% loss under the same conditions using an in vitro model. Moreover, a 0.9 μm aerosol at 30 L/min was predicted to produce a nasal loss of 7-8% by Stahlhofen et al. (1989), but Kelly et al. (2004b) predicted virtually no loss for the same conditions. However, Kelly et al. (2004b) also showed depositional loss predicted by in vitro models varied greatly when different build methods were employed using the same MRI scan data from Swift (1991), where estimated loss for a 5 μm aerosol at 30 L/min ranged from 40-95%. Despite the unresolved discrepancies between in vivo and in vitro data in the literature, the average predicted nasal losses for 5 μm and 0.9 μm aerosols at 30 L/min for this study (39.8% and 2.7% with condensational size change and 40.8% and 2.4% without condensational size change) agree reasonably well with published values. Comparisons with the correlation provided by Golshahi et al. (2011) in Fig. 9 showed outstanding agreement. Moreover, the CFD predictions of nasal deposition produced by this study show an order of magnitude reduction based on initial particle size (i.e. a 5 μm aerosol as compared with a 0.9 μm aerosol), a trend also seen in Stahlhofen et al. (1989), Kelly et al. (2004b), and other studies throughout the literature.
Nasal cavity deposition variability has been predicted by other studies, including Garcia et al. (2009) and Golshahi et al. (2011). Estimates of CV and 95% CI population range were not available from those studies, so for the sake of comparison the range of predicted minimum and maximum nasal DE values are discussed here. Using a set of five adult in vitro models, Garcia et al. (2009) measured a range of depositional losses from 20-80% for a 5 μm aerosol at 30 L/min, while for the same conditions Golshahi et al. (2011) observed a range of 35-80% for fourteen in vitro models of children, where the range from each study is defined by the minimum and maximum data. For the same parameters, not including any condensational size change effects, this study predicted minimum and maximum depositional losses of 25% (Open model) and 55% (Constricted2 model), indicating a smaller range. However, both Garcia et al. (2009) and Golshahi et al. (2011) had experimental setups that would best approximate either aerosol delivery through a mask or environmental exposure, while this study simulated delivery with short nasal prongs. It is reasonable to conclude that aerosol delivery through a nasal cannula may reduce some variability by directing the flow in a more specific way, though more study is required to further elucidate the reported differences under control conditions. For a 0.9 μm aerosol, studies have shown low variability, where Garcia et al. (2009) reported a range of depositions around 0-3%, Golshahi et al. (2011) showed approximately 0-5%, and this study predicted a range of 2.5-2.9%. All three studies show that for a submicrometer particle size (0.9 μm in this case), variability is lower by an order of magnitude compared with conventional pharmaceutical aerosol size, which highlights the expected efficiency of EEG nasal delivery of lung targeted aerosols.
The two primary features of EEG nasal delivery are the use of submicrometer particles to reduce extrathoracic deposition and the addition of an excipient to promote aerosol growth and foster thoracic deposition. Prior to this study it was well known that deposition of submicrometer aerosols is significantly less than that of larger aerosols, but the effects of condensational size change on deposition and variability of deposition had not been characterized. Though it would seem logical that particle growth as a result of the use of EEG methods would lead to potentially significant increases in both deposition magnitude and variability, the CFD data did not support this result. Instead, the 95% CI range for the DE of the 0.9 μm aerosol in the four models was reduced from 1.6-3.2% to 2.3-3.1%, and the mean was relatively unchanged, increasing from 2.4% to 2.7%. Consequently, the CV was reduced from 17% to 8% by including the effects of condensational size change for the 0.9 μm aerosol. A similar pattern was observed for the 1.5 μm aerosol, though not as pronounced. Condensational size change effects did not produce an observable change in the data for the 5 μm aerosol. Collectively, the data showed that the condensational size change effects of the EEG method produce a reduction in depositional variability that was more pronounced with the smaller aerosol.
A primary hypothesis of this study was that SA/V may be used as an indicator of nasal DE and associated variability. Several correlations exist in the literature that use a variety of parameters to characterize variability, including SA/V or V/SA (Carrigy et al., 2014; Garcia, et al., 2009; Golshahi, et al., 2011; Storey-Bishoff, et al., 2008). Results showed that for control conditions without and with condensational size change considered, the nasal cavity DE correlated very strongly with SA/V (R = 0.993, p < 0.007 and R = 0.991, p < 0.01), but for EEG conditions the two parameters were not related. Instead, DE shows some correlation with the product of dh,nasopharynx and SA/V, where r-values of the 0.9 μm and 1.5 μm aerosols with size change considered were R = 0.84 and R = 0.93, respectively. Examining the relationships of PF with variables of interest provides what is perhaps a clearer picture. Delivered dose (i.e. PF) correlates strongly with SA/V for control conditions without and with condensational size change (R = -0.998, p < 0.002 and R = -0.997, p < 0.003), while for EEG conditions a relationship between PF and dh,nasopharynx was observed. With the inclusion of condensational size change effects, a correlation between the two parameters was noted for the 0.9 μm and 1.5 μm cases (R = -0.93 and R = -0.96, p < 0.05), which was somewhat weaker when size change was considered for both particle sizes (R = -0.90 and R = -0.93).
Though it is interesting to observe that PF may be related to dh,nasopharynx, the unsteady nature of this parameter presents a problem. It has been shown to vary during a breathing cycle (Schwab et al., 1993), during sleep (Trudo et al., 1998), and according to posture (Van Holsbeke et al., 2013). Therefore, the PF of smaller particles may be subject to intrasubject variability as well as intersubject variability. Regarding the scan data used in this study, CT scans are taken in a supine posture, which has been shown by Van Holsbeke et al. (2013) to reduce nasopharynx exit area, and the scans are not controlled for any particular point in the breathing cycle. Also, it is not clear whether dh,nasopharynx is the sole indicator of PF under these conditions.
Though this study has provided evidence that SA/V correlates well with DE and PF under control conditions (i.e. for an aerosol size of 5 μm), a limitation of the results is that a critical aerosol diameter for which this relationship is valid was not defined. More investigation is required to characterize a greater range of aerosol diameters and flow rates so that a related characteristic diameter may be identified. For aerosol sizes less than this critical diameter, a dependence of PF on dh,nasopharynx was suggested by the data, but the scan conditions were not controlled to isolate intrasubject and intersubject effects, nor has dependence on other parameters been ruled out. Also, future study is required to identify the effects of the MMAD at the nasopharynx exit on the total DF in the lungs.
In summary, the EEG approach can improve the lung PF of aerosols by a factor of four compared with conventional aerosol administration with a nasal cannula interface across a range of nasal anatomies. A database of nasal cavity dimensions obtained from CT scans was produced, from which the four models were chosen. The models were selected to represent a broad range of nasal cavity constriction, which was characterized by SA/V, and evidence showed that the deposition of larger aerosols at the given flow rate correlate well with this parameter. For a 5 μm initial aerosol size, conventional methods resulted in delivery device and nasal losses around 80%, while a 0.9 μm initially sized aerosol under EEG conditions only resulted in about 20% total drug loss with only 6% depositing in the device and nasal airways. An investigation of nasal inhalation effects showed that the tracheal inhalation rate should be greater than the aerosol delivery rate with PF values increased to 90%. Furthermore, use of the EEG techniques reduced variability in PF as expressed by CV from 15% to 3-4% as compared with conventional aerosol sizes. With EEG delivery, the different nasal models had the largest effect on the size of the aerosol exiting the nasopharynx. Determining whether this size difference has an effect on lung deposition requires additional study.
Variability in lung delivery is high for nose-to-lung aerosol administration
Four new nasal cavity models were developed to quantify variability
Enhanced excipient growth (EEG) is proposed as a method for reducing variability
Delivered dose was improved by a factor of four using EEG method
Coefficient of variability for delivered dose reduced by a factor of four using EEG
Acknowledgments
This study was supported by Award R01 HL107333 from the National Heart, Lung, and Blood Institute. The content is solely the responsibility of the authors and does not necessarily represent the official views of the National Heart, Lung, And Blood Institute or the National Institutes of Health.
Abbreviations
- 95% CI
95% confidence interval
- A
regional coronal cross-sectional area of the nasal cavity
- Amin
minimum coronal cross-sectional area of the nasal cavity
- AS
albuterol sulfate
- Cca
Cunningham correction factor for the aerodynamic diameter
- CFD
computational fluid dynamics
- CPAP
continuous positive airway pressure
- CT
computed tomography
- CV
coefficient of variation
- dc
characteristic diameter
- dae
initial aerodynamic particle diameter
- dh,min
minimum coronal cross-sectional hydraulic diameter of the nasal cavity
- dh,nostril
average nostril hydraulic diameter
- dh,nasopharynx
nasopharynx hydraulic diameter
- DE
deposition efficiency
- DF
deposition fraction
- ECG
enhanced condensational growth
- EEG
excipient enhanced growth
- HFNC
high flow nasal cannula
- LCP
central path length
- LFNC
low flow nasal cannula
- LRN
low Reynolds number
- M
mean
- MMAD
mass median aerodynamic diameter
- MN
mannitol
- MRI
magnetic resonance imaging
- MT
mouth-throat
- μ
dynamic viscosity
- υ
kinematic viscosity
- NIV
noninvasive ventilation
- NMT
nose-mouth-throat
- PF
penetration fraction
- ρ
local density
- ρa
air density
- ρw
water density
- R
correlation coefficient
- Re
Reynolds number
- RH
relative humidity
- Q
flow rate
- SA
surface area
- SA/V
surface area-to-volume ratio
- SD
standard deviation
- Stk
Stokes number
- V
volume
- Vtotal
volume of the airway up to and including the larynx
- τw
wall shear stress
- y
distance from near wall node to wall
- y+
wall y-plus value
Footnotes
Publisher's Disclaimer: This is a PDF file of an unedited manuscript that has been accepted for publication. As a service to our customers we are providing this early version of the manuscript. The manuscript will undergo copyediting, typesetting, and review of the resulting proof before it is published in its final citable form. Please note that during the production process errors may be discovered which could affect the content, and all legal disclaimers that apply to the journal pertain.
References
- Aboussouan LS, Ricaurte B. Noninvasive positive pressure ventilation: Increasing use in acute care. Cleveland clinical journal of medicine. 2010;77:307–316. doi: 10.3949/ccjm.77a.09145. [DOI] [PubMed] [Google Scholar]
- Ari A, Harwood R, Sheard M, Dailey P, Fink JB. In vitro comparison of heliox and oxygen in aerosol delivery using pediatric high flow nasal cannula. Pediatric Pulmonology. 2011;46:795–801. doi: 10.1002/ppul.21421. [DOI] [PubMed] [Google Scholar]
- Bennett WD, Zeman KL. Effect of race on fine particle deposition for oral and nasal breathing. Inhalation Toxicology. 2005;17:641–648. doi: 10.1080/08958370500188984. [DOI] [PubMed] [Google Scholar]
- Bhashyam AR, Wolf MT, Marcinkowski AL, Saville A, Thomas K, Carcillo JA, Corcoran TE. Aerosol delivery through nasal cannulas: An in vitro study. Journal of Aerosol Medicine and Pulmonary Drug Delivery. 2008;21:181–187. doi: 10.1089/jamp.2007.0662. [DOI] [PubMed] [Google Scholar]
- Borgstrom L, Olsson B, Thorsson L. Degree of throat deposition can explain the variability in lung deposition of inhaled drugs. Journal of Aerosol Medicine. 2006;19:473–483. doi: 10.1089/jam.2006.19.473. [DOI] [PubMed] [Google Scholar]
- Brochard L, Mancebo J, Wysocki M, Lofaso F, Conti G, Rauss A, Simonneau G, Benito S, Gasparetto A, Lemaire F, Isabey D, Harf A. Noninvasive ventilation for acute exacerbations of chronic obstructive pulmonary disease. New England Journal of Medicine. 1995;333:817–822. doi: 10.1056/NEJM199509283331301. [DOI] [PubMed] [Google Scholar]
- Carrigy NB, Ruzycki CA, Golshahi L, Finlay WH. Pediatric in vitro and in silico models of deposition via oral and nasal inhalation. Journal of Aerosol Medicine and Pulmonary Drug Delivery. 2014;27:149–169. doi: 10.1089/jamp.2013.1075. [DOI] [PubMed] [Google Scholar]
- Cheng YS. Aerosol deposition in the extrathoracic region. Aerosol Science and Technology. 2003;37:659–671. doi: 10.1080/02786820300906. [DOI] [PMC free article] [PubMed] [Google Scholar]
- Clark AR, Hartman MS. Regional lung deposition: Can it be controlled and have an impact on safety and efficacy? Respiratory Drug Delivery 2012. 2012;1:89–100. [Google Scholar]
- Dhand R. Aerosol therapy in patients receiving noninvasive positive pressure ventilation. Journal of Aerosol Medicine and Pulmonary Drug Delivery. 2012;25:63–78. doi: 10.1089/jamp.2011.0929. [DOI] [PubMed] [Google Scholar]
- Finlay WH. Estimating the type of hygroscopic behavior exhibited by aqueous droplets. Journal of Aerosol Medicine. 1998;11:221–229. doi: 10.1089/jam.1998.11.221. [DOI] [PubMed] [Google Scholar]
- Garcia GJM, Tewksbury EW, Wong BA, Kimbell JS. Interindividual variability in nasal filtration as a function of nasal cavity geometry. Journal of Aerosol Medicine and Pulmonary Drug Delivery. 2009;22:139–155. doi: 10.1089/jamp.2008.0713. [DOI] [PubMed] [Google Scholar]
- Golshahi L, Noga ML, Thompson RB, Finlay WH. In vitro deposition measurement of inhaled micrometer-sized particles in extrathoracic airways of children and adolescents during nose breathing. Journal of Aerosol Science. 2011;42:474–488. [Google Scholar]
- Golshahi L, Noga ML, Finlay WH. Deposition of inhaled micrometer-sized particles in oropharyngeal airway replicas of children at constant flow rates. Journal of Aerosol Science. 2012;49:21–31. [Google Scholar]
- Golshahi L, Tian G, Azimi M, Son YJ, Walenga RL, Longest PW, Hindle M. The use of condensational growth methods for efficient drug delivery to the lungs during noninvasive ventilation high flow therapy. Pharmaceutical Research. 2013;30:2917–2930. doi: 10.1007/s11095-013-1123-3. [DOI] [PMC free article] [PubMed] [Google Scholar]
- Golshahi L, Longest PW, Azimi M, Syed A, Hindle M. Intermittent aerosol delivery to the lungs during high flow nasal cannula therapy. Respiratory Care. 2014 doi: 10.4187/respcare.02903. in press. [DOI] [PubMed] [Google Scholar]
- Grgic B, Finlay WH, Burnell PKP, Heenan AF. In vitro intersubject and intrasubject deposition measurements in realistic mouth-throat geometries. Journal of Aerosol Science. 2004;35:1025–1040. [Google Scholar]
- Guilmette RA, Cheng YS, Yeh HC, Swift DL. Deposition of 0.005 - 12 micrometer monodisperse particles in a computer-milled, MRI-based nasal airway replica. Inhalation Toxicology. 1994;6(Suppl. 1):395–399. [Google Scholar]
- Heyder J, Rudolf G. Deposition of aerosol particles in the human nose. Inhaled Particles. 1975;4:107–126. [PubMed] [Google Scholar]
- Hindle M, Longest PW. Evaluation of enhanced condensational growth (ECG) for controlled respiratory drug delivery in a mouth-throat and upper tracheobronchial model. Pharmaceutical Research. 2010;27:1800–1811. doi: 10.1007/s11095-010-0165-z. [DOI] [PMC free article] [PubMed] [Google Scholar]
- Hindle M, Longest PW. Condensational growth of combination drug-excipient submicrometer particles for targeted high efficiency pulmonary delivery: Evaluation of formulation and delivery device. Journal of Pharmacy and Pharmacology. 2012;64:1254–1263. doi: 10.1111/j.2042-7158.2012.01476.x. [DOI] [PMC free article] [PubMed] [Google Scholar]
- Hounam RF, Black A, Walsh M. The deposition of aerosol particles in the nasopharyngeal region of the human respiratory tract. Aerosol Science. 1971;2:47–61. doi: 10.1038/2211254a0. [DOI] [PubMed] [Google Scholar]
- Inthavong K, Ge QJ, Se CMK, Yang W, Tu JY. Simulation of sprayed particle deposition in a human nasal cavity including a nasal spray device. Journal of Aerosol Science. 2011;42:100–113. [Google Scholar]
- Kelly JT, Asgharian B, Kimbell JS, Wong B. Particle deposition in human nasal airway replicas manufactured by different methods. Part II: Ultrafine particles. Aerosol Science and Technology. 2004a;38:1072–1079. [Google Scholar]
- Kelly JT, Asgharian B, Kimbell JS, Wong B. Particle deposition in human nasal airway replicas manufactured by different methods. Part I: Inertial regime particles. Aerosol Science and Technology. 2004b;38:1063–1071. [Google Scholar]
- Kesavanathan J, Bascom R, Swift DL. The effect of nasal passage characteristics on particle deposition. Journal of Aerosol Medicine. 1998;11:27–39. doi: 10.1089/jam.2000.13.17. [DOI] [PubMed] [Google Scholar]
- Kimbell JS, Segal RA, Asgharian B, Wong BA, Schroeter JD, Southall JP, Dickens CJ, Brace G, Miller FJ. Characterization of deposition from nasal spray devices using a computational fluid dynamics model of the human nasal passages. Journal Of Aerosol Medicine-Deposition Clearance And Effects In The Lung. 2007;20:59–74. doi: 10.1089/jam.2006.0531. [DOI] [PubMed] [Google Scholar]
- Kuhli M, Weiss M, Steckel H. A sampling and dilution system for droplet aerosols from medical nebulisers developed for use with an optical particle counter. Aerosol Science. 2009;40:523–533. [Google Scholar]
- Lang C, Grützenmacher S, Mlynski B, Plontke A, Mlynski G. Investigating the nasal cycle using endoscopy, rhinoresistometry, and acoustic rhinometry. The Laryngoscope. 2003;113:284–289. doi: 10.1097/00005537-200302000-00016. [DOI] [PubMed] [Google Scholar]
- Lee JH, Rehder KJ, Williford L, Cheifetz IM, Turner DA. Use of high flow nasal cannula in critically ill infants, children, and adults: a critical review of the literature. Intensive Care Medicine. 2013;39:247–257. doi: 10.1007/s00134-012-2743-5. [DOI] [PubMed] [Google Scholar]
- Lightowler JV, Wedzicha JA, Elliott MW, Ram FSF. Non-invasive positive pressure ventilation to treat respiratory failure resulting from exacerbations of chronic obstructive pulmonary disease: Cochrane systematic review and meta-analysis. British Medical Journal. 2003;326:185–187. doi: 10.1136/bmj.326.7382.185. [DOI] [PMC free article] [PubMed] [Google Scholar]
- Liu Y, Matida EA, Gu J, Johnson MR. Numerical simulation of aerosol deposition in a 3-D human nasal cavity using RANS, RANS/EIM, and LES. Aerosol Science. 2007;38:683–700. [Google Scholar]
- Liu Y, Johnson MR, Matida EA, Kherani S, Marsan J. Creation of a standardized geometry of the human nasal cavity. Journal of Applied Physiology. 2009;106:784–795. doi: 10.1152/japplphysiol.90376.2008. [DOI] [PubMed] [Google Scholar]
- Longest PW, Vinchurkar S. Effects of mesh style and grid convergence on particle deposition in bifurcating airway models with comparisons to experimental data. Medical Engineering and Physics. 2007;29:350–366. doi: 10.1016/j.medengphy.2006.05.012. [DOI] [PubMed] [Google Scholar]
- Longest PW, Hindle M. CFD simulations of enhanced condensational growth (ECG) applied to respiratory drug delivery with comparisons to in vitro data. Journal of Aerosol Science. 2010;41:805–820. doi: 10.1016/j.jaerosci.2010.04.006. [DOI] [PMC free article] [PubMed] [Google Scholar]
- Longest PW, Hindle M. Numerical model to characterize the size increase of combination drug and hygroscopic excipient nanoparticle aerosols. Aerosol Science and Technology. 2011;45:884–899. doi: 10.1080/02786826.2011.566592. [DOI] [PMC free article] [PubMed] [Google Scholar]
- Longest PW, Tian G, Hindle M. Improving the lung delivery of nasally administered aerosols during noninvasive ventilation - An application of enhanced condensational growth (ECG) Journal of Aerosol Medicine and Pulmonary Drug Delivery. 2011;24:103–118. doi: 10.1089/jamp.2010.0849. doi:110.1089/jamp.2010.0849. [DOI] [PMC free article] [PubMed] [Google Scholar]
- Longest PW, Hindle M. Condensational growth of combination drug-excipient submicrometer particles: Comparison of CFD predictions with experimental results. Pharmaceutical Research. 2012;29:707–721. doi: 10.1007/s11095-011-0596-1. [DOI] [PMC free article] [PubMed] [Google Scholar]
- Longest PW, Tian G, Li X, Son YJ, Hindle M. Performance of combination drug and hygroscopic excipient submicrometer particles from a softmist inhaler in a characteristic model of the airways. Annals of Biomedical Engineering. 2012;40:2596–2610. doi: 10.1007/s10439-012-0616-2. [DOI] [PMC free article] [PubMed] [Google Scholar]
- Longest PW, Golshahi L, Hindle M. Improving pharmaceutical aerosol delivery during noninvasive ventilation: Effects of streamlined components. Annals of Biomedical Engineering. 2013a;41:1217–1232. doi: 10.1007/s10439-013-0759-9. [DOI] [PMC free article] [PubMed] [Google Scholar]
- Longest PW, Walenga RL, Son YJ, Hindle M. High efficiency generation and delivery of aerosols through nasal cannula during noninvasive ventilation. Journal of Aerosol Medicine and Pulmonary Drug Delivery. 2013b;26:266–279. doi: 10.1089/jamp.2012.1006. [DOI] [PMC free article] [PubMed] [Google Scholar]
- Martin AR, Gleske J, Katz IM, Hartmann M, Mullinger B, Haussermann S, Caillibotte G, Scheuch G. Laser diffraction characterization of droplet size distributions produced by vibrating mesh nebulization of air and a helium-oxygen mixture. Journal of Aerosol Science. 2010;41 [Google Scholar]
- McRobbie DW, Pritchard SE, Quest RA. Studies of the human oropharyngeal airspaces using magnetic resonance imaging. I. Validation of a three-dimensional MRI method for producing ex vivo virtual and physical casts of the oropharyngeal airways during inspiration. Journal of Aerosol Medicine. 2003;16:401–415. doi: 10.1089/089426803772455668. [DOI] [PubMed] [Google Scholar]
- McRobbie DW, Pritchard SE. Studies of the human oropharyngeal airspaces using magnetic resonance imaging. III. The effects of device resistance with forced maneuver and tidal breathing on upper airway geometry. Journal of Aerosol Medicine. 2005;18:325–336. doi: 10.1089/jam.2005.18.325. [DOI] [PubMed] [Google Scholar]
- Parke RL, McGuinness SP, Eccleston ML. A preliminary randomized controlled trial to assess effectiveness of nasal high-flow oxygen in intensive care patients. Respiratory Care. 2011;56:265–270. doi: 10.4187/respcare.00801. [DOI] [PubMed] [Google Scholar]
- Perry SA, Kesser KC, Geller DE, Selhorst DM, Rendle JK, Hertzog JH. Influences of cannula size and flow rate on aerosol drug delivery through the Vapotherm humidified high-flow nasal cannula system. Pediatric Critical Care Medicine. 2013;14:e250–e256. doi: 10.1097/PCC.0b013e31828a7f79. [DOI] [PubMed] [Google Scholar]
- Pritchard SE, McRobbie DW. Studies of the human oropharyngeal airspaces using magnetic resonance imaging. II. The use of three-dimensional gated MRI to determine the influence of mouthpiece diameter and resistance of inhalation devices on the oropharyngeal airspace geometry. Journal of Aerosol Medicine. 2004;17:310–324. doi: 10.1089/jam.2004.17.310. [DOI] [PubMed] [Google Scholar]
- Ram FS, Lightowler JV, Wedzicha JA. Non-invasive positive pressure ventilation for treatment of respiratory failure due to exacerbations of chronic obstructive pulmonary disease. Cochrane Database Syst Rev. 2004;1:CD004104. doi: 10.1002/14651858.CD004104. [DOI] [PubMed] [Google Scholar]
- Rao N, Kadrichu N, Ament B. Application of a droplet evaporation model to aerodynamic size measurement of drug aerosols generated by a vibrating mesh nebulizer. Journal of Aerosol Medicine and Pulmonary Drug Delivery. 2010;23:295–302. doi: 10.1089/jamp.2009.0805. [DOI] [PubMed] [Google Scholar]
- Scherer T, Geller DE, Owyang L, Tservistas M, Keller M, Boden N, Kesser KC, Shire SJ. A technical feasibility study of dornase alfa delivery with eFlow® vibrating membrane nebulizers: aerosol characteristics and physicochemical stability. Journal of Pharmaceutical Sciences. 2011;100:98–109. doi: 10.1002/jps.22231. [DOI] [PubMed] [Google Scholar]
- Schroeter JD, Kimbell JS, Asgharian B. Analysis of particle deposition in the turbinate and olfactory regions using a human nasal computational fluid dynamics model. Journal of Aerosol Medicine. 2006;19:301–313. doi: 10.1089/jam.2006.19.301. [DOI] [PubMed] [Google Scholar]
- Schroeter JD, Garcia GJM, Kimbell JS. Effects of surface smoothness on inertial particle deposition in human nasal models. Journal of Aerosol Science. 2011;42:52–63. doi: 10.1016/j.jaerosci.2010.11.002. [DOI] [PMC free article] [PubMed] [Google Scholar]
- Schwab RJ, Gefter WB, Pack AI, Hoffman EA. Dynamic imaging of the upper airway during respiration in normal subjects. Journal of Applied Physiology. 1993;74:1504–1514. doi: 10.1152/jappl.1993.74.4.1504. [DOI] [PubMed] [Google Scholar]
- Segal RA, Kepler GM, Kimbell JS. Effects of differences in nasal anatomy of airflow distribution: A comparison of four individuals at rest. Annals of Biomedical Engineering. 2008;36:1870–1882. doi: 10.1007/s10439-008-9556-2. [DOI] [PubMed] [Google Scholar]
- Shanley KT, Zamankhan P, Ahmadi G, Hopke PK, Cheng YS. Numerical Simulations Investigating the Regional and Overall Deposition Efficiency of the Human Nasal Cavity. Inhalation Toxicology. 2008;20:1093–1100. doi: 10.1080/08958370802130379. [DOI] [PubMed] [Google Scholar]
- Shen X, Hindle M, Byron PR. Effect of energy on propylene glycol aerosols using the capillary aerosol generator. International Journal of Pharmaceutics. 2004;275:249–258. doi: 10.1016/j.ijpharm.2004.02.005. [DOI] [PubMed] [Google Scholar]
- Stahlhofen W, Rudolf G, James AC. Intercomparison of experimental regional aerosol deposition data. Journal of Aerosol Medicine. 1989;2:285–308. [Google Scholar]
- Storey-Bishoff J, Noga M, Finlay WH. Deposition of micrometer-sized aerosol particles in infant nasal airway replicas. Aerosol Science. 2008;39:1055–1065. [Google Scholar]
- Swift DL. Inspiratory inertial deposition of aerosols in human nasal airway replicate casts: implication for the proposed NCRP lung model. Radiation Protection Dosimetry. 1991;38:29–34. [Google Scholar]
- Swift DL, Strong JC. Nasal deposition of ultrafine 218Po aerosols in human subjects. J Aerosol Science. 1996;27:1125–1132. [Google Scholar]
- Taylor DJ, Doorly DJ, Schroter RC. Inflow boundary profile prescription for numerical simulation of nasal airflow. Journal of the Royal Society Interface. 2010;7:515–527. doi: 10.1098/rsif.2009.0306. [DOI] [PMC free article] [PubMed] [Google Scholar]
- Tian G, Longest PW, Su G, Hindle M. Characterization of respiratory drug delivery with enhanced condensational growth (ECG) using an individual path model of the entire tracheobronchial airways. Annals of Biomedical Engineering. 2011;39:1136–1153. doi: 10.1007/s10439-010-0223-z. [DOI] [PMC free article] [PubMed] [Google Scholar]
- Tian G, Longest PW, Li X, Hindle M. Targeting aerosol deposition to and within the lung airways using excipient enhanced growth. Journal of Aerosol Medicine and Pulmonary Drug Delivery. 2013;26:248–265. doi: 10.1089/jamp.2012.0997. [DOI] [PMC free article] [PubMed] [Google Scholar]
- Trudo FJ, Gefter WB, Welch KC, Gupta KB, Maislin G, Schwab RJ. State-related changes in upper airway caliber and surrounding soft-tissue structures in normal subjects. American Journal of Respiratory and Critical Care Medicine. 1998;158:1259–1270. doi: 10.1164/ajrccm.158.4.9712063. [DOI] [PubMed] [Google Scholar]
- Van Holsbeke CS, Stijn LV, Wim GV, De Backer JW, Vinchurkar SC, Verdonck PR, van Doorn JWD, Nadjmi N, De Backer WA. Change in upper airway geometry between upright and supine position during tidal nasal breathing. Journal of Aerosol Medicine and Pulmonary Drug Delivery. 2013;26:1–7. doi: 10.1089/jamp.2012.1010. [DOI] [PubMed] [Google Scholar]
- Vinchurkar S, Longest PW. Evaluation of hexahedral, prismatic and hybrid mesh styles for simulating respiratory aerosol dynamics. Computers and Fluids. 2008;37:317–331. [Google Scholar]
- Walenga RL. CFD assessment of respiratory drug delivery efficiency in adults and improvements using controlled condensational growth. Virginia Commonwealth University; Richmond, VA: 2014. [Google Scholar]
- Xi J, Longest PW. Effects of oral airway geometry characteristics on the diffusional deposition of inhaled nanoparticles. ASME Journal of Biomechanical Engineering. 2008a;130:011008. doi: 10.1115/1.2838039. [DOI] [PubMed] [Google Scholar]
- Xi J, Longest PW. Numerical predictions of submicrometer aerosol deposition in the nasal cavity using a novel drift flux approach. International Journal Of Heat And Mass Transfer. 2008b;51:5562–5577. [Google Scholar]
- Xi J, Longest PW, Martonen TB. Effects of the laryngeal jet on nano- and microparticle transport and deposition in an approximate model of the upper tracheobronchial airways. Journal of Applied Physiology. 2008;104:1761–1777. doi: 10.1152/japplphysiol.01233.2007. [DOI] [PubMed] [Google Scholar]
- Xi J, Si XH, Kim JW, Berlinski A. Simulation of airflow and aerosol deposition in the nasal cavity of a 5-year-old child. Journal Of Aerosol Science. 2011;42:156–173. [Google Scholar]
- Xi J, Berlinski A, Zhou Y, Greenberg B, Ou XW. Breathing Resistance and Ultrafine Particle Deposition in Nasal-Laryngeal Airways of a Newborn, an Infant, a Child, and an Adult. Annals Of Biomedical Engineering. 2012;40:2579–2595. doi: 10.1007/s10439-012-0603-7. [DOI] [PubMed] [Google Scholar]
- Yokley TR. The functional and adaptive significance of anatomical variation in recent and fossil human nasal passages. Duke University; Durham, NC: 2006. Unpublished Doctoral Dissertation. [Google Scholar]
- Zhu JH, Lee HP, Lim KM, Lee SJ, Wang DY. Evaluation and comparison of nasal airway flow patterns among three subjects from Caucasian, Chinese and Indian ethnic groups using computational fluid dynamics simulation. Respiratory physiology & neurobiology. 2011;175:62–69. doi: 10.1016/j.resp.2010.09.008. [DOI] [PubMed] [Google Scholar]