Abstract
Magnetic nanoparticle (mNP) hyperthermia is a promising adjuvant cancer therapy. mNP’s are delivered intravenously or directly into a tumor, and excited by applying an alternating magnetic field (AMF). The mNP’s are, in many cases, sequestered by cells and packed into endosomes. The proximity of the mNP’s has a strong influence on their ability to heat due to inter-particle magnetic interaction effects. This is an important point to take into account when modeling the mNP’s. Generally, more mNP heating can be achieved using higher magnetic field strengths. The factor which limits the maximum field strength applied to clinically relevant volumes of tissue is the heating caused by eddy currents, which are induced in the noncancerous tissue. A coupled electromagnetic and thermal model has been developed to predict dynamic thermal distributions during AMF treatment. The EM model is based on the method of auxiliary sources and the thermal modeling is based on the Pennes bioheat equation. The results of our phantom study are used to validate the model which takes into account nanoparticle heating, interaction effects, particle spatial distribution, particle size distribution, EM field distribution, and eddy current generation in a controlled environment. Preliminary in vivo data for model validation are also presented. Once fully developed and validated, the model will have applications in experimental design, AMF coil design, and treatment planning.
Keywords: magnetic nanoparticle, hyperthermia, treatment planning, predictive model, method of auxiliary sources, phantom, eddy currents, cancer therapy, thermal imaging
1. INTRODUCTION
Surgery, radiation and chemotherapy are the current standards of care for the treatment of cancer. Clinical hyperthermia has not yet achieved this status but has proven effective, especially in an adjuvant setting1–6. One of the limitations inherent to hyperthermia is that cancerous and noncancerous tissues tend to have similar sensitivities to heat7. The lack of an innate differential sensitivity precludes the use of hyperthermia as a global therapy, effectively necessitating high specificity in the application of the heat source. Nanoparticle hyperthermia addresses this need by allowing for an amorphous spatial distribution of small heat sources which can in many cases be targeted to cancer cells8–10.
There are some fundamental similarities between the characteristics of an effective nanoparticle hyperthermia and radiation therapy treatment, driven by the common need for a highly localized treatment. Both must be targeted to the cancerous tissue, are limited by potential normal tissue cytotoxicity in the treatment region, and in most cases require effective and informative imaging of the patient and patient specific treatment planning. There are many treatment planning software packages available for radiation treatment planning11. They commonly include clinician guided or partially automated image segmentation of regions with varying dose limitations, suggested number of beams, beam angles, and beam specific multi-leaf collimator settings. This is all done in an effort to maximize dose to the target while minimizing the dose to the surrounding normal tissue, and has been shown to increase treatment efficacy12–14. To this date there does not exist a clinical treatment planning model for magnetic nanoparticle hyperthermia which is robust, validated, and commercially available. The work presented here documents our group’s efforts to develop such a model, focusing on experimental validation.
2. METHODS
2.1 Computational modeling
The electromagnetic model is based on the Method of Auxiliary Sources (MAS), a robust, accurate numerical technique for solving electromagnetic wave propagation and scattering problems15, 16. The AMF source was modeled based on coil schematics and magnetic core material properties (Fluxtrol Inc., Aubrun Hills, MI, USA). Boundaries are defined within the model which designate interfaces between materials of differing electrical permittivity, magnetic permeability, and electrical conductivity. The surfaces are assigned colocation points on the interface, for which an inner and outer point are assigned constituting a pair. These points define an inner and outer fictitious surface for each object. Each of these points pairs is designated as a magnetic dipole with unknown magnitude and direction, defined as being tangential to the surface, constituting four unknowns. These auxiliary sources are solved for directly using four boundary condition equations for each per pair (Eq. 1,2), resulting in a finite linear combination of analytical solutions to Maxwell’s Equations.
| (1) |
| (2) |
These boundary conditions simply state that the tangential components of the electric and magnetic fields must be continuous between regions. β denotes regions of different electrical properties, n̂ is the unit normal vector of the surface between regions. The region of interest is then discretized and the field at every point is calculated directly from the contribution of all auxiliary sources of the fictitious surfaces outside the region of interest. This is accomplished using the Green’s Function. Once the field has been solved within the region of interest, the induced current density can be calculated simply as the E field multiplied by the conductivity. The specific absorption rate (SAR, W/g) due to eddy currents is then calculated using Eq. 3,
| (3) |
where σ is the electrical conductivity (S/m) and J is the current density (A/m2). The model of magnetic nanoparticle heating will be discussed in an future publication, but for the purposes of the treatment planning model, it amounts to a second contribution to total SAR (Eq. 4).
| (4) |
The total SAR distribution and thermal boundary conditions are then fed into a finite difference time domain (FDTD) heat transfer model, based on the Pennes Bioheat Equation (Eq. 5).
| (5) |
Where ρ is the tissue density, kg/m3; c is the specific heat of tissue, J/(kg °C); k is the thermal conductivity of tissue, W/(m °C); wb is the blood perfusion, ml/(m3·s); ρb is the density of blood, kg/m3; cb is the specific heat of blood, J/(kg °C); Tb temperature of blood, °C; and Qm is the metabolic heat generation rate, W/m3.17, 18
2.2 AMF system characterization
One of the AMF coils used in these experiments is a single turn, pancake type coil with a magnetic core. It is powered by a 25kW generator (Fluxtrol Inc., Aubrun Hills, MI, USA), which drives 156 kHz AC current through the coil, thus generating a 156 kHz AMF. The magnetic field distribution produced by the pancake coil (Fig. 1a) at 70% nominal power, was measured in 100 locations (Fig. 1b) and interpolated to produce the field map illustrated in Figure 1c.
Figure 1.
(a) Single turn AMF pancake coil with magnetic core; (b) Apparatus used to make field measurement with high spatial accuracy; (c) Field distribution created by interpolating the 100 measurement points, each measurement point is an average of 192 field measurements.
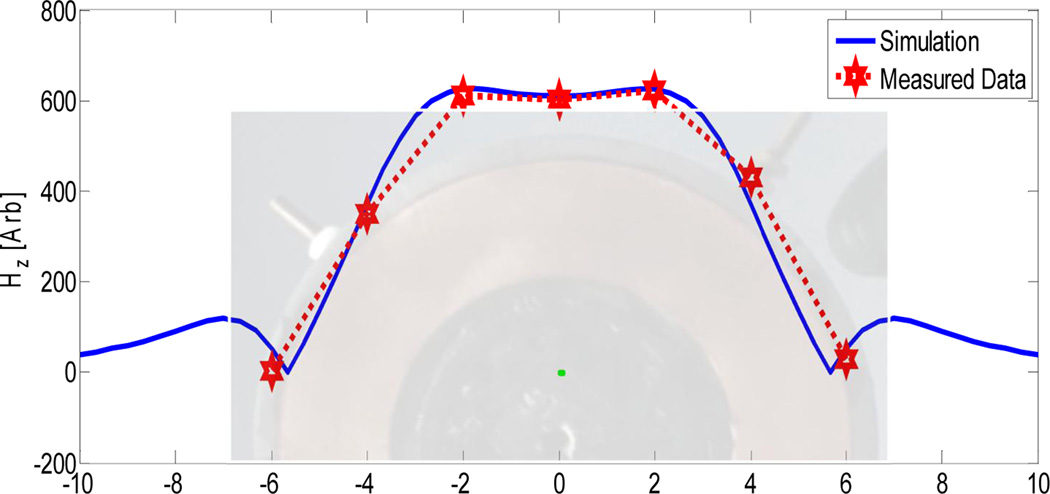
The field distribution was modeled using geometrical information from the coils schematic and material properties for the proprietary magnetic core material, which was provided by the manufacturer (Fluxtrol Inc., Aubrun Hills, MI, USA). The field distribution model was shown to agree well with the measured field data (Fig. 2).
Figure 2.
Comparison of simulated and measured field strength data for the pancake coil, used in subsequent experiments
2.3 Phantom study
The phantoms are constructed from agarose, NaCl, and deionized water. A phantom was created with the electrical conductivity of human muscle19 and a control phantom was created with deionized water with no NaCl added. This insulating phantom acts as a control for heat transfer from the inhomogeneous, time varying surface temperature distribution of the contact surface between the AMF coil and the phantom. The temperature distribution of the upper surface of the phantoms was measured using a thermal camera (Model SC325, FLIR Systems Inc., Wilsonville, OR, USA), and internal temperature were measured using custom made, three-point fiber optic temperature probes which utilize Fabry–Pérot interferometry (Fiso Technologies, Quebec, Canada). Each individual probe measures temperature at 1mm, 3mm, and 5mm from the tip of the fiber. For each 20 minute AMF heating cycle, four probes collected data from 12 points at a sampling rate of 1Hz. Each phantom was put through two heating/cooling cycles in order to collect measurements from a total of 24 points per phantom. The phantoms were not moved in between cycles in order to minimize uncertainty in probe location relative to the coil-table configuration.
2.4 In vivo mouse study
In this preliminary study 5mg of iron per gram of tumor was injected directly into MTG-B flank tumors of female C3H-HEJ mice. One mouse was treated inside a 10cm five turn solenoidal coil, driven by a 10kW generator (TIG 10/300, Hüttinger Elektronik GmbH, Freiburg, Germany). The other mouse was treated on a custom built pancake coil driven by a 25kW generator (Fluxtrol Inc., Aubrun Hills, MI, USA). The mNP’s used were hydroxyethyl starch coated multi-crystal core magnetite particles (BNF-Starch®, MicroMod, Partikeltechnologie Gmbh, Rostock, Germany). These particles have a mean hydrodynamic diameter of 100nm and a mean core diameter of 50nm.
3. RESULTS
3.1 Validation of treatment model in phantoms
The method of auxiliary sources model has been previously validated for other applications20 and was modified for use in mNP hyperthermia treatment modeling. In order to validate the model for this new application as well as to validate the coupling of the bioheat equation, a tissue mimicking phantom study was performed. The difference in temperature between the muscle conductivity and non-conducting phantom, for any collocated point, is used as the assessment of the effect of heat deposition due to eddy currents. Since the conduction of heat through the tabletop boundary and the convection boundary conditions of the rest of the phantom are common to both phantoms, the only difference in heat sources is the induced current or lack thereof. Figure 4a illustrates the modeled power deposition due to eddy currents in the muscle conductivity phantom at a height of 1mm from the table surface. Features to note are the higher SAR nearest the current carrying loop of the pancake coil. This is to be expected as the elecric field is inversely proportional to the distance from an ideal current carrying loop. The conducting phantom surface temperature distribution after 20 minutes of heating is shown in Figure 3c. The spatial distribution of temperature as seen in Fig. 3c is in general accordance with the modeled SAR distribution in Fig. 4a. Though this does not the take into account conductive heat transfer through the table, when compensating for this via subtraction of the control phantom temperature distribution, the trend remains.
Figure 4.
(a) Modeled SAR distribution for pancake coil; (b) temperature difference profiles for internal probes during measurements at three different heights from the table surface; (c) comparison between modeled temperature profile assuming zero flux thermal boundary conditions and experimental internal temperature difference.
Figure 3.
(a) Visual overlay of coil with phantom showing that the center points are collocated. The phantom is in contact with the upper surface of the treatment table, which is above the AMF coil. Surface temperature distribution of (b) non-probes conducting and (c) conducting phantom after 20 minutes of AMF exposure.
The internal temperature profile difference at 20 minutes as measured by the fiber optic point probes is illustrated in Figure 4b and is compared to the modeled temperature distribution, at z=1mm, in Fig. 4c. Note that this simulation used simplified, zero flux thermal boundary conditions, however, even with this simplification the model was shown to be in good agreement with the experimental data. The model has thus been validated for eddy current generation in the case of zero blood perfusion.
3.2 Validation of treatment model in small animals
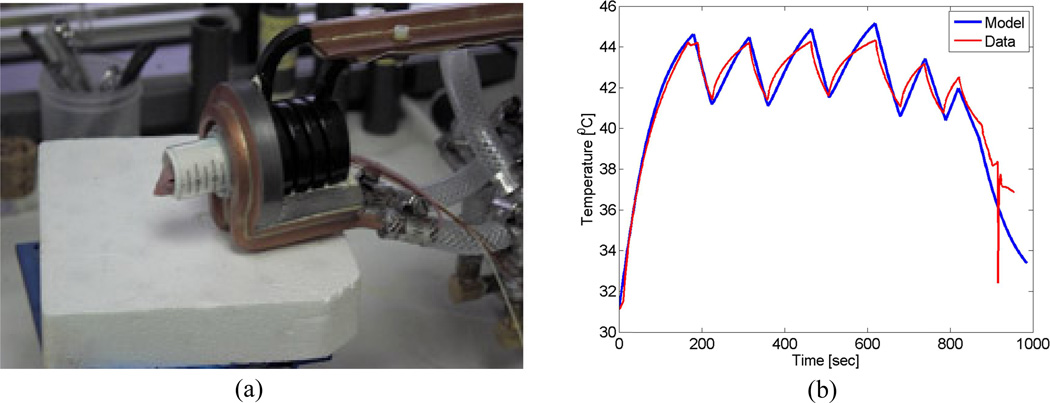
Validating the model in the case of blood perfusion and inhomogeneous tissue properties requires data to be collected from in vivo treatments. The murine animal model presents an opportunity to validate these aspects of the treatment planning model. In the first preliminary study, a mouse with 5mg iron per gram tumor was placed inside a solenoidal coil (Fig. 5a). It was exposed to a peak magnetic field strength of 450 Oe (35.8KA/m peak) at approximately 160 kHz. The field strength was then modulated to keep the tumor temperature, as monitored by intratumoral fiber optic thermometry, in the range of 41–45 °C. The treatment planning model was then run for a simplified mouse geometry with homogeneous tissue properties with the field strength varying in time to match the experiment. The resulting modeled temperature evolution is plotted against the measured data in Figure 5b. This data shows that the model, using simplified assumptions of tissue properties and geometry, fits reasonably well with measured in vivo data.
Figure 5.
(a) Typical mouse treatment in a solenoidal coil; (b) Comparison between modeled and experimental intratumoral temperataure over time. Note that the field strength was modulated to keep the tumor temperature within a desired range.
In another preliminary in vivo experiment a mouse with 5mg of iron per gram of tumor, in an approximately 1cm diameter tumor, is positioned on the air table which thermally and electrically insulates it from the pancake coil below. The generator power is stepped up to 70% of the maximum power (Pmax = 25kW). An estimation of the maximum field strength to which the tumor is exposed, based on prior measurement and interpolation, is illustrated in Figure 6
Figure 6.
(a) Interpolated measured field strength over 1cm diameter sphere located at the position of the mouse flank tumor. (b) Visual overlay of the relationship between the mouse’s position and the field strength experienced by the tumor. Note that the origin is centered horizontally on the coil and the height is referenced from the surface of the table.
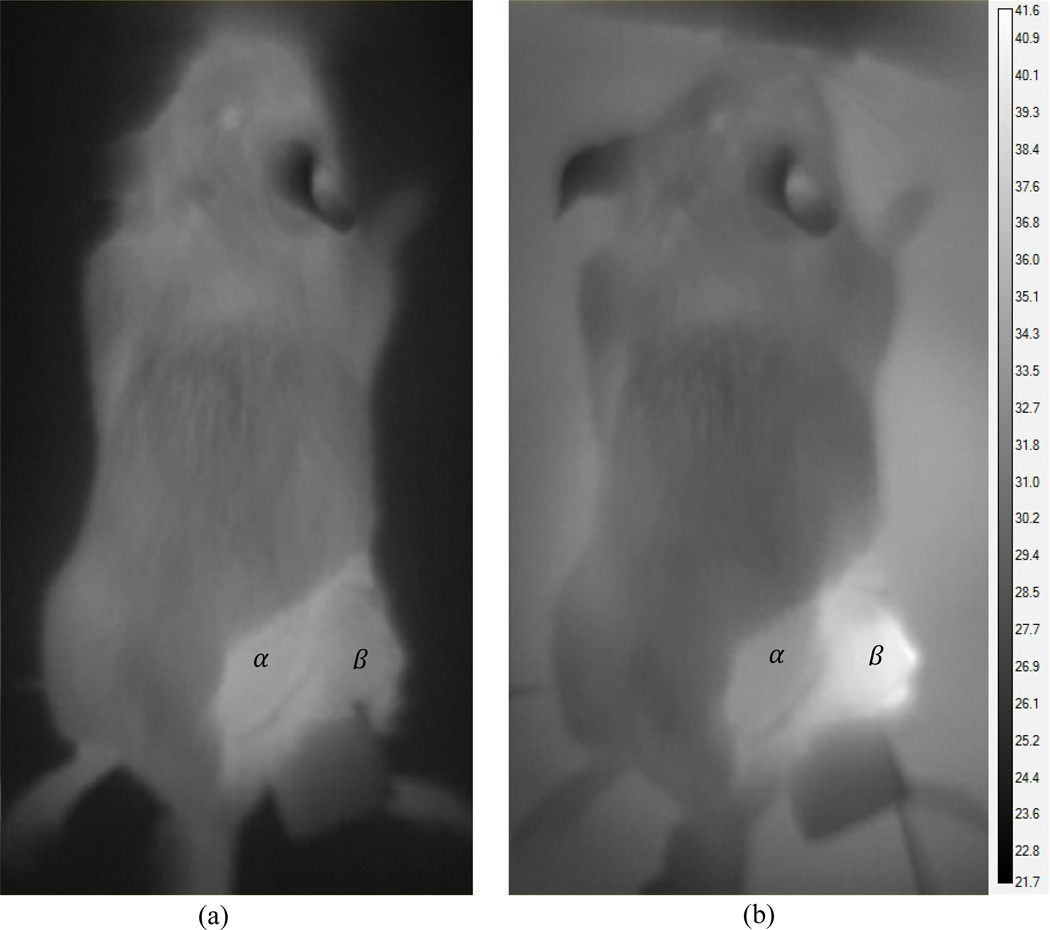
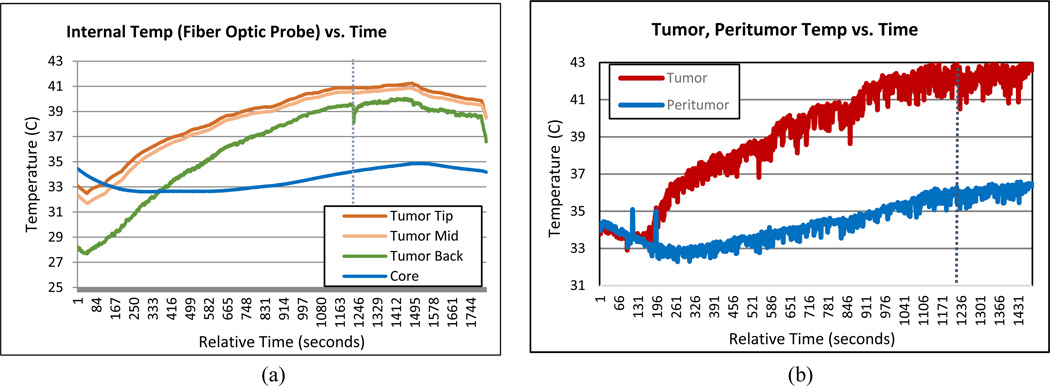
The tumor temperature was monitored and recorded using both infrared imaging of the surface (Fig. 7) and a three-point fiber optic probe inside the tumor (Fig. 9). The mouse’ core temperature and the temperature of the interface between the mouse’s tumor bearing limb and the table were monitored using single point probes (Fig. 9).
Figure 7.
Surface temperature distribution of the mouse (a) before treatment and (b) 1200 seconds into the treatment. Reference locations within the peritumor and tumor region are marked α and β respectively.
Figure 9.
(a) Internal fiber optic temperature probe measurements over time. There is 2mm spacing between measurement points. (b) Maximum surface temperature within tumor region (red) and peritumor region (blue) over time.
This preliminary experiment proves the feasibility of collecting partial surface temperature distributions of tumors in vivo during AMF treatment. In this future, this data will be used to validate the treatment model’s ability to predict dynamic 3D temperature distributions.
4. CONCLUSIONS
In this paper we developed and partially validated a coupled electromagnetic and thermal model of magnetic nanoparticle hyperthermia treatments. We were able to show good agreement between simulated and experimental eddy current distributions in homogeneous tissue mimicking phantom. Because the phantom experiments lack tissue perfusion, complex geometry, and inhomogeneous tissue electrical and thermal properties, the next logical step was to validate the model in an in vivo setting. Comparisons with previously attained murine flank tumor treatments in a solenoidal coil were made and shown to be in good agreement with the model, even when using simplified geometries, thermal boundary condition, and material property assumptions. Finally, a mouse with a flank tumor was treated on an open coil design to allow for thermal imaging and the ability to treat large volumes of tissue in the future. The preliminary data show that we are able to acquire meaningful surface temperature distributions during treatment which correlate well with internal temperature measurements and the computational results. Future work will include the addition of more mice to the thermal camera imaging treatment study, collection of histological biodistribution information, and evaluation of the ability of the model to predict temperature distribution given a priori particle distribution information of limited accuracy and spatial resolution.
Figure 8.
Surface temperature profile along the straight line intersecting points α and β, (a) before treatment and (b) 1200 seconds into the treatment.
ACKNOWLEDGEMENTS
Supported by the Dartmouth Center for Cancer Nanotechnology Excellence: NCI-CCNE U54CA151662-03, and Dartmouth GK-12 Fellowship Program: NSF-GK-12 - DGE0947790
REFERENCES
- 1.Giustini AJ, et al. Magnetic nanoparticle hyperthermia in cancer treatment. Nano LIFE. 2010;01:17–32. doi: 10.1142/S1793984410000067. [DOI] [PMC free article] [PubMed] [Google Scholar]
- 2.Oleson JR, et al. Biological and clinical aspects of hyperthermia in cancer therapy. Am J Clin Oncol. 1988;11(3):368–380. doi: 10.1097/00000421-198806000-00013. [DOI] [PubMed] [Google Scholar]
- 3.Horsman MR, Overgaard J. Hyperthermia: a potent enhancer of radiotherapy. Clin Oncol (R Coll Radiol) 2007;19(6):418–426. doi: 10.1016/j.clon.2007.03.015. [DOI] [PubMed] [Google Scholar]
- 4.Sekhar KR, et al. Novel chemical enhancers of heat shock increase thermal radiosensitization through a mitotic catastrophe pathway. Cancer Res. 2007;67(2):695–701. doi: 10.1158/0008-5472.CAN-06-3212. [DOI] [PubMed] [Google Scholar]
- 5.Kampinga HH, Dikomey E. Hyperthermic radiosensitization: mode of action and clinical relevance. Int J Radiat Biol. 2001;77(4):399–408. doi: 10.1080/09553000010024687. [DOI] [PubMed] [Google Scholar]
- 6.Cassim SM, et al. Iron oxide nanoparticle hyperthermia and radiation cancer treatment. 2009:718100–718100. doi: 10.1117/12.810035. [DOI] [PMC free article] [PubMed] [Google Scholar]
- 7.Roizin-Towle L, Pirro JP. The response of human and rodent cells to hyperthermia. Int J Radiat Oncol Biol Phys. 1991;20(4):751–756. doi: 10.1016/0360-3016(91)90018-y. [DOI] [PubMed] [Google Scholar]
- 8.Sonvico F, et al. Folate-conjugated iron oxide nanoparticles for solid tumor targeting as potential specific magnetic hyperthermia mediators: synthesis, physicochemical characterization, and in vitro experiments. Bioconjug Chem. 2005;16(5):1181–1188. doi: 10.1021/bc050050z. [DOI] [PubMed] [Google Scholar]
- 9.Choi H, et al. Iron oxide nanoparticles as magnetic resonance contrast agent for tumor imaging via folate receptor-targeted delivery. Acad Radiol. 2004;11(9):996–1004. doi: 10.1016/j.acra.2004.04.018. [DOI] [PubMed] [Google Scholar]
- 10.Holliger P, Hudson PJ. Engineered antibody fragments and the rise of single domains. Nat Biotechnol. 2005;23(9):1126–1136. doi: 10.1038/nbt1142. [DOI] [PubMed] [Google Scholar]
- 11.Galvin JM, et al. Implementing IMRT in clinical practice: a joint document of the American Society for Therapeutic Radiology and Oncology and the American Association of Physicists in Medicine. International journal of radiation oncology, biology, physics. 2004;58(5):1616–1634. doi: 10.1016/j.ijrobp.2003.12.008. [DOI] [PubMed] [Google Scholar]
- 12.Zelefsky MJ, et al. High dose radiation delivered by intensity modulated conformal radiotherapy improves the outcome of localized prostate cancer. J Urol. 2001;166(3):876–881. [PubMed] [Google Scholar]
- 13.Intensity Modulated Radiation Therapy Collaborative Working, G. Intensity-modulated radiotherapy: current status and issues of interest. Int J Radiat Oncol Biol Phys. 2001;51(4):880–914. doi: 10.1016/s0360-3016(01)01749-7. [DOI] [PubMed] [Google Scholar]
- 14.Whitton A, et al. Organisational standards for the delivery of intensity-modulated radiation therapy in Ontario. Clin Oncol (R Coll Radiol) 2009;21(3):192–203. doi: 10.1016/j.clon.2008.10.005. [DOI] [PubMed] [Google Scholar]
- 15.Bijamov A, et al. Optical Response of Magnetic Fluorescent Microspheres Used for Force Spectroscopy in the Evanescent Field. Langmuir. 2010;26(14):12003–12011. doi: 10.1021/la1015252. [DOI] [PMC free article] [PubMed] [Google Scholar]
- 16.Bijamov A, et al. Quantitative modeling of forces in electromagnetic tweezers. Journal of Applied Physics. 2010;108(10):104701. doi: 10.1063/1.3510481. [DOI] [PMC free article] [PubMed] [Google Scholar]
- 17.Kuznetsov AV. Optimization problems for bioheat equation. International Communications in Heat and Mass Transfer. 2006;33(5):537–543. [Google Scholar]
- 18.Pennes HH. Analysis of tissue and arterial blood temperatures in the resting human forearm. 1948. J Appl Physiol. 1998;85(1):5–34. doi: 10.1152/jappl.1998.85.1.5. [DOI] [PubMed] [Google Scholar]
- 19.Solazzo SA, et al. Radiofrequency ablation: importance of background tissue electrical conductivity--an agar phantom and computer modeling study. Radiology. 2005;236(2):495–502. doi: 10.1148/radiol.2362040965. [DOI] [PubMed] [Google Scholar]
- 20.Shubitidze F, et al. Application of the method of auxiliary sources to the wide-band electromagnetic induction problem. Geoscience and Remote Sensing, IEEE Transactions on. 2002;40(4):928–942. [Google Scholar]


