

Abstract
Reward responses in the medial temporal lobes and dopaminergic midbrain boost episodic memory formation in healthy adults, and weak memory for emotionally positive material in depression suggests this mechanism may be dysfunctional in major depressive disorder (MDD). To test this hypothesis, we performed a study in which unmedicated adults with MDD and healthy controls encoded drawings paired with reward or zero tokens during functional magnetic resonance imaging. In a recognition test, participants judged whether drawings were previously associated with the reward token (‘reward source’) or the zero token (‘zero source’). Unlike controls, depressed participants failed to show better memory for drawings from the reward source vs the zero source. Consistent with predictions, controls also showed a stronger encoding response to reward tokens vs zero tokens in the right parahippocampus and dopaminergic midbrain, whereas the MDD group showed the opposite pattern—stronger responses to zero vs reward tokens—in these regions. Differential activation of the dopaminergic midbrain by reward vs zero tokens was positively correlated with the reward source memory advantage in controls, but not depressed participants. These data suggest that weaker memory for positive material in depression reflects blunted encoding responses in the dopaminergic midbrain and medial temporal lobes.
Keywords: depression, memory, reward, fMRI
INTRODUCTION
Major depressive disorder (MDD) is characterized by anhedonia, the loss of interest in pleasurable activities (American Psychiatric Association, 2000). Translational research has advanced our understanding of anhedonia by linking it to research on brain reward systems in healthy humans and non-human animals. In particular, the identification of dopamine circuits that support reinforcement learning (Schultz, 1998) and motivated responding (Niv et al., 2007) provides a foundation for the neuroscientific study of anhedonia (Dichter et al., 2009; Pizzagalli et al., 2009; Treadway and Zald, 2011). Here, we extend this approach to investigate the neurobiology of a reliable behavioral phenomenon: weak memory for positive material in depression.
Several studies document better memory for positive vs neutral or negative material in healthy adults, but not their depressed counterparts. For example, Dunbar and Lishman (1984) presented depressed inpatients and healthy controls with positive, negative and neutral words. Thirty minutes later, controls showed better memory for positive vs neutral and negative words, whereas the depressed group showed better memory for negative vs positive words. Furthermore, compared with controls, the depressed group showed worse accuracy for positive words but better accuracy for negative words. Thus, depression blunted memory for positive material while enhancing memory for negative material.
Similarly, Hamilton and Gotlib (2008) presented emotional pictures to controls and adults with MDD. One week later, controls showed better memory for positive vs negative pictures, whereas the MDD group showed better memory for negative pictures than controls. Enhanced memory for negative material in depression was linked to stronger amygdala activation at encoding, but it was unclear why controls remembered positive pictures better than negative pictures, or why this positive memory effect was absent in MDD.
Several functional magnetic resonance imaging (fMRI) studies in healthy adults have suggested an answer to these questions by demonstrating that rewarding stimuli (e.g. monetary incentives) boost episodic memory formation via activation of the dopaminergic midbrain and medial temporal lobe (MTL) regions, such as the hippocampus and parahippocampus. For example, in a recent study, healthy volunteers studied objects preceded by high-value or low-value cues indicating how much money could by earned for remembering the objects in an upcoming test (Wolosin et al., 2012). Memory accuracy was better for objects paired with high-value vs low-value cues, and Memory × Reward interactions were observed in the right parahippocampus and the ventral tegmental area/substantia nigra (VTA/SN), which comprises the dopaminergic midbrain. These interactions were driven by greater activation for subsequently remembered (vs forgotten) objects presented after the high-value cues, demonstrating that the monetary incentives boosted encoding activation (see also Adcock et al., 2006; Wittmann et al., 2008).
These results suggest that weak memory for positive material in MDD may reflect blunted encoding responses in the VTA/SN and MTL. To test this hypothesis, we performed an fMRI study in which depressed adults and healthy controls encoded drawings followed by reward or zero tokens. For brevity, we refer to drawings paired with reward and zero tokens as coming from the ‘reward source’ and ‘zero source’, respectively. A recognition test immediately followed. We predicted that controls—but not depressed participants—would show better memory for drawings from the reward source vs the zero source. Moreover, we expected this effect to be mirrored by differential encoding activation in the VTA/SN and MTL, with these regions showing stronger responses to reward (vs zero) tokens in controls, but not depressed participants. Similarly, we expected VTA/SN and MTL activation to correlate with memory accuracy in controls, but not depressed participants.
MATERIALS AND METHODS
Participants
Results are from 21 unmedicated individuals diagnosed with MDD and 21 healthy controls (for details on diagnostic interviews used to establish eligibility, see the Supplementary Material). Additional data were excluded due to excessive head motion (>4 mm or degrees incremental: controls, n = 4; MDD, n = 1), failure to respond consistently during encoding (>14 encoding trials with no response: controls, n = 1; MDD, n = 2) and disclosure of antidepressant use (MDD, n = 1). Participants were compensated $25/h for the fMRI session. All procedures were approved by the Harvard Committee on the Use of Human Subjects in Research and the McLean Hospital Institutional Review Board.
Self-report measures
Participants completed the Beck Depression Inventory-II (BDI-II; Beck et al., 1996), Mood and Anxiety Symptoms Questionnaire (MASQ; Watson et al., 1995) and the Snaith-Hamilton Pleasure Scale (SHAPS; Snaith et al., 1995). The Wechsler Test of Adult Reading (WTAR; The Psychological Corporation, 2001) served as a brief IQ assessment. Total scores were computed for the BDI-II and SHAPS, and WTAR scores were standardized using age norms. Four scale scores were computed for the MASQ: General Distress-Depression (MASQ-GDD), Anhedonic Depression (MASQ-AD), General Distress-Anxiety (MASQ-GDA) and Anxious Arousal (MASQ-AA). Group differences on all measures were assessed by unpaired t-test.
Memory task
Encoding
During encoding, participants studied drawing-token associations (Figure 1A). There were 80 trials, divided over two runs. Each trial included a unique line drawing (3 s duration) (Snodgrass and Vanderwart, 1980), a jittered inter-stimulus interval (ISI: 2–5 s), a reward or zero token (1 s duration, 40 trials each) and a jittered inter-trial interval (ITI: 2–14 s). The reward token was a screen that read ‘REWARD! 50 Cents!’ accompanied by a chime sound. The zero token was a screen that read ‘ZERO! 0 Cents!’ accompanied by a tone. To ensure that participants remained attentive throughout encoding, they were asked to press a button when each drawing appeared. They were also instructed to try to remember whether each drawing was followed by the reward or zero token. The drawing-token pairings were arbitrary, and participants’ button presses did not affect token delivery. Trial sequences and ITI lengths were determined with optseq (Dale, 1999). No more than three reward or zero tokens were presented sequentially, and a fixation cross was visible during the ISI and ITI. The task was programmed in E-Prime (Psychology Software Tools, Inc., Sharpsburg, PA, USA).
Fig. 1.

Experimental design. (A) During encoding, participants studied drawing-token associations. Half of the drawings were followed by a reward token (‘reward source’), half were followed by a zero token (‘zero source’). (B) At recognition, old and new drawings were presented in two blocks that featured either a ‘Reward?’ cue or a ‘Zero?’ cue. These cues prompted participants to make a source memory judgment for each drawing. A three-point confidence rating scale (low, medium and high) followed each drawing (not shown). Sixty drawings were tested under each cue (20 reward source, 20 zero source and 20 new).
We use the term ‘token’ because participants did not receive additional money for the reward tokens, but were instructed to think of them as representing a portion of their fixed payment. Participants knew they would not receive additional money for the reward tokens, and that payment was not influenced by performance. We decoupled the tokens from payment because, while we wanted the reward tokens to elicit positive emotional responses, we also wanted all drawing-token associations to be equally important with respect to the memory test. By emphasizing that participants should try to remember all drawing-token associations—not just the drawings paired with reward tokens—and by making it clear that the reward tokens would not yield additional pay, we sought to minimize the possibility that group differences in reward source memory would emerge because of differences in motivation to earn extra money.
Note that this approach differs from methods used in prior studies to show that the prospect of increased pay can improve memory (e.g. Adcock et al., 2006). In those studies, participants viewed cues indicating that remembering certain items would yield larger payments than remembering other items. In addition, most prior studies placed motivational cues before the items to be remembered, whereas we placed the reward and zero tokens after the drawings. This increases the likelihood that participants will attend carefully to each drawing, and minimizes the possibility that differences in source memory would be driven by differences in participants’ attention to the drawings (because participants could not know to which source a drawing belonged until the reward or zero token was presented).
Recognition
The recognition test directly followed encoding (Figure 1B). There were 120 trials, which included 40 drawings from the reward source, 40 from the zero source and 40 new drawings. In one block, drawings (4 s duration) appeared under a ‘REWARD?’ cue and participants pressed a button for ‘yes’(this is from the reward source) or ‘no’(this is not from the reward source). In another block, drawings appeared under a ‘ZERO?’ cue and participants pressed a button for ‘yes’ (this is from the zero source) or ‘no’(this is not from the zero source). Sixty drawings (20 reward source, 20 zero source and 20 new) were tested under each cue, and assignment of cues to the first and second blocks was counterbalanced across participants. A screen reading ‘Confidence?’ (2 s duration) followed each drawing, and participants pressed one of three buttons to indicate their level of confidence (low, medium and high) in each memory judgment. Jittered intervals (3–15 s) separated the trials.
The recognition cue manipulation investigated whether directing participants’ attention toward or away from the reward source during retrieval would affect accuracy (March and Hicks, 1998). We predicted that controls—but not depressed participants—would show better reward source accuracy when responding to the ‘REWARD?’ cue vs the ‘ZERO?’ cue. This hypothesis was not supported. A preliminary Group × Cue × Source (reward, zero and new) ANOVA on accuracy data yielded a significant Group × Source interaction but no significant interactions between Cue and either Group or Source (see Supplementary Material). Furthermore, there was no group difference in the percentage of correctly rejected new drawings (controls: 86.18 ± 15.36; MDD: 81.53 ± 17.83; t < 1, P = 0.37). Therefore, to focus on the Group × Source interaction, we present accuracy and RT data collapsed across the recognition cues and omit responses to new drawings from further analysis. Importantly, we verified that group differences in source memory did not reflect response bias effects (see Supplementary Material). Because we hypothesized that group differences in source memory would reflect negative effects of MDD on encoding responses to reward tokens, we only present fMRI data from encoding.
Post-task ratings
Following the memory task, the reward and zero tokens were presented once more with their accompanying sounds, and participants used five-point scales to rate each token for arousal (1 = low arousal, 5 = high arousal) and valence (1 = very unpleasant, 3 = neutral, 5 = very pleasant). Participants rated their current, ‘in the moment’ emotional response to each token, and did not retrospectively rate their responses during the encoding runs. No fMRI data were collected during these brief ratings, which were made in the scanner.
fMRI acquisition
MRI data were collected on a 3 T magnet (Siemens, USA; 12-channel head coil). The MRI sessions included an auto-align localizer (van der Kouwe et al., 2005), a T1-weighted multi-echo magnetization prepared rapid acquisition gradient echo (MEMPRAGE; van der Kouwe et al., 2008) structural image [1.2 mm3 voxels; 144 slices; repetition time (TR) = 2.2 s; echo time (TE)1/2/3/4 = 1.54/3.36/5.18/7.01 ms] and T2*-weighted images sensitive to blood oxygen level-dependent contrast, acquired during the memory task (3.0 mm3 voxels; 46 slices; TR = 3 s; TE = 30 ms; flip angle = 85°; transverse acquisition).
Behavioral data analysis
Post-task ratings
Arousal and valence ratings were entered in Group × Token ANOVAs. Gender was included in all ANOVAs conducted on behavioral data, but it did not interact with any variable of interest and was removed to conserve degrees of freedom. Alpha was set to 0.05.
Encoding
Between-group t-tests compared the number and median RT of encoding responses. Median data were used in RT analyses to minimize the influence of extreme values.
Source accuracy
A Group × Source (reward, zero) ANOVA was conducted on percent correct data. Reward minus zero source accuracy difference scores were also computed for each participant and entered in a between-group t-test.
Recognition RT
Median RTs were entered in a Group × Source ANOVA.
Confidence
Mean confidence ratings were entered in a Group × Source ANOVA.
Source accuracy regression
To determine if Group predicted reward minus zero source accuracy scores after accounting for variables unspecific to depression, a linear regression tested for effects of Group (entered second: control = 0, MDD = 1) after accounting for age, education, WTAR, MASQ-GDA and MASQ-AA scores (entered first).
fMRI data analysis
Pre-processing
Five volumes from the start of each run were discarded for stabilization of longitudinal magnetization, and slice-time correction was accomplished with SPM2 (Wellcome Department of Cognitive Neurology, London, UK). Next, the data were corrected for head motion, normalized to MNI152 templates (2 mm3 voxels) and spatially smoothed (6 mm full-width at half-maximum) using FSL software (Jenkinson et al., 2002; Smith, 2002).
Source memory analysis
SPM8 (Wellcome Department of Cognitive Neurology) was used for general linear modeling. Delta functions placed at drawing and token onset times were convolved with SPM’s canonical hemodynamic response function, and nuisance regressors accounted for run-to-run fluctuations in mean image intensity. The data were high-pass filtered (cut-off period: 128 s).
The fMRI analysis was used to identify brain regions supporting a group difference in reward vs zero source memory. For each participant, we computed contrasts comparing the response to each token (reward, zero) vs fixation. For the purposes of the group-level ANOVA, we also binned the drawings according to which token (reward or zero) followed them, and then contrasted the response to drawings vs fixation. Finally, we entered the contrast images in a whole-brain, random effects Group × Stimulus (drawing, token) × Token Type (reward, zero) ANOVA. We expected Group × Stimulus × Token Type interactions in the MTL and VTA/SN, driven by stronger responses to reward vs zero tokens in controls vs depressed participants.
To strengthen the link to memory, this analysis was restricted to trials that led to successful remembering. There was no group difference in the number of correctly remembered drawings from the reward source [controls: 29.29 ± 6.75; depressed: 25.57 ± 7.33; t(40) = 1.71, P = 0.10] or the zero source [controls: 24.48 ± 5.35; depressed: 26.81 ± 5.46; t(40) = −1.40, P = 0.17]. Unfortunately, low trial counts precluded analysis of memory failures (i.e. 17 participants had 10 or fewer incorrect reward source responses).
The voxelwise P-value was set to 0.005. Based on prior work (e.g. Davachi et al., 2003), we expected group differences in reward source memory to reflect variation in parahippocampal or hippocampal encoding activation, in addition to the VTA/SN. However, we had no hypotheses distinguishing between these regions or the two hemispheres. Therefore, when evaluating the Group × Stimulus × Token Type interaction in the MTL, we corrected for multiple comparisons over a bilateral hippocampal/parahippocampal mask from the Automated Anatomical Labeling atlas (Tzourio-Mazoyer et al., 2002). In the VTA/SN, we corrected for multiple comparisons over an 8 mm radius sphere centered on the MNI coordinates [2, −14, −16], derived from a high-density fMRI study of the VTA/SN (Krebs et al., 2011; see Supplementary Material). For all other contrasts and brain regions, we corrected for multiple comparisons over the whole brain. Only activations whose peak activation was significant at P < 0.05 (corrected) are reported. MarsBaR (Brett et al., 2002) was used to extract beta weights for additional analysis, and MRIcron (Rorden and Brett, 2000) was used for display.
RESULTS
Self-report data
As expected, the MDD group reported more severe symptoms of depression, anhedonia and anxiety than controls (Table 1). Based on the mean BDI-II score (23.62 ± 7.17), the MDD group was moderately depressed. Additional clinical data are presented in the Supplementary Material.
Table 1.
Demographics and mean (s.d.) self-report data
| Variable | Controls | Depressed | P |
|---|---|---|---|
| Gender | 9 f, 12 m | 11 f, 10 m | 0.54 |
| Age | 36.62 (13.32) | 34.33 (12.16) | 0.57 |
| Education (years) | 16.67 (2.06) | 16.19 (2.34) | 0.49 |
| BDI-II | 0.81 (1.40) | 23.62 (7.17) | <0.001 |
| MASQ-GDD | 13.95 (2.84) | 38.05 (9.98) | <0.001 |
| MASQ-AD | 43.71 (9.87) | 83.00 (9.09) | <0.001 |
| MASQ-GDA | 12.71 (2.08) | 24.19 (5.50) | <0.001 |
| MASQ-AA | 18.00 (1.61) | 23.71 (6.86) | 0.001 |
| SHAPS | 0.24 (0.54) | 5.10 (3.75) | <0.001 |
| WTARa | 116.68 (7.31) | 113.11 (11.37) | 0.26 |
f, female; m, male.
aWTAR data from non-native English speakers were not analyzed (controls, n = 2; MDD, n = 2).
Behavioral data
Post-task ratings
The reward token was rated more pleasant [reward: 4.29 ± 0.94; zero: 2.05 ± 1.21; Token, F(1, 40) = 95.42, P < 0.001] and arousing [reward: 3.67 ± 0.98; zero: 2.76 ± 1.41; Token, F(1, 40) = 10.15, P = 0.003] than the zero token. There were no effects involving Group (Ps > 0.18).
Encoding
There were no group differences in the number of on-time responses [controls: 78.71 ± 2.12; MDD: 76.81 ± 4.09; t(40) = 1.89, P = 0.07] or the median RT [controls: 969.97 ± 267.09 ms; MDD: 904.45 ± 185.55 ms; t(40) = 1.37, P = 0.18].
Source memory accuracy
As predicted, there was a Group × Source interaction, F(1, 40) = 6.29, P = 0.02 (Figure 2A). Controls showed better accuracy for drawings from the reward source vs the zero source, t(20) = 3.23, P = 0.004, d = 0.71. In contrast, depressed participants showed numerically better accuracy for drawings from the zero source vs the reward source, but this was unreliable, t(20) < 1, P = 0.50.
Fig. 2.

(A) In contrast to the controls, the MDD group failed to show better accuracy for drawings from the reward source vs the zero source. (B) The mean reward minus zero source accuracy difference score was more positive in controls vs the MDD group. (C) More controls (17/21) than depressed participants (9/21) showed a positive reward minus zero source accuracy difference score. (D) In controls only, correct recognition decisions were rendered faster for drawings from the reward source vs the zero source. Compared with controls, the MDD group made faster correct recognition decisions for drawings from the zero source. Bars indicate standard error.
A between-group t-test on reward source accuracy was not significant. However, as shown in Figure 2B, the mean reward minus zero source accuracy difference score was more positive in controls vs the MDD group, t(40) = 2.51, P = 0.02, d = 0.78. Furthermore, 17 of 21 controls (binomial P = 0.007) but only 9 of 21 depressed participants (binomial P = 0.66) showed a positive difference score,  = 6.46, P = 0.01 (Figure 2C). Reward minus zero source accuracy scores did not differ between depressed participants with vs without comorbid anxiety and were not correlated with BDI-II, SHAPS, MASQ-GDD or MASQ-AD scores in the MDD group.
Confidence rating
No significant effects emerged (Ps > 0.08).
Recognition RT
The Group × Source interaction was marginal, F(1, 40) = 3.08, P = 0.09 (Figure 1D). In controls, RTs were faster for drawings from the reward source vs the zero source, t(20) = 2.17, P = 0.04. In contrast, in depressed participants RTs were numerically faster for drawings from the zero source vs the reward source, but this was unreliable, t(20) < 1, P = 0.60. Depressed participants responded faster than controls for drawings from the zero source, t(40) = 2.17, P = 0.04.
Source accuracy regression
Group emerged as the only significant predictor (ß = −0.64, P = 0.02) of reward minus zero source accuracy after accounting for age, education and WTAR, MASQ-GDA and MASQ-AA scores (Ps > 0.13). Furthermore, Group explained unique variance above and beyond all variables entered in the first step of the model [ΔR2 = 0.13, ΔF(1, 35) = 6.06, P = 0.02]. Thus, the group difference in reward vs zero source accuracy was not explained by variables unspecific to depression.
fMRI
A complete list of activations is provided in Table 2. Based on our a priori hypothesis, we focus on the response to reward and zero tokens in brain regions that showed a Group × Stimulus × Token Type interaction. See the Supplementary Material for additional results, including VTA/SN and right parahippocampal responses to drawings.
Table 2.
Activations in the Group × Stimulus × Token Type fMRI ANOVA
| Region | x | y | z | Voxels | Z | FWE-corrected P-value |
|---|---|---|---|---|---|---|
| Group × Stimulus × Token Type | ||||||
| Right parahippocampal gyrusa | 26 | −26 | −24 | 32 | 3.95 | 0.035 |
| VTA/SNb | −2 | −16 | −16 | 26 | 4.18 | 0.002 |
| Group × Stimulus | ||||||
| No significant activations | ||||||
| Group × Token Type | ||||||
| No significant activations | ||||||
| Stimulus × Token Type | ||||||
| No significant activations | ||||||
| Main effect of stimulus | ||||||
| Right Heschl’s gyrus | 54 | −16 | 4 | 14 730 | Infinite | <0.001 |
| Left superior temporal gyrus | −54 | −24 | 2 | 24 633 | Infinite | <0.001 |
| Left intracalcarine cortex | −10 | −88 | 2 | 14 632 | Infinite | <0.001 |
| Right occipital pole | 32 | −92 | 14 | 2864 | Infinite | <0.001 |
| Left precentral gyrus | −38 | −22 | 68 | 2445 | 7.01 | <0.001 |
| Left central opercular cortex | −40 | −2 | 12 | 166 | 6.60 | <0.001 |
| Left occipital pole | −30 | −90 | 14 | 1418 | 6.10 | <0.001 |
| Main effect of token type | ||||||
| Right Heschl’s gyrus | 52 | −18 | 4 | 348 | 5.63 | 0.001 |
| Left Heschl’s gyrus/planum temporal | −40 | −28 | 6 | 415 | 5.44 | 0.003 |
| Right postcentral gyrus/white matter | 30 | −32 | 40 | 257 | 4.87 | 0.045 |
| Main effect of group | ||||||
| No significant activations | ||||||
Activations localized with the Harvard-Oxford cortical/subcortical structural atlases. Voxelwise P-value set at 0.005. Only clusters with a FWE-corrected P-value <0.05 are reported (peak-level). Multiple comparison correction over: astructurally defined bilateral hippocampal/parahippocampal mask; b8 mm radius sphere centered at [2, −14, −16], based on Krebs et al. (2011).
Group × Stimulus × Token Type interactions
Triple interactions emerged in the VTA/SN (Figure 3A) and right parahippocampus (Figure 3B). To follow-up these effects, beta weights indexing responses to reward and zero tokens were extracted from both clusters and submitted to Group × Token Type follow-up ANOVAs. Significant interactions were confirmed in the VTA/SN, F(1, 40) = 12.32, P = 0.001 and right parahippocampus, F(1, 40) = 11.40, P = 0.002. Similar analyses focused on the response to drawings in these two brain regions revealed no significant differences between the groups (see Supplementary Material).
Fig. 3.

Group differences in the response to reward and zero tokens were observed in the (A) VTA/SN and (B) right parahippocampus. fMRI data are thresholded at P < 0.005 (uncorrected); the scale bar corresponds to F values for the Group × Stimulus × Token Type interaction. Bar graphs (with standard error bars) show beta weights for reward and zero tokens vs fixation, plus the difference between them.
In the VTA/SN (Figure 3A), the response to reward tokens was stronger in controls vs depressed participants, t(40) = 2.34, P = 0.02, d = 0.72. In contrast, the response to zero tokens was marginally stronger in depressed participants vs controls, t(40) = −1.97, P = 0.06, d = 0.61. To parallel the memory analysis, we computed a difference score for each participant by subtracting the zero token beta weight from the reward token beta weight (Figure 3A). A between-group t-test on these difference scores was significant, t(40) = 3.51, P = 0.001, d = 1.11, as the mean reward minus zero difference score was more positive in controls. Finally, paired t-tests indicated that controls showed a marginally stronger response to reward vs zero tokens, t(20) = 1.85, P = 0.08, d = 0.41, while the depressed group showed the opposite result—a stronger response to zero vs reward tokens, t(20) = −3.68, P = 0.001, d = 0.81.
In the right parahippocampus, a slightly different pattern was observed. As shown in Figure 3B, there was no group difference in response to reward tokens, t(40) < 1, P = 0.60, d = 0.16. However, the depressed group responded more strongly to zero tokens than controls, t(40) = −3.81, P < 0.001, d = 1.18. As in the VTA/SN, reward minus zero difference scores were more positive in controls vs depressed participants, t(40) = 3.38, P = 0.002, d = 1.04. Finally, paired t-tests revealed that controls showed a stronger response to reward vs zero tokens, t(20) = 2.87, P = 0.01, d = 0.63, while the depressed group showed a marginally stronger response to zero vs reward tokens, t(20) = 1.86, P = 0.08, d = 0.41.
Relationship between VTA/SN and right parahippocampal activation
Prior work reported positive correlations between VTA/SN and MTL encoding responses in healthy volunteers (Shohamy and Wagner, 2008). To determine if this effect was present in our sample, we computed Pearson correlations between beta weights extracted from the VTA/SN and right parahippocampus. As shown in Figure 4, responses to reward tokens were positively correlated in controls, r = 0.57, P < 0.01, but no relationship was seen in depressed participants, r = −0.08, P = 0.73. Fisher’s test for independent correlations confirmed a stronger relationship in controls vs depressed participants, Z = 2.18, P = 0.03. Similar analyses of responses to zero tokens revealed no reliable correlations (controls: r = 0.29, P = 0.20; depressed: r = 0.24, P = 0.30).
Fig. 4.
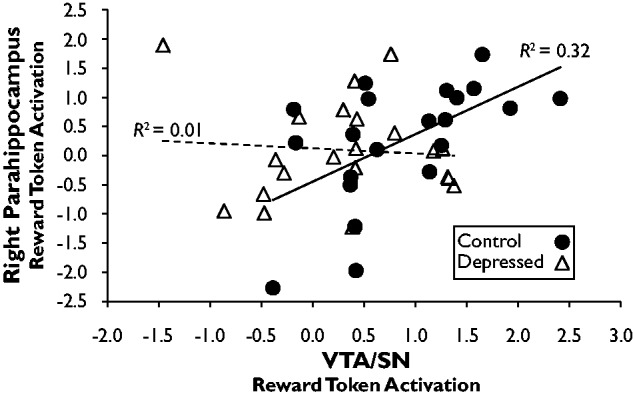
Relationship between responses to reward tokens in the VTA/SN and right parahippocampus. The correlation was significant in controls, but not depressed participants, and the strength of the correlation was significantly different between groups.
Relationship between memory and activation of the VTA/SN and right parahippocampus
Finally, we correlated reward minus zero source accuracy with reward minus zero token difference scores in the VTA/SN (Figure 5A) and right parahippocampus (Figure 5B). One control was excluded from this analysis; see Supplementary Material for details. In controls, a significant correlation was seen in the VTA/SN (r = 0.69, P = 0.001) with a trend in the right parahippocampus (r = 0.42, P = 0.07). In depressed participants, no relationship was seen in either region (VTA/SN; r = 0.07, P = 0.76; right parahippocampus: r = −0.16, P = 0.48). The correlation with VTA/SN activation was stronger in controls vs depressed adults, Z = 2.30, P = 0.02, with a trend in the right parahippocampus, Z = 1.84, P = 0.07.
Fig. 5.
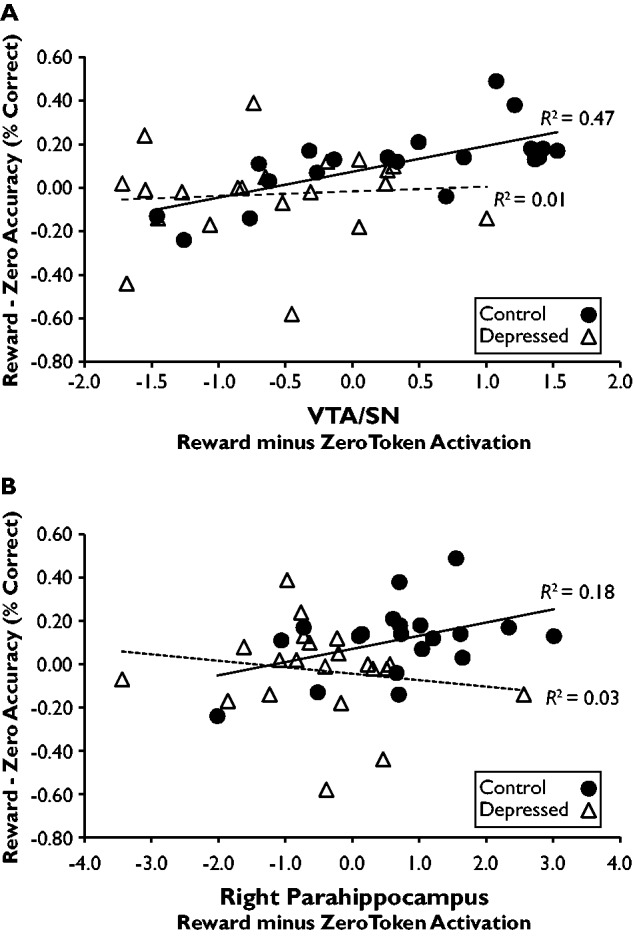
Relationship between reward minus zero source accuracy and reward minus zero token difference scores in the (A) VTA/SN and (B) right parahippocampus. In controls, the correlation was significant in the VTA/SN and marginal in the right parahippocampus. In depressed participants, the correlation was not significant in either region. The strength of the correlations differed significantly between groups in the VTA/SN, with a marginal difference in the right parahippocampus.
DISCUSSION
This study provides novel insight into weak memory for positive material in depression. In contrast to controls, the MDD group failed to show better memory for the reward source vs the zero source, yielding a group difference in reward minus zero source accuracy. This was not confounded by group differences in attention at encoding, as depressed participants responded as frequently and rapidly as controls. Furthermore, group differences in source memory were not driven by differential responses to the recognition cues, as the results held when responses to each recognition cue were considered separately, and when d′ was used instead of percent correct as the accuracy measure (see Supplementary Material). Instead, the group differences in source memory appear to reflect divergent encoding responses in the VTA/SN and right parahippocampus. In these regions, controls showed stronger responses to reward vs zero tokens, whereas depressed participants showed the opposite pattern: stronger responses to zero vs reward tokens. The consistency of this result across both regions is striking, although it should be noted that several within-group tests were marginally significant. Furthermore, the VTA/SN reward response was stronger in controls, and VTA/SN responses to the reward token (vs the zero token) were correlated with reward source (minus zero source) accuracy in controls, but not depressed participants. Collectively, these findings indicate that weak memory for positive material in depression reflects blunted encoding responses in the VTA/SN and MTL.
Stronger neural responses to zero tokens were seen in the MDD group. Valence ratings indicated that the zero tokens elicited unpleasant emotions, thus these results converge with reports of hypersensitivity to negative outcomes in depression (Beats et al., 1996; Holmes and Pizzagalli, 2008; Beevers et al., 2012), and echo prior findings of enhanced neural responses to negative material during encoding in MDD (Hamilton and Gotlib, 2008). Behaviorally, the MDD group showed a numerical advantage for zero vs reward source memory, but this was unreliable. This may reflect the fact that the zero token did not signal punishment; stronger findings would likely emerge if more intrinsically negative material had been used. Regardless, while this work highlights mechanisms supporting blunted memory for positive material in depression, the results also confirm increased sensitivity to non-rewarding outcomes in MDD.
What explains the group difference in VTA/SN and MTL responses?
The mechanism underlying group differences in VTA/SN and right parahippocampal responses is unclear, but differential activation of dopamine circuitry is a plausible candidate. Dopamine circuits linking the VTA/SN and MTL are believed to gate the entry of information into long-term memory, with dopamine bursts signaling which information is important enough to retain (Lisman and Grace, 2005). Along these lines, dopamine antagonists injected into the bilateral hippocampus of rodents prior to encoding render newly formed long-term memories unstable and susceptible to decay (Bethus et al., 2010). Several lines of evidence suggest that depression may involve dopamine dysfunction (Treadway and Zald, 2011). Thus, relatively poor reward source memory in MDD may reflect weaker responses to reward tokens in VTA/SN dopamine cells that serve to stabilize memory representations in the MTL.
We speculate that the strong response to zero tokens in depressed participants may reflect activation of GABAergic cells in the VTA. In rodents, optogenetic methods have been used to identify separate populations of VTA GABAergic and dopaminergic neurons (Cohen et al., 2012). While the dopaminergic neurons respond strongly to rewards and reward-predicting cues, the GABAergic neurons respond to aversive stimuli and inhibit dopamine firing. Thus, it is possible that the zero tokens may elicit stronger activation of these VTA cells in depressed vs healthy adults, which could translate into a stronger response to zero tokens in downstream regions such as the parahippocampus.
Of course, these explanations are speculative because fMRI data cannot speak directly to dopaminergic or GABAergic function. Nevertheless, they are sensible given the VTA data from rodents (Cohen et al., 2012), the framework linking dopamine-driven VTA/MTL interactions to episodic memory formation (Lisman and Grace, 2005), prior data from healthy volunteers in similar paradigms (Adcock et al., 2006; Wittmann et al., 2008; Wolosin et al., 2012), and evidence of disrupted dopamine function in depression (Treadway and Zald, 2011). Therefore, it would be valuable to test these hypotheses using other methods capable of directly probing dopamine function in humans.
Clinical/translational implications
The results presented here are novel and require replication. Nonetheless, it is worth considering some translational implications. First, while a substantial literature already documents the fact that depressed individuals recall negative events with ease, these data suggest a complementary, more insidious effect of depressive illness: it makes encoding positive events more difficult. Thus, a depressed individual not only suffers from an abundance of negative memories but may also struggle to form positive memories, even when the raw material is available. Second, by relating blunted reward responses in the VTA/SN to poor source memory, the findings bridge two symptoms of depression that are typically considered separately—such as anhedonia and memory impairments. Over the last decade, researchers have made significant progress linking anhedonia to dysfunction in putative dopamine circuits, emphasizing the impact of this dysfunction on mood and motivation (Treadway and Zald, 2011). The data presented here suggest that the negative effects of anhedonia may extend beyond mood and motivation, and into memory. Thus, although many of the neurobiological details remain to be elucidated, one clinical point is clear: anhedonia merits its status as a cardinal symptom of depression, and should be a primary target of clinical interventions.
Limitations
Several limitations should be acknowledged. First, by decoupling the reward tokens from payment and performance, we may have inadvertently limited their impact on brain activation and behavior. Future studies using rewards that confer additional payment are warranted. Second, while the post-task arousal and valence ratings were helpful for verifying that the tokens elicited the intended emotional responses, more sensitive measures would be preferable. In particular, simultaneous psychophysiological measurements (e.g. heart rate) might reveal negative effects of depression on emotional responses to these stimuli. Third, while our a priori hypotheses concerning source memory and activation of the VTA/SN and MTL were supported, our prediction that the ‘REWARD?’ recognition cue would selectively enhance reward vs source memory in controls—but not depressed participants—was not confirmed (see Supplementary Material). Source memory retrieval is an effortful process that recruits the dorsolateral prefrontal cortex (DLPFC; Dobbins et al., 2002), and depression has been consistently linked to DLPFC hypoactivation (Koenigs and Grafman, 2009) and difficulty with effortful tasks (Roy-Byrne et al., 1986). Therefore, although our recognition cueing manipulation did not affect memory accuracy as expected, the potential for impaired source memory retrieval in depression—possibly mediated by DLPFC hypofunction—is worthy of further inquiry.
Finally, the connection between memory and brain activation in this study must be considered preliminary, because there were too few incorrect responses to support a ‘subsequent memory’ analysis contrasting neural regions that support successful vs unsuccessful encoding. With this limitation in mind, we restricted our analysis to encoding trials that led to successful memory. This approach seemed preferable to analyzing the response to all reward and zero tokens, regardless of memory status, as this could reveal brain regions whose activation was entirely unrelated to encoding success. Furthermore, we found a reliable correlation between VTA/SN activation and memory accuracy in controls that was not present in the depressed group, with a similar trend in the right parahippocampus, which provides evidence linking brain activation to memory. Nonetheless, future studies should use a subsequent memory design (with sufficient ‘forget’ trials) to permit firmer claims about relationships between brain activation and memory in depression.
CONCLUSION
This study relates blunted reward source memory in depression to aberrant activation of the VTA/SN and right parahippocampus during encoding. The results highlight neural mechanisms implicated in weak memory for positive material in depression, as well as interwoven cognitive and affective dysfunction in MDD.
SUPPLEMENTARY DATA
Supplementary data are available at SCAN online.
Conflict of Interest
Dr Pizzagalli has received consulting fees from ANT North America Inc. (Advanced Neuro Technology), AstraZeneca, Ono Pharma USA, Servier and Shire for projects unrelated to the present research. Dr Dillon and Dr Dobbins report no conflicts of interest.
Supplementary Material
Acknowledgments
The authors gratefully acknowledge Nancy Hall Brooks, Andrew Cohen, Sunny Dutra and Laura Murray for their assistance with data collection. Portions of this work were presented as a poster at the 67th Annual Meeting of the Society of Biological Psychiatry (May 3–5, 2012, Philadelphia, PA, USA). This work was supported by the Brain & Behavior Research Foundation (NARSAD Young Investigator grant awarded to D.G.D.) and by the National Institute of Mental Health (grant numbers K99MH094438-01A1 to D.G.D and R01MH68376 to D.A.P.). I.G.D. was supported by R01MH073982.
REFERENCES
- Adcock RA, Thangavel A, Whitfield-Gabrieli S, Knutson B, Gabrieli JDE. Reward-motivated learning: mesolimbic activation precedes memory formation. Neuron. 2006;50:507–17. doi: 10.1016/j.neuron.2006.03.036. [DOI] [PubMed] [Google Scholar]
- American Psychiatric Association. Diagnostic and Statistical Manual of Mental Disorders. 4th edn. Washington, DC: American Psychiatric Association; 2000. [Google Scholar]
- Beats BC, Sahakian BJ, Levy R. Cognitive performance in tests sensitivity to frontal lobe dysfunction in the elderly depressed. Psychological Medicine. 1996;26:591–603. doi: 10.1017/s0033291700035662. [DOI] [PubMed] [Google Scholar]
- Beck AT, Steer RA, Brown GK. Manual for the Beck Depression Inventory-II. San Antonio, TX: The Psychological Corporation; 1996. [Google Scholar]
- Beevers CG, Worthy DA, Gorlick MA, Nix B, Chotibut T, Maddox TW. Influence of depression symptoms on history independent reward and punishment processing. Psychiatry Research. 2012;207:53–60. doi: 10.1016/j.psychres.2012.09.054. [DOI] [PMC free article] [PubMed] [Google Scholar]
- Bethus I, Tse D, Morris RGM. Dopamine and memory: modulation of the persistence of memory for novel hippocampal NMDA receptor-dependent paired associates. Journal of Neuroscience. 2010;30:1610–8. doi: 10.1523/JNEUROSCI.2721-09.2010. [DOI] [PMC free article] [PubMed] [Google Scholar]
- Brett M, Anton JL, Valabregue R, Poline JB. Region of Interest Analysis Using an SPM Toolbox. 2002. Presented at the 8th International Conference on Functional Mapping of the Human Brain, June 2–6, Sendai, Japan. [Google Scholar]
- Cohen JY, Haesler S, Vong L, Lowell BB, Uchida N. Neuron-type-specific signals for reward and punishment in the ventral tegmental area. Nature. 2012;482:85–8. doi: 10.1038/nature10754. [DOI] [PMC free article] [PubMed] [Google Scholar]
- Dale AM. Optimal experimental design for event-related fMRI. Human Brain Mapping. 1999;8:109–14. doi: 10.1002/(SICI)1097-0193(1999)8:2/3<109::AID-HBM7>3.0.CO;2-W. [DOI] [PMC free article] [PubMed] [Google Scholar]
- Davachi L, Mitchell JP, Wagner AD. Multiple routes to memory: distinct medial temporal lobe processes build item and source memories. Proceedings of the National Academy of Sciences of the United States of America. 2003;100:2157–62. doi: 10.1073/pnas.0337195100. [DOI] [PMC free article] [PubMed] [Google Scholar]
- Dichter GS, Felder JN, Petty C, Bizzell J, Ernst M, Smoski MJ. The effects of psychotherapy on neural responses to rewards in major depression. Biological Psychiatry. 2009;66:886–97. doi: 10.1016/j.biopsych.2009.06.021. [DOI] [PMC free article] [PubMed] [Google Scholar]
- Dobbins IG, Foley H, Schacter DL, Wagner AD. Executive control during episodic retrieval: multiple prefrontal processes subserve source memory. Neuron. 2002;35:989–96. doi: 10.1016/s0896-6273(02)00858-9. [DOI] [PubMed] [Google Scholar]
- Dunbar GC, Lishman WA. Depression, recognition-memory and hedonic tone a signal detection analysis. British Journal of Psychiatry. 1984;144:376–82. doi: 10.1192/bjp.144.4.376. [DOI] [PubMed] [Google Scholar]
- Hamilton JP, Gotlib IH. Neural substrates of increased memory sensitivity for negative stimuli in major depression. Biological Psychiatry. 2008;63:1155–62. doi: 10.1016/j.biopsych.2007.12.015. [DOI] [PMC free article] [PubMed] [Google Scholar]
- Holmes AJ, Pizzagalli DA. Spatiotemporal dynamics of error processing dysfunctions in major depressive disorder. Archives of General Psychiatry. 2008;65:179–88. doi: 10.1001/archgenpsychiatry.2007.19. [DOI] [PMC free article] [PubMed] [Google Scholar]
- Jenkinson M, Bannister P, Brady M, Smith S. Improved optimization for the robust and accurate linear registration and motion correction of brain images. Neuroimage. 2002;17:825–41. doi: 10.1016/s1053-8119(02)91132-8. [DOI] [PubMed] [Google Scholar]
- Koenigs M, Grafman J. The functional neuroanatomy of depression: distinct roles for ventromedial and dorsolateral prefrontal cortex. Behavioral Brain Research. 2009;201:239–43. doi: 10.1016/j.bbr.2009.03.004. [DOI] [PMC free article] [PubMed] [Google Scholar]
- Krebs RM, Heipertz D, Schuetze H, Düzel E. Novelty increases the mesolimbic functional connectivity of the substantia nigra/ventral tegmental area (SN/VTA) during reward anticipation: evidence from high-resolution fMRI. Neuroimage. 2011;58:647–55. doi: 10.1016/j.neuroimage.2011.06.038. [DOI] [PubMed] [Google Scholar]
- Lisman JE, Grace AA. The hippocampal-VTA loop: controlling the entry of information into long-term memory. Neuron. 2005;46:703–13. doi: 10.1016/j.neuron.2005.05.002. [DOI] [PubMed] [Google Scholar]
- March RL, Hicks JL. Test formats change source-monitoring decision processes. Journal of Experimental Psychology: Learning, Memory, and Cognition. 1998;24:1137–51. [Google Scholar]
- Niv Y, Daw ND, Joel D, Dayan P. Tonic dopamine: opportunity costs and the control of response vigor. Psychopharmacology (Berl) 2007;191:507–20. doi: 10.1007/s00213-006-0502-4. [DOI] [PubMed] [Google Scholar]
- Pizzagalli DA, Holmes AJ, Dillon DG, et al. Reduced caudate and nucleus accumbens response to rewards in unmedicated subjects with Major Depressive Disorder. American Journal of Psychiatry. 2009;166:702–10. doi: 10.1176/appi.ajp.2008.08081201. [DOI] [PMC free article] [PubMed] [Google Scholar]
- Rorden C, Brett M. Stereotaxic display of brain lesions. Behavioral Neurology. 2000;12:191–200. doi: 10.1155/2000/421719. [DOI] [PubMed] [Google Scholar]
- Roy-Byrne PP, Weingartner H, Bierer LM, Thompson K, Post RM. Effortful and automatic cognitive processes in depression. Archives of General Psychiatry. 1986;43:265–7. doi: 10.1001/archpsyc.1986.01800030083008. [DOI] [PubMed] [Google Scholar]
- Schultz W. Predictive reward signal of dopamine neurons. Journal of Neurophysiology. 1998;80:1–27. doi: 10.1152/jn.1998.80.1.1. [DOI] [PubMed] [Google Scholar]
- Shohamy D, Wagner AD. Integrating memories in the human brain: hippocampal-midbrain encoding of overlapping events. Neuron. 2008;60:378–89. doi: 10.1016/j.neuron.2008.09.023. [DOI] [PMC free article] [PubMed] [Google Scholar]
- Smith SM. Fast robust automated brain extraction. Human Brain Mapping. 2002;17:143–55. doi: 10.1002/hbm.10062. [DOI] [PMC free article] [PubMed] [Google Scholar]
- Snaith RP, Hamilton M, Morley S, Humayan A, Hargreaves D, Trigwell P. A scale for the assessment of hedonic tone the Snaith-Hamilton Pleasure Scale. British Journal of Psychiatry. 1995;167:99–103. doi: 10.1192/bjp.167.1.99. [DOI] [PubMed] [Google Scholar]
- Snodgrass JG, Vanderwart M. A standardized set of 260 pictures: norms for name agreement, image agreement, familiarity, and visual complexity. Journal of Experimental Psychology: Human Learning and Memory. 1980;6:174–215. doi: 10.1037//0278-7393.6.2.174. [DOI] [PubMed] [Google Scholar]
- The Psychological Corporation. Wechsler Test of Adult Reading Manual. San Antonio, TX: The Psychological Corporation; 2001. [Google Scholar]
- Treadway MT, Zald DH. Reconsidering anhedonia in depression: lessons from translational neuroscience. Neuroscience and Biobehavioral Reviews. 2011;35:537–55. doi: 10.1016/j.neubiorev.2010.06.006. [DOI] [PMC free article] [PubMed] [Google Scholar]
- Tzourio-Mazoyer N, Landeau B, Papathanassiou D, et al. Automated Anatomical Labeling of activations in SPM using a macroscopic anatomical parcellation of the MNI MRI single-subject brain. Neuroimage. 2002;15:273–89. doi: 10.1006/nimg.2001.0978. [DOI] [PubMed] [Google Scholar]
- van der Kouwe AJW, Benner T, Fischl B, et al. On-line automatic slice positioning for brain MR imaging. Neuroimage. 2005;27:222–30. doi: 10.1016/j.neuroimage.2005.03.035. [DOI] [PubMed] [Google Scholar]
- van der Kouwe AJ, Benner T, Salat DH, Fischl B. Brain morphometry with multiecho MPRAGE. Neuroimage. 2008;40:559–69. doi: 10.1016/j.neuroimage.2007.12.025. [DOI] [PMC free article] [PubMed] [Google Scholar]
- Watson D, Clark LA, Weber K, Assenheimer JS, Strauss ME, McCormick RA. Testing a tripartite model: II. Exploring the symptom structure of anxiety and depression in student, adult, and patient samples. Journal of Abnormal Psychology. 1995;104:15–25. doi: 10.1037//0021-843x.104.1.15. [DOI] [PubMed] [Google Scholar]
- Wittmann BC, Schiltz K, Boehler CN, Düzel E. Mesolimbic interaction of emotional valence and reward improves memory formation. Neuropsychologia. 2008;46:1000–8. doi: 10.1016/j.neuropsychologia.2007.11.020. [DOI] [PubMed] [Google Scholar]
- Wolosin SM, Zeithamova D, Preston AR. Reward modulation of hippocampal subfield activation during successful associative encoding and retrieval. Journal of Cognitive Neuroscience. 2012;24:1532–47. doi: 10.1162/jocn_a_00237. [DOI] [PMC free article] [PubMed] [Google Scholar]
Associated Data
This section collects any data citations, data availability statements, or supplementary materials included in this article.