

Abstract
Objectives
Large-scale incidents such as the 2009 H1N1 outbreak, the 2011 European Escherichia coli outbreak, and Hurricane Sandy demonstrate the need for continuous improvement in emergency preparation, alert, and response systems globally. As questions relating to emergency preparedness and response continue to rise to the forefront, the field of industrial and systems engineering (ISE) emerges, as it provides sophisticated techniques that have the ability to model the system, simulate, and optimize complex systems, even under uncertainty.
Methods
We applied three ISE techniques—Markov modeling, operations research (OR) or optimization, and computer simulation—to public health emergency preparedness.
Results
We present three models developed through a four-year partnership with stakeholders from state and local public health for effectively, efficiently, and appropriately responding to potential public health threats: (1) an OR model for optimal alerting in response to a public health event, (2) simulation models developed to respond to communicable disease events from the perspective of public health, and (3) simulation models for implementing pandemic influenza vaccination clinics representative of clinics in operation for the 2009–2010 H1N1 vaccinations in North Carolina.
Conclusions
The methods employed by the ISE discipline offer powerful new insights to understand and improve public health emergency preparedness and response systems. The models can be used by public health practitioners not only to inform their planning decisions but also to provide a quantitative argument to support public health decision making and investment.
The inevitable threat of natural disasters and manmade attacks has made emergency preparedness an issue of constant concern. Large-scale incidents such as the 2009 H1N1 outbreak, the 2011 European Escherichia coli outbreak, and Hurricane Sandy demonstrate the need for continuous improvement in emergency preparation, alert, and response systems across the globe. Industrial and systems engineering (ISE) techniques are well suited to address these challenges. Industrial and systems engineers solve problems by examining the way an entire system works together rather than just focusing on individual parts. They look at decision making as well as technical processes to figure out how to do things better. Systems engineers work with models to show the big picture of how processes are connected and interdependent, while focusing on the value of each action to achieve the desired result. ISE techniques involve the ability to quantify performance and readiness metrics of a system and translate data into real-time information quickly and accurately. Considering the importance of timely and accurate information during an emergency, these techniques have the potential to greatly enhance both the design and operation of current emergency systems and serve as an aid in identifying unforeseen and counterintuitive deficiencies or bottlenecks within a system that may be undetectable to the naked eye. The power of this approach comes from the ability to conduct what-if scenarios to examine modifications to systems without implementing the change.
The primary objective of this study was to use systems engineering techniques to develop Markovian, optimization, and simulation models to address public health preparedness problems. Specifically, we developed tools for visualizing emergency events and modeling the emergency response process. These models seek to capture the interdependencies at a system level, enabling public health stakeholders to evaluate the impact of various potential threats, compare/quantify the impact of response strategies, and explore what-if scenarios. Although these models began as rough sketches on a white board, they eventually became sophisticated mathematical/computer simulations of events that can be used to maximize efficiency, productivity, and effectiveness. Other studies have employed modeling techniques and operations research for public health preparedness,1 emergency management,2 and homeland security applications.3 Compilations of such models could be found in the surveys by Altay and Green,4 Stilianakis and Consoli,5 and in the Handbook of Operations Research for Homeland Security.6 Although the use of systems engineering models for vaccination clinic planning is not a novel concept,7 simulation models are not yet part of routine vaccination clinic planning efforts for many local health departments (LHDs), and the tools of optimization and Markov modeling have not been extensively applied to public health practice.
Through the work of the North Carolina Preparedness and Emergency Response Research Center (NCPERRC), funded by the Centers for Disease Control and Prevention (CDC), the research described in this article is an effort to help bridge this research-to-practice gap. The research brought together experiences and expertise from local public health practitioners and engineering researchers to address real-world local preparedness planning issues with collaborative, tailored, and innovative solutions. In the process, several public health preparedness and response systems were examined and recommendations were made to improve the effectiveness of systems for health alert and notification, disease outbreak control, and point-of-dispensing (POD) planning.
METHODS
We employed three tools of ISE—Markov chain modeling, computer simulation, and optimization—to facilitate the development of a more effective and efficient emergency response system. In addition, we conducted in-person and phone interviews with public health staff, observed public health events to collect data, and examined system-generated data from public health electronic systems to inform model development.
Public health alerting and notification
We explored the relationship between local and state health departments with respect to issuing alerts and responding to a potential disease outbreak such as influenza. We modeled the public health system as a multi-agent partially observable Markov decision process (POMDP), where local and state health departments are decision makers. There are many applications of POMDPs to health-care problems.8–11 The surveys by Monahan,12 Cassandra,13 and Yaylali and Ivy14 provide reviews of this literature. The model is used to determine when local and state decision makers should issue an alert or initiate mitigation actions such as vaccination in response to a disease threat.
The model incorporates the fact that health departments have imperfect information about the exact number of infected people. The objective of the model is to minimize both false alerts and late alerts while identifying the optimal timing for alerting decisions. Providing such a balance between false and late alerts has the potential to increase the -credibility and efficiency of the public health system while improving immediate response and care in the event of a public health emergency. We used data from the 2009–2010 H1N1 influenza outbreak, including data from CDC's FluView and Influenza Sentinel Provider Network reports,15 the North Carolina Division of Public Health (NC DPH) state laboratory results,16 and North Carolina State University (NCSU) Student Health Services data, to estimate model parameters such as observation distributions and transition probabilities. To gain insight regarding the structure of optimal alerting policies at the local and state levels, we explored various model parameters including false and late alerting costs. A detailed discussion of these models can be found elsewhere.17,18
Outbreak investigation contact tracing and control of disease spread
While there is extensive literature on the use of simulation to model the epidemiology of infectious diseases19–21 and various interventions such as contact tracing,22–26 relatively little work has examined the effect of resource availability and different resource deployment policies on the spread and containment of disease outbreaks. We developed a discrete-event simulation model in C/C++ computer programming language of an LHD and its response to a pertussis outbreak. As shown in Figure 1, the model begins with an initial infected patient and follows the flow of contacts through becoming infectious, infecting others, seeking care, being contacted, and potentially becoming a confirmed case.
Figure 1.
Pertussis disease spread simulation in a populationa

aThe infection starts with an initial infected patient (patient 0), and some healthy contacts (open circles) become sick (light gray circles). The disease spread ends if there are no new infected contacts in the population.
We took a comprehensive view of public health actions, beginning with detection of an individual patient, confirmation of the case by physician and laboratory tests, and contact tracing and isolation of contacts by LHD personnel. We explicitly modeled the information transfer among providers, laboratories, and LHDs and examined the effect of different alerting strategies on the number of confirmed cases encountered. Contact tracing, a key mitigation method for pertussis, was modeled and the effect of limited resource availability for contact tracing was examined. We explored the impact of the time to initiate response and the resource availability of the health department on outbreak management policies. The model was parameterized using NC case data as well as information from the NC Public Health Information Network. We ran the simulation model for 500 replications until contact tracing stopped. The threshold for the number of confirmed cases required before contact tracing began was varied and different resource levels were evaluated. A detailed discussion of this model can be found in Yaylali17,18 in addition to an earlier version of this model, which is presented in Worth et al.27
Mass vaccination clinic/POD planning
One of the challenges in implementing mass vaccination clinics during the H1N1 pandemic included setting appropriate staffing levels to vaccinate an unknown number of community members on any given day a vaccination clinic was offered. Some other challenges to this type of clinic planning include determining the most efficient patient flow pattern, minimizing patient time spent filling out forms, and reducing bottlenecks.28 Computer simulation models are tools that can help planners address some of these challenges.29–32 This research describes a collaborative effort to try to re-create (via computer simulation models) several different types of clinics implemented during the H1N1 pandemic to help health directors and frontline staff explore opportunities for improved vaccination clinic efficiency.
In spring 2010, the Southern Piedmont Partnership for Public Health (SPPPH), a voluntary association of LHDs collaborating to improve public health practice,33 partnered with the NCPERRC to explore the use of systems engineering modeling to help understand and improve their implementation of mass vaccination clinics. Using local data and information derived from discussions with SPPPH, a set of six county-specific computer simulation models of the local public health clinics (e.g., drive-through and school-based) set up during the H1N1 pandemic were developed and validated for accuracy by the health department staff. The NC LHDs shared the details of their clinic operations to inform development of the discrete event simulation (DES) models and facilitate the creation of reasonably accurate 3D depictions of the clinics using Simio® simulation software.34 A sample model is shown in Figure 2.
Figure 2.
Snapshot of a Simio® Discrete Event Simulation model animation of a mass vaccination clinica

aWaiting clients are guided into the clinic by a crowd control agent. Inside, clients are assisted with completing forms before entering one of the vaccination areas staffed by nurses.
RESULTS
Public health alerting and notification
Figure 3 plots the optimal alert policy as a function of the no-threat probability and the decision-time horizon as defined by the time remaining in the problem horizon. The no-threat probability represents the public health decision maker's uncertainty or belief regarding the level of threat that is present. As shown in Figure 3, the optimal alerting thresholds for the state and local levels are different. If the decision maker believes there is no threat to the public, the probability of no threat is 1; as the decision maker's concern about a public health threat grows, the no-threat probability decreases (where 0 means the decision maker feels certain that there is a public health threat). The alert thresholds are affected by the penalties associated with late alerting and false alerting, and the effect differs at the state and local levels.
Figure 3.
Optimal alerting policies for responding to a possible public health threat for a state and local health department as a function of time (weeks) and the probability that the health department believes there is no threat when model parameters are estimated from 2009–2011 H1N1 outbreak data in North Carolinaa

aThe areas with gray from lighter to darker in (a) and (b) correspond to the optimal actions Type 2 Alert (active surveillance and mitigation), Type 1 Alert (active surveillance), and Wait, respectively, or the given probability of no threat and time. The lines denote the thresholds between different actions. The no-threat probability represents the level of disease threat the health department believes is present (e.g., if the probability is 0, the health department feels certain there is an outbreak, and if the probability is 1, the health department feels certain there is no disease outbreak). The time remaining is the number of weeks remaining until the end of the time horizon. (The time horizon is set to 100 weeks.)
The relationship between late alerting and false alerting is defined as relative weights associated with the actions chosen in the model. Because it is difficult to accurately estimate the cost of different alert types and the penalty for late alerts, these weights are not absolute cost values for alerting; rather, they are marginal values chosen between 0 and 1 for two types of alerts, Type 1 (active surveillance) and Type 2 (active surveillance and mitigation), and late alerting. Combining these weights with the state of the system in the model, we observed timely, late, or false alerts. For example, the penalty of late alerting occurs when the system is in the outbreak state and the decision makers choose to wait to take action. Similarly, the decision makers incur the cost of alerting (Type 1 or Type 2) when they choose one of these actions. For example, we could consider the situation of being in a no-threat state and choosing to alert to be false alerting. In Figure 3, the following relationship is assumed: cost of a Type 1 Alert < cost of late alerting < cost of a Type 2 alert with values of 0.1, 0.2, and 0.3, respectively. For the local level, when the penalty associated with late alerts increases, the system issues Type 1 alerts more frequently. For the state level, when the penalty associated with late alerts increases, the threshold for the wait action increases.
Outbreak investigation contact tracing and control of disease spread
We established a base case where the LHD has three communicable disease (CD) nurses and initiates contact tracing upon detection of one confirmed case. We then varied these base levels of resources and thresholds to analyze the effect on the outbreak spread, which is measured by the number of confirmed cases and the time that the outbreak ends. The number of contacts traced is used to measure the change in the workload of the LHD as a function of the contact tracing policy. Figure 4 shows the frequency distributions for the number of confirmed cases, the number of contacts traced, and the length of the outbreak (i.e., the time until no cases/contacts remained to trace) for 500 replications for each scenario. We used the simulation model to evaluate scenarios with thresholds of one, two, and three confirmed cases when three CD nurses are available for four hours a day, seven days a week. When the LHD starts contact tracing with one confirmed case, the number of confirmed cases is usually in the range of one to four. The frequency decreases as the upper bound of the interval increases. When the LHD starts contact tracing with two or three confirmed cases, the number of confirmed cases resulting from the outbreak increases, with the most frequent intervals for these thresholds being 5–8 cases and 17–20 cases, respectively. There is a similar trend in the number of contacts traced and time to control outbreak, as seen in Figures 4b and 4c. As the contact tracing threshold increases, the number of contacts is more likely to be greater, and the outbreak is more likely to last longer.
Figure 4.
Simulation results of the workload associated with controlling a disease outbreak as a function of the number of cases required to initiate contract tracing (i.e., the threshold) generated by the pertussis simulation model based on North Carolina case data from 2007–2008a

aOf 500 simulation replications: (a) corresponds to the frequency distribution for the total number of confirmed cases, (b) corresponds to the frequency distribution for the total number of contacts traced, and (c) corresponds to the frequency distribution for the time to control the outbreak, each as a function of the threshold (i.e., the number of cases required) for initiating contact tracing (one, two, or three cases). The frequency indicates the number of simulation replications that result in the corresponding (a) total number of confirmed cases, (b) total number of contacts traced, and (c) time to control the outbreak. It is assumed that three communicable disease nurses are available for four hours a day, seven days a week.
To determine the effect of resource capacity and the availability of the LHD on pertussis outbreak management, we varied the staffing levels of the LHD and examined three performance measures generated by 500 replications for each scenario. The nurse schedule in the base case assumes that each nurse is able to allocate four hours a day, seven days a week exclusively to contact tracing of pertussis. This assumption may be unrealistic because of recent budget cuts, understaffed LHDs, and CD nurses often juggling different responsibilities. Therefore, we tested nurse schedules of four hours, five days a week to one hour, one day a week with a threshold of 1–3 cases and 1–3 CD nurses. The Table presents the average and standard deviation for the number of confirmed cases when the resource capacity is varied (both with the number of CD nurses available and the nurse schedule) and the contact tracing threshold is varied.
Table.
The average number of confirmed pertussis cases and the corresponding standard deviation generated by the pertussis simulation model based on North Carolina case data from 2007–2008 as a function of the threshold for initiating contact tracing, the number of nurses, and the nurse schedule
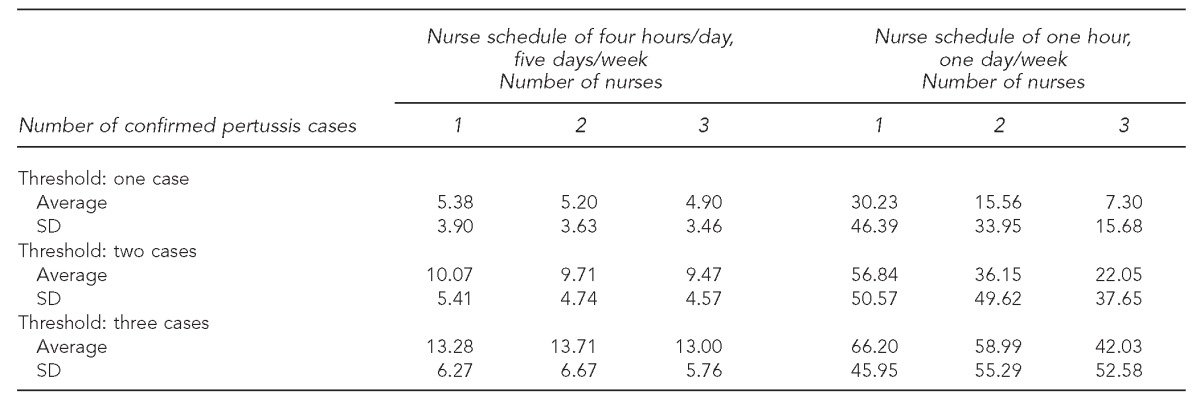
SD = standard deviation
Mass vaccination clinic/POD planning
The results from the models revealed that the registration process was consistently identified as a bottleneck, suggesting that some of the resources dedicated to vaccination might be more helpful earlier in the process. In general, clinics that provided facilities to their clients to fill out the registration forms in advance and/or clinics that used cross-trained staff with the flexibility to move from one station to the next, depending on the need, performed better.
DISCUSSION
Public health alerting and notification
Our findings suggest that understanding the cost associated with alerting as well as the cost of failing to alert is particularly important for public health preparedness at the local level. We have shown that optimal alerting thresholds can differ for the state and local levels and still be optimal. Implementing the same emergency management strategy for different levels of a public health system may not result in the most efficient response to an outbreak. Our results suggest that the optimal policies of the local and state levels are sensitive to the changes to cost values and -parameters that model the uncertainty in the system. Thus, it is important to estimate the parameters related to the dynamics of the system as accurately as possible to obtain thorough optimal policies at both levels.
Outbreak investigation contact tracing and control of disease spread
Our results suggest that resource availability as well as information delays at various stages of the process have a significant impact on the evolution of a disease outbreak. Additionally, our results suggest that the time to initiate the response and contact tracing as well as resource capacity significantly affect the duration of the outbreak. The confirmed case threshold for the initiation of contact tracing significantly changes the total number of confirmed cases as well as the number of contacts traced and the time to control outbreak. Further, there is a direct relationship between the public health resources available for contact tracing and the size of a pertussis outbreak.
It is possible to have too few resources, resulting in an outbreak that can never be contained. It is also possible to use the model to identify the minimum number of public health resource hours necessary to control an outbreak. While the effect of the resource level is not as large as the effect of the contact tracing threshold, we observed a drop in the number of confirmed cases when more CD nurses are available in the LHD. The effect of this reduction is more significant for the second schedule, where the nurse(s) only devotes one hour per week to contact tracing of pertussis. This finding suggests that the resource availability significantly increases the size of the outbreak if a small percentage of the nurse's time is assigned to contact tracing. It is likely that these results would translate to other disease outbreaks. Further, the model structure we have developed can be extended to other CDs. This model enables the estimation of the public health resources (in terms of time, which may be translated to cost) required to control a CD outbreak.
Mass vaccination/POD planning
The 3D DES models representing a diverse collection of mass vaccination clinic configurations have been created to inform the development, design, and configuration of future vaccination or mass care clinics. These models also create an opportunity to explore the impact of alternate staffing levels and clinic flow, for example, without having to conduct a full exercise to test a number of different scenarios. In fact, some health departments have used the models to inform their seasonal influenza clinics. In addition to providing insight regarding the performance of different clinic configurations with respect to metrics such as throughput and waiting time, the models created a computer animation that allowed LHDs to discuss their clinic configurations within and among other counties, and work together to discuss best practices and opportunities for maximizing efficiency and patient satisfaction. These animations may also be beneficial in pre-event and just-in-time training.
CONCLUSION
We found that the methods employed by the disciplines of operations research and ISE offer powerful new insights to understand and improve public health emergency preparedness and response systems. The models and tools developed can be used by public health practitioners not only to inform their planning decisions but also to provide a quantitative argument to support public health decision making and investment. While the methods and findings are promising, one limitation of this research was that the research was not translated into direct improvements to public health. Despite this limitation, systems engineering-based tools, specifically techniques that have the ability to model (i.e., mathematically represent) the system, simulate (i.e., run multiple what-if scenarios), and optimize (i.e., select the best course of action or system design for) complex systems, even under uncertainty, are necessary to address public health preparedness problems now and in the future. As cost pressures increase and demands on public health resources grow, it will be increasingly important to identify efficient and effective solutions for public health preparedness problems. The need to optimize, develop simulated models of potential realities, and perform what-if analyses will be necessary.
Footnotes
This research was conducted by the North Carolina Preparedness and Emergency Response Research Center (NCPERRC), which is part of the University of North Carolina (UNC) Center for Public Health Preparedness at the UNC at Chapel Hill Gillings School of Global Public Health, and was supported by the Centers for Disease Control and Prevention (CDC) grant #1PO1TP000296. The contents and views expressed in this article are solely the responsibility of the authors and do not necessarily represent the official views of CDC.
The authors thank the members of the Southern Piedmont Partnership for Public Health for their valuable input in this project; the six counties that allowed their clinics to be modeled; Dr. Edward Baker, NCPERRC Principal Investigator and Director of the North Carolina Institute for Public Health; Heather Gates, former member of the UNC Center for Public Health Preparedness; Carol Gunther-Mohr, NCPERRC Project Manager; Dr. Jean-Marie Maillard, Communicable Disease Branch Medical Unit Physician, North Carolina Division of Public Health; Dr. Reha Uzsoy, Clifton A. Anderson Distinguished Professor in the Edward P. Fitts Department of Industrial and Systems Engineering (ISE) at North Carolina State University (NCSU); and Mr. Travis Worth, a former graduate student in the Edward P. Fitts ISE Department at NCSU for their invaluable assistance.
REFERENCE
- 1.Bozzette SA, Boer R, Bhatnagar V, Brower JL, Keeler EB, Morton SC, et al. A model for a smallpox-vaccination policy. N Engl J Med. 2003;348:416–25. doi: 10.1056/NEJMsa025075. [DOI] [PubMed] [Google Scholar]
- 2.Brandeau ML, McCoy JH, Hupert N, Holty JE, Bravata DM. Recommendations for modeling disaster responses in public health and medicine: a position paper of the Society for Medical Decision Making. Med Decis Making. 2009;29:438–60. doi: 10.1177/0272989X09340346. [DOI] [PMC free article] [PubMed] [Google Scholar]
- 3.Wright PD, Liberatore MJ, Nydick RL. A survey of operations research models and applications in homeland security. Interfaces. 2006;36:514–29. [Google Scholar]
- 4.Altay N, Green WG., III OR/MS research in disaster operations management. Eur J Operational Res. 2006;175:475–93. [Google Scholar]
- 5.Stilianakis N, Consoli S. Luxembourg: Publications Office of the European Union; 2013. Operations research in disaster preparedness and response: the public health perspective. European Commission Joint, Research Centre, Institute for the Protection and Security of the Citizen. [Google Scholar]
- 6.Herrmann JW, editor. Handbook of operations research for homeland security. Springer: New York; 2013. [Google Scholar]
- 7.Benecke B, Pietz R, Callen K. Division of strategic national stockpile modeling program. 2007. [cited 2014 Jan 4]. Available from: URL: http://www.naccho.org/topics/emergency/SNS/upload/Microsoft-PowerPoint-SNS-Modeling-Break-Out-Portland.pdf.
- 8.Hauskrecht M, Fraser H. Planning treatment of ischemic heart disease with partially observable Markov decision processes. Artif Intell Med. 2000;18:221–44. doi: 10.1016/s0933-3657(99)00042-1. [DOI] [PubMed] [Google Scholar]
- 9.Hu C, Lovejoy WS, Shafer SL. Comparison of some suboptimal control policies in medical drug therapy. Operations Res. 1996;44:696–709. [Google Scholar]
- 10.Maillart LM, Ivy JS, Ransom S, Diehl K. Assessing dynamic breast cancer screening policies. Operations Res. 2008;56:1411–27. [Google Scholar]
- 11.Smallwood RD, Sondik EJ, Offensend FL. Toward an integrated methodology for the analysis of healthcare systems. Operations Res. 1971;19:1300–22. [Google Scholar]
- 12.Monahan GE. A survey of partially observable Markov decision processes: theory, models, and algorithms. Manag Sci. 1982;28:1–16. [Google Scholar]
- 13.Cassandra AR. A survey of POMDP applications. Proceedings of the 13th Annual Conference on Uncertainty in Artificial Intelligence (UAI-97); 1997 Aug 1–3; Providence, Rhode Island. [Google Scholar]
- 14.Yaylali E, Ivy JS. Partially observable MDPs (POMDPS): introduction and examples. In: Cochran JJ, Cox LA Jr, Keskinocak P, Kharoufeh JP, Smith JC, editors. New York: Wiley Encyclopedia of Operations Research and Management Science; 2011. pp. 1–20. [Google Scholar]
- 15.Centers for Disease Control and Prevention (US) FluView: 2009–2010 influenza season week 13 ending April 10, 2010 [cited 2010 Apr 20] Available from: URL: http://www.cdc.gov/flu/weekly.
- 16.North Carolina Department of Health and Human Services. Flu in NC: influenza virus isolates identified by the State Laboratory of Public Health during the 2009–2010 influenza season [cited 2010 Apr 20] Available from: URL: http://www.flu.nc.gov.
- 17.Yaylali E. Raleigh (NC): North Carolina State University; 2010. A two-agent stochastic alert threshold model for identifying a potential disease outbreak: a case study for H1N1. Master's thesis. [Google Scholar]
- 18.Yaylali E. Raleigh (NC): North Carolina State University; 2012. Stochastic multi-agent models for alerting decisions in public health. Doctoral dissertation. [Google Scholar]
- 19.Hethcote HW. An age-structured model for pertussis transmission. Math Biosci. 1997;145:89–136. doi: 10.1016/s0025-5564(97)00014-x. [DOI] [PubMed] [Google Scholar]
- 20.Grenfell BT, Anderson RM. Pertussis in England and Wales: an investigation of transmission dynamics and control by mass vaccination. Proc R Soc Lond Biol Sci. 1989;236:213–52. doi: 10.1098/rspb.1989.0022. [DOI] [PubMed] [Google Scholar]
- 21.Broutin H, Viboud C, Grenfell BT, Miller MA, Rohani P. Impact of vaccination and birth rate on the epidemiology of pertussis: a comparative study in 64 countries. Proc R Soc Lond Biol Sci. 2010;277:3239–45. doi: 10.1098/rspb.2010.0994. [DOI] [PMC free article] [PubMed] [Google Scholar]
- 22.Muller J, Kretzschmar M, Dietz K. Contact tracing in stochastic and deterministic epidemic models. Math Biosci. 2000;164:39–64. doi: 10.1016/s0025-5564(99)00061-9. [DOI] [PubMed] [Google Scholar]
- 23.Hyman JM, Li J, Stanley EA. Modeling the impact of random screening and contact tracing in reducing the spread of HIV. Math Biosci. 2003;181:17–54. doi: 10.1016/s0025-5564(02)00128-1. [DOI] [PubMed] [Google Scholar]
- 24.Armbruster B, Brandeau ML. Contact tracing to control infectious disease: when enough is enough. Health Care Manag Sci. 2007;10:341–55. doi: 10.1007/s10729-007-9027-6. [DOI] [PMC free article] [PubMed] [Google Scholar]
- 25.Armbruster B, Brandeau ML. Optimal mix of screening and contact tracing for endemic diseases. Math Biosci. 2007;209:386–402. doi: 10.1016/j.mbs.2007.02.007. [DOI] [PMC free article] [PubMed] [Google Scholar]
- 26.Eames KT, Keeling MJ. Contact tracing and disease control. Proc Biol Sci. 2003;270:2565–71. doi: 10.1098/rspb.2003.2554. [DOI] [PMC free article] [PubMed] [Google Scholar]
- 27.Worth T, Uzsoy R, Samoff E, Meyer AM, Maillard JM, Wendelboe AM. Modelling the response of a public health department to infectious disease. Proceedings of the 2010 Simulation Conference; 2010 Dec 5–8; Baltimore; Maryland. [Google Scholar]
- 28.Aaby K, Abbey RL, Herrmann JW, Treadwell M, Jordan CS, Wood K. Embracing computer modeling to address pandemic influenza in the 21st century. J Public Health Manag Pract. 2006;12:365–72. doi: 10.1097/00124784-200607000-00010. [DOI] [PubMed] [Google Scholar]
- 29.Aaby K, Herrmann JW, Jordan CS, Treadwell M, Wood K. Montgomery County's public health service uses operations research to plan emergency mass dispensing and vaccination clinics. Interfaces. 2006;36:569–79. [Google Scholar]
- 30.Hupert N, Mushlin AI, Callahan MA. Modeling the public health response to bioterrorism: using discrete event simulation to design antibiotic distribution centers. Med Decis Making. 2002;22(5 Suppl):S17–25. doi: 10.1177/027298902237709. [DOI] [PubMed] [Google Scholar]
- 31.Washington ML. Evaluating the capability and cost of a mass influenza and pneumococcal vaccination clinic via computer simulation. Med Decis Making. 2009;29:414–23. doi: 10.1177/0272989X09333126. [DOI] [PubMed] [Google Scholar]
- 32.Centers for Disease Control and Prevention (US) H1N1 flu: tools and models to estimate staffing [cited 2014 Jan 4] Available from: URL: http://www.cdc.gov/h1n1flu/vaccination/statelocal/tools.htm.
- 33.North Carolina Public Health Incubator Collaboratives. Southern Piedmont NC Partnership for Public Health [cited 2014 Jan 4] Available from: URL: http://nciph.sph.unc.edu/incubator/partnerships/southern_piedmont/index.htm.
- 34.Simio LLC. Sewickley (PA): Simio LLC; 2013. Simio® simulation software. [Google Scholar]