

Abstract
Purpose:
Depth encoding detectors are required to improve the spatial resolution and spatial resolution uniformity of small animal positron emission tomography (PET) scanners, as well as dedicated breast and brain scanners. Depth of interaction (DOI) can be measured by using dual-ended readout of lutetium oxyorthosilicate (LSO) scintillator arrays with position-sensitive avalanche photodiodes. Inter-crystal reflectors and crystal surface treatments play important roles in determining the performance of dual-ended detectors. In this paper, the authors evaluated five LSO arrays made with three different intercrystal reflectors and with either polished or unpolished crystal surfaces.
Methods:
The crystal size in all arrays was 1.5 mm, which is typical of the detector size used in small animal and dedicated breast scanners. The LSO arrays were measured with dual-ended readout and were compared in terms of flood histogram, energy resolution, and DOI resolution performance.
Results:
The four arrays using enhanced specular reflector (ESR) and Toray reflector provided similar quality flood histograms and the array using Crystal Wrap reflector gave the worst flood histogram. The two arrays using ESR reflector provided the best energy resolution and the array using Crystal Wrap reflector yielded the worst energy resolution. All arrays except the polished ESR array provided good DOI resolution ranging from 1.9 mm to 2.9 mm. DOI resolution improved as the gradient in light collection efficiency with depth (GLCED) increased. The geometric mean energies were also calculated for these dual-ended readout detectors as an alternative to the conventional summed total energy. It was shown that the geometric mean energy is advantageous in that it provides more uniform photopeak amplitude at different depths for arrays with high GLCED, and is beneficial in event selection by allowing a fixed energy window independent of depth. A new method of DOI calculation that improved the linearity of DOI ratio vs depth and simplifies the DOI calibration procedure also was developed and tested.
Conclusions:
The results of these studies provide useful guidance in selecting the proper reflectors and crystal surface treatments when LSO arrays are used for high-resolution PET applications in small animal scanners or dedicated breast and brain scanners.
Keywords: brain, calibration, photodiodes, position sensitive particle detectors, positron emission tomography
Keywords: reflector, crystal surface, positron emission tomography, small animal imaging, depth of interaction
I. INTRODUCTION
Positron emission tomography (PET) scanners typically use long and narrow crystals to achieve a reasonable balance between spatial resolution and sensitivity. However, the radial spatial resolution of a PET scanner degrades as the radial offset increases due to the depth of interaction (DOI) effect. The axial spatial resolution also degrades if events with large oblique angles are accepted. The error caused by the DOI effect increases as the crystal length increases and the scanner ring diameter decreases. DOI errors are a more significant concern for small-animal and dedicated breast and brain PET scanners that use smaller crystal elements and smaller ring diameters as compared to whole-body clinical PET scanners. Most commercial small-animal PET scanners use short crystals (typically ∼10 mm, while 20–30 mm long crystals are used for clinical PET scanners) to reduce DOI error at the cost of a reduction in the scanner sensitivity.1–3 Therefore, depth-encoding detectors are required to achieve good spatial resolution, good spatial resolution uniformity, and high sensitivity simultaneously for small-animal PET scanners as well as dedicated breast and brain scanners.
Many approaches have been proposed and studied in the past 25 years to measure DOI.4–12 Small-animal PET scanners,13 dedicated breast14 and brain scanners15 have also been developed using some form of depth-encoding detector. Dual-ended readout of a scintillation crystals or arrays is one popular depth-encoding method which measures DOI by using the energy ratio of the two photodetector signals and can achieve very good DOI resolution.16–20
For dual-ended readout depth-encoding detectors, the proper compromise needs to be found between flood histogram quality, DOI resolution, and energy resolution since a strong gradient in light collection efficiency with depth (GLCED) is required to obtain good DOI resolution, which implies a significant and depth-dependent loss of scintillation light and therefore a degradation in the quality of the flood histogram and energy resolution. The GLCED is mainly governed by crystal surface treatment, intercrystal reflector, and crystal size. In the past, several studies have examined the effects of crystal surface roughness on DOI resolution for dual-ended readout detectors.16,21,22 All these studies were conducted with single crystals and tried to increase the crystal surface roughness to obtain good DOI resolution. The effects of crystal surface on flood histogram quality and energy resolution were not studied with the exception of,22 where energy resolution was studied for a 3 × 2 × 100 mm3 crystal with different crystal surfaces.
In this paper, we report on the effect of surface treatment and reflectors for lutetium oxyorthosilicate (LSO) arrays with a crystal size of 1.5 mm, which is typical of the crystal size currently used in commercial small-animal PET scanners and also is that used or proposed in dedicated breast PET scanners.1,2,23 It also is an appropriate size for dedicated brain PET scanners. Five LSO arrays with identical dimensions, fabricated with either polished or unpolished crystal surfaces, and using different reflectors, were evaluated using dual-ended readout. The evaluation was based on flood histogram quality, energy resolution, and DOI resolution. The two polished arrays were also evaluated using traditional single-ended readout as a reference.
This paper provides valuable guidance in understanding performance trade-offs and in choosing scintillator surface treatment and reflectors for DOI-encoding dedicated PET scanners designed for small-animal imaging, nonhuman primate or human brain imaging, or breast imaging.
II. MATERIALS AND METHODS
II.A. LSO arrays
Five LSO arrays consisting of 5 × 5 crystals (1.5 × 1.5 × 20 mm3), using either polished or unpolished crystal surfaces and different intercrystal reflectors as shown in Table I were evaluated. All LSO was provided by Siemens Molecular Imaging (Knoxville, TN) and arrays were manufactured by Agile Technologies (Knoxville, TN). The procedure for making the LSO arrays has been described previously.18 The first reflector, widely used in PET detectors, is enhanced specular reflector (ESR) (3M, St. Paul, MN), which is a 65 μm thin multilayer polymer film reflector with a 98.5% reflectivity over the entire visible spectrum. The second reflector is Toray lumirror E60 film (Toray Industries Inc., Japan), which is a 50 μm thin white microvoided film with excellent opacity. The third reflector is the Tetratex ePTFE Crystal Wrap (Donaldson Company, Inc., PA), which is a 76 μm highly reflective teflon-based film. Detailed properties of the reflectors can be founded in Ref. 24. Polished crystal surfaces were obtained by mechanically polishing to an optical finish, unpolished crystal surfaces were left as saw-cut. The two different crystal surfaces were characterized with atomic force microscopy (Asylum Research, Santa Barbara CA). The maximum variations from peak to valley of the polished and unpolished crystal surfaces are about 0.1 μm and 4 μm, respectively.25
TABLE I.
Information about the seven detector modules studied.
| Detector number | Crystal surface | Reflector | Readout |
|---|---|---|---|
| 1 | Unpolished | ESR | Dual-ended |
| 2 | Unpolished | Toray | Dual-ended |
| 3 | Polished | ESR | Dual-ended |
| 4 | Polished | Toray | Dual-ended |
| 5 | Unpolished | Crystal Wrap | Dual-ended |
| 6 | Polished | ESR | Single-ended |
| 7 | Polished | Toray | Single-ended |
II.B. Detector measurements
The experimental setup for dual-ended readout detector measurements is shown in Fig. 1. All five arrays were read out using two 8 × 8 mm2 position-sensitive avalanche photodiodes (PSAPDs) coupled at each end. The PSAPDs were developed by Radiation Monitoring Devices Inc. (Watertown, MA).26,27 The dual-ended readout detector was placed in a light tight box. A thin polished LSO slab (20 × 20 × 0.6 mm3) was wrapped with teflon tape and coupled to a Hamamatsu R6231 single channel PMT with optical grease. The slab detector and a 0.3 mm 22Na point source were mounted on a translation table. Flood histogram and energy resolution were measured in singles mode with the sum of the common cathode signals of both PSAPDs as the data acquisition trigger. The entire array was irradiated by the 22Na point source located 5 cm to one side of the array. The DOI resolution was measured in coincidence mode with the coincidence signal of the slab detector and the summed PSAPD cathode signal as the data acquisition trigger. Five depths of 2, 6, 10, 14, and 18 mm were selectively irradiated. Both the distance from the point source to the collimating slab detector and the distance from the point source to the LSO array were 5 cm for the coincidence measurements, such that the width of the radiation beam width on the LSO array was ∼0.6 mm. All measurements were performed at room temperature. The eight position encoding signals (four from each PSAPD) were stored as list mode data. Details of the data acquisition can be found in Ref. 28. The two polished arrays were also measured in singles mode with a PSAPD coupled at one end and teflon tape reflector on the opposite end to compare their performance as the traditional PET detectors without depth-encoding. The distance from the point source to the arrays was also 5 cm.
FIG. 1.

Experimental setup for flood histogram, energy resolution, and DOI resolution measurements. Flood histograms and energy resolution were measured in singles mode without the collimating PMT detector.
II.C. Data analysis
To analyze the data for each dual-ended readout detector, first a preliminary flood histogram was obtained from the list mode data measured in singles mode by using a hardware-based lower energy threshold corresponding to 150 keV. The x and y coordinates of the flood histograms of the dual-ended readout detectors were calculated using the position-encoding energy signals of the two PSAPDs and the following equations:
| (1) |
where A1, B1, C1, and D1 are the four position-encoding energy signals from PSAPD 1 and A2, B2, C2, and D2 are the four position-encoding energy signals of PSAPD 2. The origin of the PSAPD coordinate system was defined as the A corner. The B and C corners of the PSAPDs were defined to be in the positive x-direction, and the C and D corners were defined to be in the positive y direction. E1 and E2 are the total energy measured by PSAPD 1 and PSAPD 2, respectively, and are calculated from the following equations:
| (2) |
For dual-ended readout, the total detected energy (E) was taken to be the sum of the energy measured by the two PSAPDs:
| (3) |
Second, from the preliminary flood histogram, a crystal look-up table (LUT) was generated. Then crystal energy spectra for individual crystals in an array were obtained from the singles measurement data using the crystal LUT. The photopeak amplitudes of individual crystals were obtained by Gaussian fitting of the photopeak of the energy spectra. Finally, a new flood histogram consisting only of events with an energy above 350 keV was obtained from the singles data for each array by using a crystal-based lower energy threshold of 350 keV.
To quantitatively compare the flood histograms obtained from different arrays, two parameters kmiddle and kedge were calculated based on the width of a “spot” in the flood histogram and the distance between spots. kmiddle is defined as the ratio of the average of the FWHM of the spots to the average separation between two adjacent spots for the nine middle spots (crystals) in the flood histogram. Kedge is same parameter calculated from the edge 16 spots in the flood histogram.
The energy resolution of the summed total energy and the resolution of the geometric mean energy were compared for the dual-ended readout detectors. The summed total energy method is the traditional method described previously, in which the total detector energy (E) is the sum of the energy measured by two the PSAPDs (E = E1 + E2). However, this parameter is only directly proportional to the actual deposited energy when the light collection at the two ends of the scintillator varies linearly with depth. In some arrays, this is clearly not the case, as a strong depth-dependence in the summed photopeak amplitude was observed. This is undesirable as the measured energy resolution values are degraded by depth effects and no longer reflect the actual energy resolution of the detector, and variations of photopeak position with depth make setting energy windows challenging. We therefore evaluated a second method, where the geometric mean energy of the dual-ended readout detector is calculated by
| (4) |
The underlying model here is that the signal collected drops off exponentially with interaction distance from the scintillator, rather than linearly. This is not unreasonable in scintillators with a high aspect ratio where the scintillation photons, on average, have to interact many times with the scintillator surface and reflectors prior to reaching the photodetector. This equation is still linear with energy, but gives a better approximation of the energy deposited in the scintillator for detectors where the light collection follows a roughly exponential drop with distance from the photodetector. This leads to a more uniform photopeak amplitude with depth and may enable a single energy window to be set for a crystal, independent of the depth at which an event occurred. The spectra of the total energy and the geometric mean energy of all individual crystals in an array were obtained from singles measurement data and the energy resolution for both methods was obtained by Gaussian fitting.
The DOI information obtained from the dual-ended readout detector was compared for two different DOI calculation methods using the following formulas:
| (5) |
| (6) |
Equation (5) is the traditional method of DOI ratio calculation for dual-ended readout detectors. This is well-suited when the ratio of the signals E1 and E2 change linearly with depth. However, in some detector configurations, as discussed for the total energy, the drop-off in signal with depth is closer to an exponential function. This leads us to propose Eq. (6) as a new method to improve the linearity of the DOI ratio with depth in such detectors. A linear relationship between the measured DOI metric and interaction depth greatly simplifies the calibration of interaction depth and is the motivation for exploring alternative formulations.
The histograms of DOI ratios at each of the five measurement depths were obtained for individual crystals from the coincidence measurement data by using the crystal LUT and a crystal-based lower energy threshold of 350 keV. Then FWHM DOI resolution was calculated by Gaussian fitting of the DOI histograms. The FWHM DOI resolution was then converted to mm by using a linear fit of the peak value of the DOI histograms of the crystal measured at 2 and 18 mm and the known depth of irradiation.
For the two single-ended readout detectors, the flood histogram was calculated using the four position-dependent energy signals of the PSAPD and energy calculated from the sum of the four signals. Flood histogram quality and energy resolution (energy equal to sum of the four PSAPD signals) were obtained by following the same data analysis procedure as for the dual-ended readout detectors.
III. RESULTS
III.A. Flood histograms
Figure 2 shows the flood histograms from all seven detector modules measured in singles mode. Table II provides the measured flood histogram quality parameters kmiddle and kedge. Smaller values correspond to better separation of the crystal elements. Figure 2 shows that all 25 crystals can be clearly resolved for all seven arrays. Detectors 1–4 provided similar flood histogram quality, while detector 5 was noticeably worse. Flood histograms for the single-ended readout detectors (6 and 7) were also similar in quality to the dual-ended readout of the identical arrays. The flood histograms of all detectors were better at the center than at the edges. This is mainly caused by the pincushion distortion of the PSAPD, which can be explained on the basis of charge-sharing effects and the four corner anode readout of the device.26 The flood histograms of arrays with ESR reflector, especially arrays 1 and 6, had reduced dynamic range compared to flood histograms of detectors using the other two reflectors. It is thought this is due to increased optical crosstalk in the ESR arrays, where light photons produced by an interaction in one crystal can arrive at the PSAPD through the neighboring crystals. This results in the centroid of the light distribution of the crystals moving toward the center of the array.
FIG. 2.

Flood histograms of the seven LSO arrays (Table I) measured in singles mode for events of E > 350 keV.
TABLE II.
Summary of flood histogram quality parameters, resolution of the summed total energy and the geometric mean energy, and DOI resolution (average and standard deviation calculated from individual measurements on all 25 crystals). GLCED is quantified as the DOI ratio change per cm. Higher values correspond to larger depth-dependence.
| Detector number (see Table I) | 1 | 2 | 3 | 4 | 5 | 6 | 7 |
|---|---|---|---|---|---|---|---|
| kmiddle | 0.11 | 0.10 | 0.11 | 0.11 | 0.18 | 0.12 | 0.12 |
| kedge | 0.17 | 0.15 | 0.15 | 0.15 | 0.24 | 0.17 | 0.16 |
| Energy resolution (E1 + E2) (%) | 19.4 ± 2.9 | 30.4 ± 7.0 | 16.5 ± 1.4 | 29.5 ± 5.7 | 54.6 ± 9.4 | 20.1 ± 4.4 | 38.8 ± 3.1 |
| Resolution of geometric mean energy | |||||||
| √(E1 × E2) (%) | 21.7 ± 3.5 | 22.0 ± 2.7 | 16.5 ± 1.4 | 20.7 ± 3.8 | 32.2 ± 2.6 | N/A | N/A |
| GLCED | 0.172 | 0.328 | 0.023 | 0.231 | 0.470 | N/A | N/A |
| DOI resolution (Method 1) (mm) | 2.9 ± 0.4 | 1.9 ± 0.1 | 16.4 ± 3.2 | 2.3 ± 0.1 | 1.9 ± 0.3 | N/A | N/A |
| DOI resolution (Method 2) (mm) | 3.0 ± 0.4 | 2.0 ± 0.1 | 15.5 ± 3.3 | 2.4 ± 0.1 | 2.2 ± 0.2 | N/A | N/A |
III.B. Energy resolution
Energy spectra of all 25 crystals from each detector were obtained from singles measurement data. Figures 3 and 4 show the spectra of the summed total energy and the geometric mean energy of a representative central crystal from each of the seven detectors obtained using the two energy calculation methods, respectively. Figure 5 shows the resolution of the summed total energy and the geometric mean energy of all 25 crystals for detector 2, comparing the results with the two different energy calculation methods. The average crystal energy resolutions obtained with the both methods and the standard deviations for all detectors are summarized in Table II. Detectors 1 and 3, which were made with ESR reflector, provided the best energy resolution. Detector 5, which was used the Crystal Wrap reflector, provided the worst energy resolution. Polished arrays provided better energy resolution than unpolished arrays for a given reflector. In general, the energy resolution decreased as the GLCED increased for the dual-ended readout detectors. The traditional single-ended readout detectors showed worse energy resolution than the dual-ended readout detectors using the same arrays. For the arrays using ESR reflector, the resolution of the summed total energy and the geometric mean energy was similar. For the other three arrays, the resolution of the geometric mean energy is significantly better. This is because this formulation reduces depth-dependent photopeak amplitude changes which are dominating the measured energy resolution when light loss along the length of the arrays is high. As shown in Fig. 5, the energy resolution of the edge crystals are worse than that of the middle crystal and the four corner crystals have the worst energy resolution if the traditional energy calculation method is used. The resolution of the geometric mean energy is both better, and more importantly, more uniform.
FIG. 3.
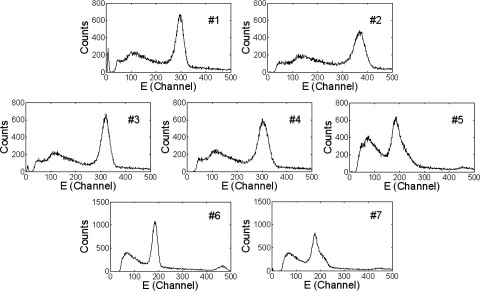
Energy spectra of a central crystal from each of the seven detectors. E = E1 + E2 is used for calculation of the total energy for the five dual-ended readout arrays. The measurements were performed in singles mode.
FIG. 4.
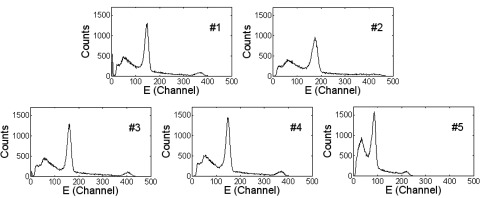
Spectra of the geometric mean energy of a central crystal for the five dual-ended detectors. The geometric mean energy is calculated by using E = √(E1 × E2).
FIG. 5.

Resolution of the summed total energy and the geometric mean energy of the 25 crystals in detector 2. The crystals are numbered consecutively from one corner by row. Crystals #1, 5, 21, and 25 correspond to the four corner crystals.
The linearity of the geometric mean energy was confirmed by checking the photopeak amplitudes of the 511 keV and 1274 keV γ rays from 22Na. The measured photopeak amplitude ratios of the two γ rays from the crystal energy spectra shown in Fig. 4 are 2.48, 2.50, 2.47, and 2.50 for arrays 1, 3, 4, and 5, respectively. This agrees well with the actual ratio of 2.49.
III.C. DOI ratio vs depth
Figures 6 and 7 show the histograms of the DOI ratio for one central crystal measured at depths of 2, 6, 10, 14, and 18 mm for the five dual-ended readout detectors obtained by using the two DOI ratio calculation methods [Eqs. (5) and (6)], respectively. The GLCED is quantified as the DOI ratio change per cm for the five dual-ended readout arrays, using the average DOI ratio obtained from all crystals measured at depths of 2 and 18 mm. The results are shown in Table II. Detector 3 had the smallest and detector 5 had the largest GLCED value. Figure 8 shows the DOI ratio vs depth curves for each of the five dual-ended readout detectors. The DOI ratio is a monotonic function of depth for both methods. The measured DOI ratio can then be converted to depth at which an event occurred through a calibration procedure. The relationship is more linear for arrays with large GLCED if Method 2 is used. Although it is not a requirement that the DOI ratio be linear with depth, DOI calibration is much simpler if a linear relationship can be assumed.29 For detectors with nonlinear DOI ratio vs depth response, a more complicated DOI calibration is required.30
FIG. 6.
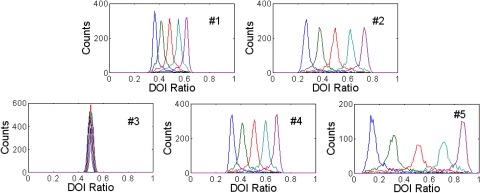
DOI responses of a central crystal for each of the five dual-ended readout detectors obtained using Eq. (5). The five curves in each figure correspond to depths of 2 (blue), 6, 10, 14, and 18 (magenta) mm from one end of the array.
FIG. 7.
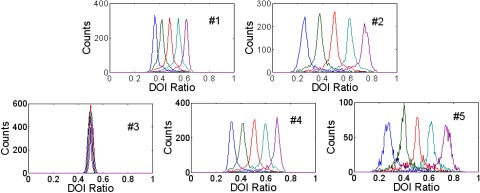
Same data as Fig. 6, but now calculating the DOI response using Eq. (6).
FIG. 8.
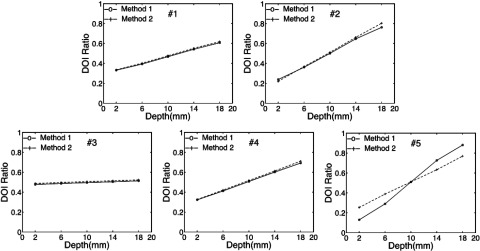
The relationship between mean DOI ratio and irradiation depth for one representative central crystal from each of the five dual-ended readout arrays.
III.D. DOI resolution
The DOI resolutions obtained with each of the two methods and averaged over the five depths and over all 25 crystals are shown in Table II. The standard deviations of the DOI resolution are also shown. The radiation beam width of ∼0.6 mm was not subtracted from the results. In general, DOI resolution was better for detectors with larger DOI ratio dynamic range that is a consequence of the higher GLCED. Array 3 provided the worst DOI resolution of 16.4 mm. All other arrays provided good DOI resolution ranging from 1.9 mm to 2.9 mm. Arrays 2 and 5 provided the best DOI resolution of 1.9 mm if Method 1 was used to compute the DOI ratio. Figure 9 shows the DOI resolution for all 25 crystals from detector 2 averaged over the five depths obtained with the two different DOI calculation methods. The DOI resolution is quite uniform across the array. The DOI resolution from the two DOI ratio calculation methods was also similar, although there was a trend toward slightly degraded DOI resolution with Method 2.
FIG. 9.

DOI resolution of the 25 crystals in detector 2 averaged over the five depths obtained with two different DOI calculation methods. The crystals are numbered consecutively from one corner by row. Crystals #1, 5, 21, and 25 correspond to the four corner crystals.
IV. DISCUSSION AND CONCLUSIONS
ESR is a specular reflector which has very high reflectivity. With this reflector, the GLCED is too small if the crystal surfaces are polished and the detector provides hardly any DOI information. GLCED increases if the crystal surface is unpolished. The detector DOI resolution then improves to 2.9 mm. Both polished and unpolished ESR arrays provide similar flood histogram quality; however, the polished array provides better energy resolution (16.5% vs19.4%). The crystal surface could be even rougher than the unpolished crystal surface shown in this paper to increase GLCED so as to further improve the DOI resolution, although that also would lead to some degradation of the flood histogram quality and energy resolution.
The Toray reflector cannot be characterized as either a pure specular or diffuse reflector. The detector using the Toray reflector with polished crystal surfaces has a larger GLCED as compared with the array using ESR and unpolished crystal surfaces. This array provides a DOI resolution of 2.3 mm. The array using unpolished crystal surfaces has even larger GLCED and provides an excellent DOI resolution of 1.9 mm. The flood histograms of the detectors based on the Toray reflector are similar to those based on ESR reflector, but the energy resolution is much worse if the traditional method is used to calculate the detector total energy (E = E1 + E2).
Crystal Wrap is a diffuse reflector. The array using Crystal Wrap reflector and unpolished crystal surface has the highest GLCED, and also provides excellent DOI resolution of 1.9 mm. However, the flood histogram quality and energy resolution are significantly worse. Also it is difficult to fabricate LSO arrays with Crystal Wrap since it is hard to glue the reflector to the LSO crystals. Therefore, Crystal Wrap is not considered a good reflector for these types of detectors.
In this paper, we introduced the geometric mean energy for detectors with dual-ended readout For arrays with small GLCED (e.g., the two arrays using ESR reflector), the new method does not change the measured energy resolution since E1 and E2 change almost linearly with depth and therefore E is almost invariant with depth (see Ref. 18). For arrays with high GLCED, the change of E1 and E2 with depth may be better described by an exponential expression:
| (7) |
where E0 is the signal that would be measured by each PSAPD in the absence of light loss with depth, λ is the photon attenuation coefficient along the length of the crystal, and z1 and z2 are the distances from the interaction point to PSAPD 1 and PSAPD 2, respectively. The geometric mean energy signal will be
| (8) |
Since z1+z2 equals to the length of crystal, if the light loss is characterized by an exponential, then the geometric mean energy will not change with depth. This is advantageous compared with the traditional summed total energy method for arrays with high GLCED values, because it leads to more uniform photopeak amplitudes and delivers the important practical benefit of allowing a fixed energy window for event selection, independent of interaction depth.
The nonlinear relation of DOI ratio vs depth when Eq. (5) is used to calculate DOI ratio (Fig. 8) implies that the photopeak amplitude is depth-dependent if the traditional total energy calculation method is used. The new DOI ratio calculation method improves the linearity of the DOI ratio vs depth relationship for arrays with high GLCED values and simplifies the DOI calibration procedure with little degradation in DOI resolution.
For the traditional single-ended readout PET detector, polished crystal surfaces usually are used to collect as much light as possible to obtain good flood histograms and energy resolution. In this paper, single-ended LSO arrays using ESR and Toray reflectors were tested. Both arrays provide similar flood histogram quality, but arrays using ESR reflector provided better energy resolution. Therefore, arrays with polished crystal surfaces and using ESR reflector are still the best choice for the traditional single-ended readout PET detectors. Interestingly, the dual-ended readout of the same arrays provided slightly better flood histogram quality and energy resolution, presumably because of better light collection when light is collected from both ends of the array.
In summary, in this paper we evaluated the performance of dual-ended read out of LSO arrays with identical crystal dimensions (1.5 × 1.5 × 20 mm3) using different reflectors and crystal surfaces. The results of this paper provide useful guidance for using these detectors in PET scanners for different applications. For example, energy resolution is a lower priority for small-animal PET scanner designs since the contribution of object scatter is small. Detectors with Toray reflector and unpolished crystal surfaces (detector #2) can be used to provide good flood histogram quality, good DOI resolution but result in relatively poor energy resolution. For dedicated breast and brain scanners, better energy resolution is required to reduce the fraction of scattered events accepted; detectors with ESR reflector and unpolished crystal surfaces (detector #1) can be used to provide good flood histogram quality and energy resolution while still achieving reasonable DOI resolution. The best array configuration for single-ended PET detectors of this size is an array using ESR reflector and with polished crystal surfaces.
ACKNOWLEDGMENTS
This work was funded by NIH Grant Nos. R01 EB006109 and R01 EB000993.
REFERENCES
- 1.Bao Q.et al. , “Performance evaluation of the Inveon dedicated PET preclinical tomograph based on the NEMA NU-4 standards,” J. Nucl. Med. 50(3), 401–408 (2009). 10.2967/jnumed.108.056374 [DOI] [PMC free article] [PubMed] [Google Scholar]
- 2.Tai Y. C.et al. , “Performance evaluation of the microPET focus: A third-generation microPET scanner dedicated to animal imaging,” J. Nucl. Med. 46(3), 455–463 (2005). [PubMed] [Google Scholar]
- 3.Goertzen A. L.et al. , “NEMA NU 4-2008 comparison of preclinical PET imaging systems,” J. Nucl. Med. 53(8), 1300–1309 (2012). 10.2967/jnumed.111.099382 [DOI] [PMC free article] [PubMed] [Google Scholar]
- 4.Moisan C.et al. , “Design studies of a depth encoding large-aperture PET camera,” IEEE Trans. Nucl. Sci. 42(4), 1041–1050 (1995). 10.1109/23.467751 [DOI] [Google Scholar]
- 5.Bartzakos P. and Thompson C. J., “A Pet detector with depth-of-interaction determination,” Phys. Med. Biol. 36(6), 735–748 (1991). 10.1088/0031-9155/36/6/003 [DOI] [Google Scholar]
- 6.MacDonald L. R. and Dahlbom M., “Depth of interaction for PET using segmented crystals,” IEEE Trans. Nucl. Sci. 45(4), 2144–2148 (1998) 10.1109/23.708325 [DOI] [Google Scholar]
- 7.Murayama H.et al. , “Depth encoding multicrystal detectors for PET,” IEEE Trans. Nucl. Sci. 45(3), 1152–1157 (1998). 10.1109/23.681994 [DOI] [Google Scholar]
- 8.Schmand M.et al. , “Performance results of a new DOI detector block for a high resolution PET-LSO research tomograph HRRT,” IEEE Trans. Nucl. Sci. 45(6), 3000–3006 (1998). 10.1109/23.737656 [DOI] [Google Scholar]
- 9.Yamamoto S. and Ishibashi H., “A GSO depth of interaction detector for PET,” IEEE Trans. Nucl. Sci. 45(3), 1078–1082 (1998). 10.1109/23.681982 [DOI] [Google Scholar]
- 10.Moses W. W. and Derenzo S. E., “Design studies for a PET detector module using a PIN photodiode to measure depth of interaction,” IEEE Trans. Nucl. Sci. 41, 1441–1445(1994). 10.1109/23.322929 [DOI] [Google Scholar]
- 11.Shao Y.et al. , “Design studies of a high resolution PET detector using APD arrays,” IEEE Trans. Nucl. Sci. 47(3), 1051–1057 (2000). 10.1109/23.856546 [DOI] [Google Scholar]
- 12.Levin C. S., “Design of a high-resolution and high-sensitivity scintillation crystal array for PET with nearly complete light collection,” IEEE Trans. Nucl. Sci. 49(5), 2236–2243 (2002). 10.1109/TNS.2002.803870 [DOI] [Google Scholar]
- 13.Wang Y. C.et al. , “Performance evaluation of the GE healthcare eXplore VISTA dual-ring small-animal PET scanner,” J. Nucl. Med. 47(11), 1891–1900 (2006). [PubMed] [Google Scholar]
- 14.Iima M.et al. , “Clinical performance of 2 dedicated PET scanners for breast imaging: Initial evaluation,” J. Nucl. Med. 53(10), 1534–1542 (2012). 10.2967/jnumed.111.100958 [DOI] [PubMed] [Google Scholar]
- 15.Eriksson L.et al. , “The ECAT HRRT: NEMA NEC evaluation of the HRRT system, the new high-resolution research tomograph,” IEEE Trans. Nucl. Sci. 49(5), 2085–2088 (2002). 10.1109/TNS.2002.803784 [DOI] [Google Scholar]
- 16.Burr K. C.et al. , “Evaluation of a prototype small animal PET detector with depth-of-interaction encoding,” IEEE Trans. Nucl. Sci. 51(4), 1791–1798 (2004). 10.1109/TNS.2004.832905 [DOI] [Google Scholar]
- 17.Dokhale P. A.et al. , “Performance measurements of a depth-encoding PET detector module based on position-sensitive avalanche photodiode read-out,” Phys. Med. Biol. 49(18), 4293–4304 (2004). 10.1088/0031-9155/49/18/007 [DOI] [PubMed] [Google Scholar]
- 18.Yang Y. F.et al. , “Depth of interaction resolution measurements for a high resolution PET detector using position sensitive avalanche photodiodes,” Phys. Med. Biol. 51(9), 2131–2142 (2006). 10.1088/0031-9155/51/9/001 [DOI] [PubMed] [Google Scholar]
- 19.Yang Y. F.et al. , “Tapered LSO arrays for small animal PET,” Phys. Med. Biol. 56(1), 139–153 (2011). 10.1088/0031-9155/56/1/009 [DOI] [PMC free article] [PubMed] [Google Scholar]
- 20.Salvador S., Wurtz J., and Brasse D., “Optimizing PET DOI resolution with crystal coating and length,” IEEE Trans. Nucl. Sci. 57(5), 2468–2474 (2010). 10.1109/TNS.2010.2060210 [DOI] [Google Scholar]
- 21.Shao Y.et al. , “Dual APD array readout of LSO crystals: Optimization of crystal surface treatment,” IEEE Trans. Nucl. Sci. 49(3), 649–654 (2002). 10.1109/TNS.2002.1039544 [DOI] [Google Scholar]
- 22.ur-Rehman F., Tai Y.-C., and Goertzen A. L., “Use of systematic surface roughing to enhance the spatial resolution of the dual-ended readout of axially-oriented 100 mm long LYSO crystals,” Phys. Med. Biol. 57(24), N501–N512 (2012). 10.1088/0031-9155/57/24/N501 [DOI] [PubMed] [Google Scholar]
- 23.Godinez F.et al. , “Characterization of a high-resolution hybrid DOI detector for a dedicated breast PET/CT scanner,” Phys. Med. Biol. 57(11), 3435–3449 (2012). 10.1088/0031-9155/57/11/3435 [DOI] [PMC free article] [PubMed] [Google Scholar]
- 24.Janecek M. and Moses W. W., “Optical reflectance measurements for commonly used reflectors,” IEEE Trans. Nucl. Sci. 55(4), 2432–2437 (2008). 10.1109/TNS.2008.2001408 [DOI] [Google Scholar]
- 25.Roncali E. and Cherry S. R., “Simulation of light transport in scintillators based on 3D characterization of crystal surfaces,” Phys. Med. Biol. 58(7), 2185–2198 (2013). 10.1088/0031-9155/58/7/2185 [DOI] [PMC free article] [PubMed] [Google Scholar]
- 26.Shah K. S.et al. , “Position-sensitive avalanche photodiodes for gamma-ray imaging,” IEEE Trans. Nucl. Sci. 49(4), 1687–1692 (2002). 10.1109/TNS.2002.801510 [DOI] [Google Scholar]
- 27.Shah K. S.et al. , “Position sensitive APDs for small animal PET imaging,” IEEE Trans. Nucl. Sci. 51(1), 91–95 (2004). 10.1109/TNS.2003.823012 [DOI] [Google Scholar]
- 28.Judenhofer M. S., Pichler B. J., and Cherry S. R., “Evaluation of high performance data acquisition boards for simultaneous sampling of fast signals from PET detectors,” Phys. Med. Biol. 50, 29–44 (2005). 10.1088/0031-9155/50/1/003 [DOI] [PubMed] [Google Scholar]
- 29.Yang Y. F.et al. , “Depth of interaction calibration for PET detectors with dual-ended readout by PSAPDs,” Phys. Med. Biol. 54(2), 433–445 (2009) 10.1088/0031-9155/54/2/017 [DOI] [PMC free article] [PubMed] [Google Scholar]
- 30.Shao Y. P., Yao R. T., and Ma T. Y., “A novel method to calibrate DOI function of a PET detector with a dual-ended-scintillator readout,” Med. Phys. 35(12), 5829–5840 (2008). 10.1118/1.3021118 [DOI] [PubMed] [Google Scholar]