Abstract
Neuro-EIGIs require visualization of very small endovascular devices and small vessels. A Microangiographic Fluoroscope (MAF) x-ray detector was developed to improve on the standard flat panel detector’s (FPD’s) ability to visualize small objects during neuro-EIGIs. To compare the performance of FPD and MAF imaging systems, specific imaging tasks related to those encountered during neuro-EIGIs were used to assess contrast to noise ratio (CNR) of different objects. A bar phantom and a stent were placed at a fixed distance from the x-ray focal spot to mimic a clinical imaging geometry and both objects were imaged by each detector system. Imaging was done without anti-scatter grids and using the same conditions for each system including: the same x-ray beam quality, collimator position, source to imager distance (SID), and source to object distance (SOD). For each object, relative contrasts were found for both imaging systems using the peak and trough signals. The relative noise was found using mean background signal and background noise for varying detector exposures. Next, the CNRs were found for these values for each object imaged and for each imaging system used. A relative CNR metric is defined and used to compare detector imaging performance. The MAF utilizes a temporal filter to reduce the overall image noise. The effects of using this filter with the MAF while imaging the clinical object’s CNRs are reported. The relative CNR for the detectors demonstrated that the MAF has superior CNRs for most objects and exposures investigated for this specific imaging task.
Keywords: MAF, ROI, CNR, image metrics, fluoroscopy, angiography, x-ray imaging, neurovascular interventions
DESCRIPTION OF PURPOSE
Neuro-EIGIs are minimally invasive surgeries which use endovascular devices, guided by x-ray images, to treat vascular defects. The current standard imager used for x-ray detection in such procedures is the large field-of-view, low-resolution, flat-panel detector (FPD). In this experiment, measurements are done using an angiographic system identical to those used for neuro-EIGIs. The FPD in this system has a full field of view of 12 inches, a pixel size of 194 μm, and a corresponding Nyquist frequency of 2.58 lp/mm. It has been shown that a small field-of-view, high-resolution detector would make better use of the x-ray exposure required to guide the procedure and lead to better object visualization, device placement, and clinical outcome[1,2].
The investigators at the Toshiba Stroke and Vascular Research Center have engineered and built a high resolution, small field-of-view detector called the Microangiographic Fluoroscope (MAF). The detector has exhibited success in clinical human tests[2–4]. Additionally, the MAF has been extensively tested and evaluated and has consistently shown improvement over flat panel detectors using a variety of detector metrics[5]. However, despite the quantitative nature of these metrics, the actual ability of the detector system to identify objects is dependent on the specific imaging task. This ultimately makes it difficult to predict specific detector system performance, to compare the performance of different detectors systems, and to determine which detector system would be best for a specific application.
The purpose of this study is to define and carry out specific imaging tasks to elucidate which detector system is most advantageous to utilize during portions of neuro-EIGIs. Because of the difficulties of predicting detector performance for a given imaging task from the previously measured detector metrics, a specific imaging task was used to find CNR for the MAF and FPD. From these CNRs, a new metric, the relative CNR, is defined to compare the imaging capabilities both detectors. These measurements will allow for conclusions to be drawn as to which detector system is best utilized during certain portions of the neuro-EIGI.
METHODS AND MATERIALS
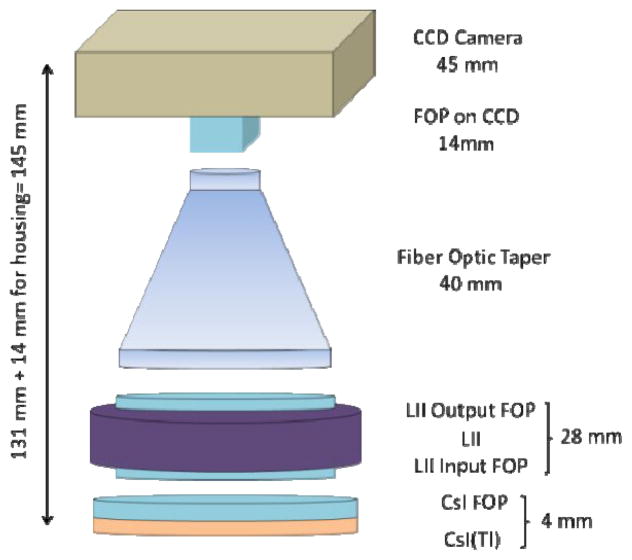
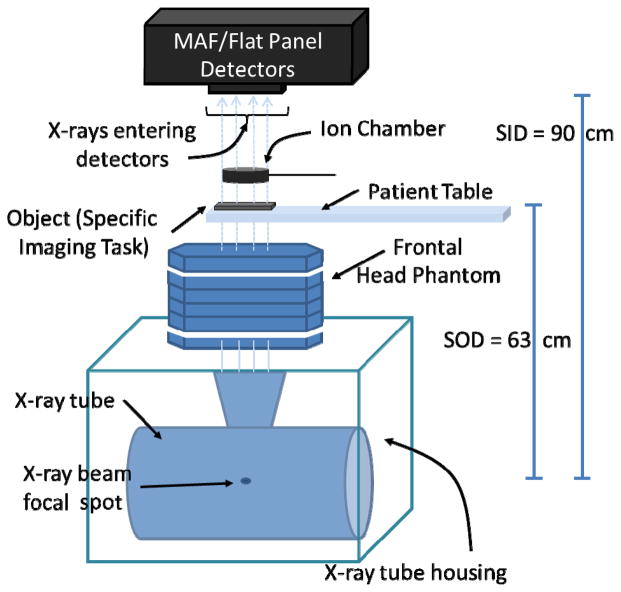
The MAF system is used during neuro-EIGIs in conjunction with the FPD system (Figure 1 and 2) while both share a common x-ray output source. The MAF detector is built on a CCD camera and has an effective pixel size of 35 μm which corresponds to a Nyquist frequency of greater than 14 lp/mm. The MAF has a circular field of view with a diameter of 3.6 cm. The detector also has a light image intensifier (LII) to amplify the signal of light from the phosphor and to increase the dynamic range of the MAF. As a result, the MAF is able to operate at both fluoroscopic and angiographic modes[6]. For this experiment, the MAF is fitted with a 500 μm thick, high resolution (HR) CsI(Tl) scintillator. A schematic of the experimental setup is shown below (Figure 3).
Figure 1.

The optical components of the flat panel detector (FPD) in the Toshiba Infinix system.
Figure 2.
The optical components of the MAF detector.
Figure 3.
A schematic of the experimental setup to find the relative CNRs of the MAF and FPD.
1. Specific task object selection
A bar phantom with a thickness of 0.01 mm of lead is used to mimic the contrast and size of objects such as stents and coils commonly used in neuro-EIGIs (Figure 4). The bar phantom is placed at a small angle of 2.6 degrees relative to the pixel rows of the MAF and FPD. It is then imaged by both detectors using the same beam quality and imaging geometry. The resultant images have a geometric object magnification factor of 1.43 times, similar to that of a clinical neuro-EIGI. This magnification affects image resolution since it increases the focal spot unsharpness and increases the effective Nyquist frequency of the detectors in the object plane. This is important regarding the FPD because this magnification projects the detector’s Nyquist frequency of 2.58 lp/mm into the object plane resulting in a magnified Nyquist limit of 3.71 lp/mm. By comparison, the MAF detector has a Nyquist frequency of over 14 lp/mm, which increases to greater than 20 lp/mm in the object plane due to the magnification. The line pair bar phantom has a maximum frequency of 5 lp/mm so images taken by the FPD of the line pairs above 3.7 lp/mm will be aliased. Additionally, in both setups, the x-ray beam is collimated to the edges of the bar phantom to reduce x-ray scatter to the detectors from the head phantom used with the bar phantom. The collimators remain fixed for both MAF and FPD image acquisitions.
Figure 4.
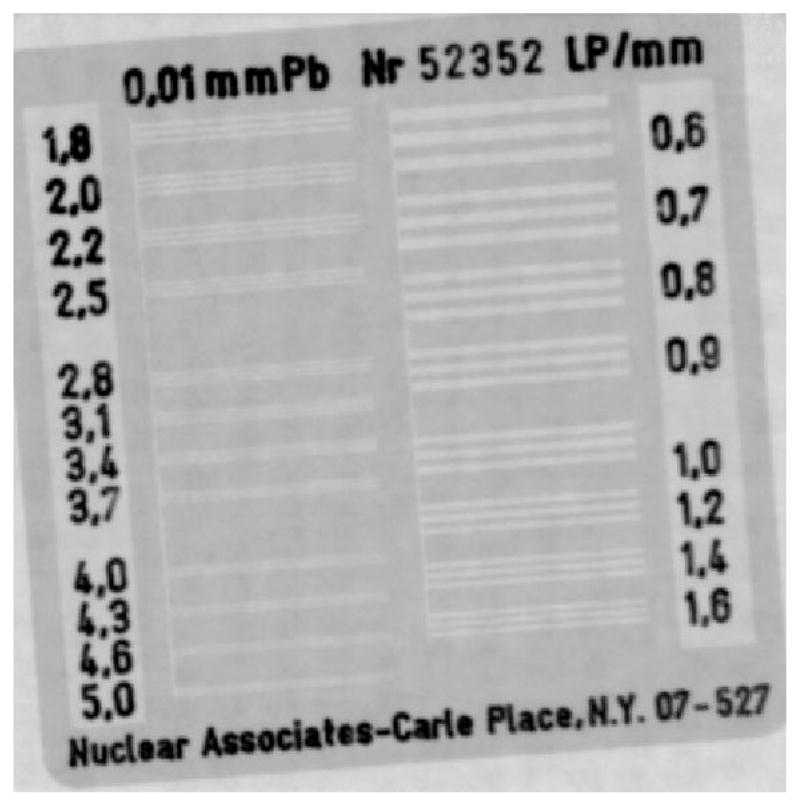
Radiographic image of the Nuclear Associates low contrast bar phantom taken using the standard FPD on the Toshiba Infinix system.
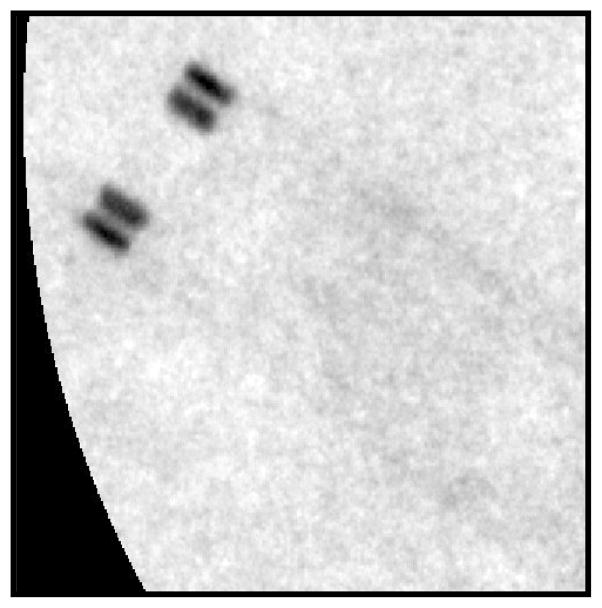
In addition, a neurological stent (Figure 5) was also imaged with the head phantom in place so that the relative contrasts acquired by each detector can be compared using a specific clinical object. The neurological stent imaged is a Boston Scientific Wingspan Stent which is used in neuro-EIGIs.
Figure 5.
Radiographic image of the neurological stent (Boston Scientific Wingspan Stent) taken using the MAF on the Toshiba Infinix system.
2. X-ray imaging parameters and selection of tube potential
In most neuro-EIGI cases the MAF detector has been operated in what has been previously called HD fluoroscopic mode[7] and this mode is used in this experiment. HD fluoroscopic mode maximizes the x-ray tube output of the Toshiba system by using the least attenuating beam filter of 1.8 mm of aluminum and by increasing the tube mAs to beyond typical fluoroscopic outputs and into digital angiographic levels. The increased output, as compared to typical fluoroscopic output, is necessary to reduce the per pixel quantum noise of the MAF. HD fluoroscopic mode also uses the systems smallest focal spot with a size of 0.3 mm to decrease the geometric unsharpness and preserve the high-resolution capabilities of the MAF detector. Despite the increase in x-ray output, the integral dose to the patient is not expected to increase because of the small field-of-view of the MAF[8].
After selection of HD fluoroscopic mode, x-ray technique parameters were selected to mimic those encountered during initial clinical testing of the MAF. Clinical tests have used the full range of HD fluoroscopic mode exposures allowed by the Toshiba system. Therefore, three outputs are tested: 0.6 mAs, 0.96 mAs, and 1.44 mAs, respectively representing low, mid-range, and high x-ray output values. Previous clinical tests also primarily used 80 kVp as the tube potential [2]. 88 kVp tube potential is also tested here and is selected to provide a sense of the cost-benefit decisions that must be determined before imaging is performed on patients. While the use of an 88 kVp x-ray beam increases the total beam output, the higher effective beam energy reduces the amount of photons absorbed by the imaged object. With both tube potentials used, the difference in the resultant CNR is quantifiable and useful for future clinical tests the MAF.
3. Mimicking Patient Attenuation and Phantom Selection
To properly test each detector in a situation similar to that of neuro-EIGIs, the beam quality and x-ray fluence expected during clinical neuro-EIGIs must be replicated. In order to simulate the attenuation of x-rays by a patient in neuro-EIGIs, a custom phantom is used with the test objects to mimic the attenuation of x-rays by a human head. While the ANSI/AAPM head phantom has been recommended for lateral projections [2.5 cm acrylic + 2 mm Al + 10 cm acrylic + 1 mm Al + 2.5 cm of acrylic (Figure 6)][9], it has been reported that this phantom is not suitable for measurements involving frontal skull imaging as used in most neuro-EIGI procedures[10]. For this experiment, a head phantom is used that consists of 2.5 cm acrylic + 7 mm Al + 10 cm acrylic + 6 mm Al + 2.5 cm of acrylic and was constructed using NEMA phantom blocks (Figure 7). This more closely approximates the head attenuation experienced during anterior-posterior imaging in neuro-EIGI clinical MAF tests[10]. With this phantom attenuating the x-ray beam, exposures to the object and detectors are expected to closely represent the actual x-ray beams experienced in frontal neuro-EIGIs in this task dependent metric.
Figure 6.
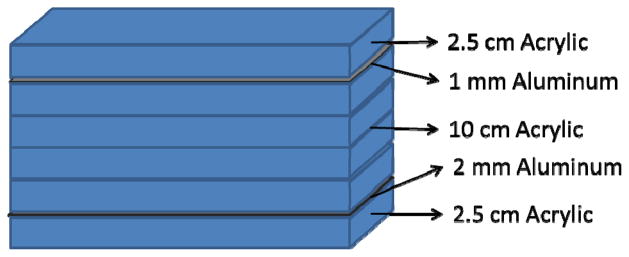
A schematic for the AAPM/ANSI recommended head phantom.
Figure 7.
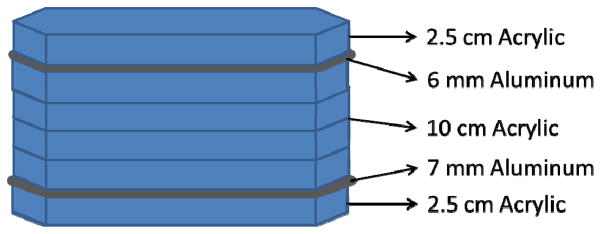
A schematic for the modified frontal head phantom.
4. Geometry of Imaging Setup
X-ray beams of voltage potentials 80 and 88 kVp are attenuated using the modified frontal head phantom to produce an x-ray beam simulating the quality encountered in typical frontal neuro-EIGIs. Images of the bar phantom and of the neurological nitinol stent are then taken using both the MAF and FPD detectors and for each of the different x-ray exposures and voltage potentials. These objects are placed on the patient table after the modified frontal head phantom. The bar phantom is positioned at a 2.6 degree angle relative to the MAF and FPD detector pixel rows. The images were acquired using HD fluoroscopic imaging characteristics by selecting a beam filter of 1.8 mm of aluminum and using the 0.3 mm small x-ray focal spot. Additionally, no anti-scatter grids were used but the beam was collimated to the object. Finally, the imaging geometry for each detector remained static with the x-ray source-to-object distance (SOD) equaling 63 cm and the source-to-imager distance (SID) positioned at 90 cm, resulting in an air gap of 27 cm between the imaged object and the detector. This setup results in a magnification factor of 1.43 which is a conservative estimate of typical magnification factors experienced in neuro-EIGIs.
5. Measurement of Relative Contrast, Relative Noise, and CNR and the determination of relative CNR metric
For contrast measurements, images of the bar phantom and stents, taken by both the FPD and MAF, are averaged over the course of their entire run of 48 frames to minimize quantum noise. They are dark and flat field corrected in order to minimize structural noise in the image. The contrast is measured for the high and low digital number outputs for each line pair. Because the relative contrast between the high and low outputs of each line pair should be exposure independent, digital number measurements were made using the highest x-ray mAs available for each voltage potential. Using two separate contrast measurement regions, one selected within the bright region and one selected within dark region of the line pair, the average digital numbers for each region are calculated to yield the signal output at the bright (Speak) and dark (Strough) region of each the line pair in the bar phantom.
Because of geometric unsharpness and pixel partial volume effects, accurate and consistent selection of the bright and dark contrast measurement regions of the each line pair is crucial for making accurate average signal measurements. The length of these regions are selected to be well within the length of each line pair, 102 pixels for images taken with the FPD and 565 pixels for images taken with the MAF. The following equation was used to define the width of the region in pixels over which the bright and dark signal values are averaged for each line pair group:
| Eq. 1 |
Using this value for the corresponding line pair frequency (L), the correct width of the region of interest can be accurately and consistently selected. For calculated widths that result in a whole number and some pixel fractional remainder, the remainder is dropped and only the whole number used to define the width of the contrast measurement region.
Once the correct areas for the contrast measurement regions are determined and properly positioned in the center of the bright and dark regions of each line pair, the digital numbers are averaged in the bright and dark portions of the line pair. The bar phantom has multiple line pairs for each pair frequency. For consistency, the middle bright region (Figure 8a) and its immediately adjacent dark region (Figure 8b) below this bright region are used for determination of the average digital number.
Figure 8.
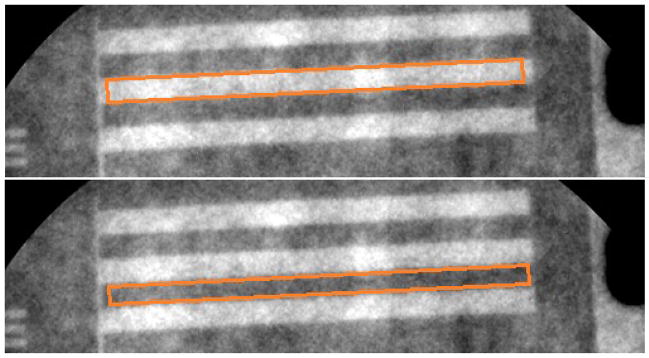
(a) For this image taken with the MAF, the orange box approximates the region where the average peak signal is measured; (b) for this image taken with the MAF, the orange box approximates the region where the average trough signal is measured.
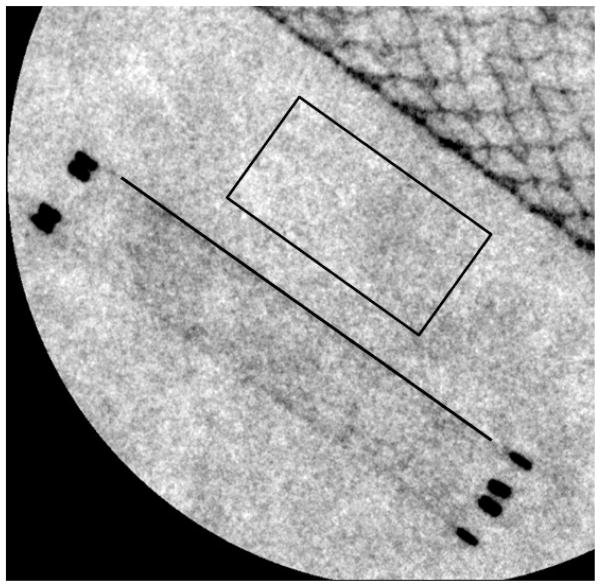
For the neurological stent, the stent struts are used to measure the overall dark signal (Strough). As shown in Figure 9, only the outermost portions of the neurological stent struts are used to calculate Strough. Once the images of the stent are averaged and dark and flat field corrected, the user draws a straight line over the outer struts of the neurological stent edge. Again, the length of this line must correspond to the same length in object space for both detectors so the length of the line is 120 pixels in the FPD images and 664 pixels in the MAF images. The digital numbers of the pixels intercepting this line are averaged to obtain Strough. The overall bright signal is then taken from the background using an area of 1775 square pixels for the FPD images and 54,500 square pixels for the MAF images. The digital numbers within these areas are averaged to obtain Speak.
Figure 9.
The image to the left is taken with the MAF. From this image, Speak, Strough, Sbkg, and image noise are calculated. The black line at the edge of the neurological stent is an approximation of the region of pixels used for the average Strough of the neurological stent. The black box in the center of the image is an approximation of the region used for calculation of the average Speak and the image noise.
Finally, the values measured from the bar phantom are used to calculate the overall signal difference in digital numbers for each line pair at each spatial frequency. The relative contrast is then determined by dividing this value by the trough signal (Strough) as in the following equation:
| Eq. 2 |
Next, an averaged image of five frames with no temporal filtering is used to determine the mean background signal (Sbkg) and background signal standard deviation (σbkg) for each tube output and voltage potential investigated. Because the standard deviations of the pixel values in the images are dependent on the area of the region of interest used to calculate the standard deviation, the number of pixels used for the measurement corresponds to equal areas in the object plane of the images taken by the FPD and MAF. Therefore, the number of pixels in the region used for the calculation of the mean signal and standard deviation in the image acquired by the MAF is 30.7 times the number of pixels used in the FPD acquired image (the ratio of the FPD pixel size to the MAF pixel size squared). The relative height and width of the region also stayed proportional between the FPD and MAF acquired images. Finally, the area in pixels where the mean background signal and standard deviation was measured differs between the images of the bar phantom and the images of the stents. For the images of the neurological stent, the background signal and standard deviation were measured using a region of the image with just the background signal (the black box region in Fig. 9). For the images of the bar phantom, the background signal and standard deviation were measured using a dark region of the image in between the line pairs (Figure 10).
Figure 10.

The orange box in the figure approximates the region where the noise of the background signal is measured for use in the CNR.
Once the background means and standard deviation is obtained, the relative noise is then defined by dividing the background deviation by the mean background signal:
| Eq. 3 |
With both the relative contrast and noise determined, the CNR is found using the following equation:
| Eq. 4 |
These values are measured for each line pair frequency present on the bar phantom and for both the FPD and MAF detectors. Using the CNRs calculated with the MAF images and the CNRs calculated using the FPD images, a metric is created to compare CNRs for a certain line pair frequency between each detector by using the ratio of the MAF CNR and the FPD CNR. The calculation of the metric is shown:
| Eq. 5 |
Finally, the MAF system is equipped with a software implemented recursive temporal filter which reduces the image noise at the cost of reduced temporal resolution [11]. Typically, the temporal filter weight ranges from ω =3 to ω = 5, corresponding to a reduction in image noise of 0.33 to 0.45 times the non-temporally filtered background noise[12]. Therefore, the CNR for a temporally filtered image taken with the MAF will increase 2.24 to 3 times depending on the temporal filter weight used in the image acquisition[13]. However, this temporal filter feature is disabled for images used for contrast and noise measurements.
RESULTS
As described in the methods, the contrast measurement region size changes based on the line pair frequency of the bar phantom. Table 1 shows the relative size of this region in pixels for both the MAF and FPD detectors. The resulting width in pixels was the width of the contrast measurement region in pixels used to acquire the average pixel digital number for calculation of the relative contrast. Because the length of every line pair in the phantom is the same, the length of the contrast measurement region does not change from line pair to line pair. This length was 120 pixels for the images taken with the FPD and 664 pixels for images taken with the MAF.
Table 1.
The above chart shows the calculated size of the width of the regions used for calculation of the average peak and trough values. These widths are dependent on the line pair values and therefore frequency.
| Line Pair Frequencies in Bar Phantom (lp/mm) | FPD ROI Width (Pix) | MAF ROI Width (Pix) | FPD Rounded Width (Pix) | MAF Rounded Width (Pix) |
|---|---|---|---|---|
| 0.6 | 6.14 | 34.01 | 6 | 34 |
| 0.7 | 5.26 | 29.15 | 5 | 29 |
| 0.8 | 4.60 | 25.51 | 4 | 25 |
| 0.9 | 4.09 | 22.68 | 4 | 22 |
| 1 | 3.68 | 20.41 | 3 | 20 |
| 1.2 | 3.07 | 17.01 | 3 | 17 |
| 1.4 | 2.63 | 14.58 | 2 | 14 |
| 1.6 | 2.30 | 12.76 | 2 | 12 |
| 1.8 | 2.05 | 11.34 | 2 | 11 |
| 2 | 1.84 | 10.20 | 1 | 10 |
| 2.2 | 1.67 | 9.28 | 1 | 9 |
| 2.5 | 1.47 | 8.16 | 1 | 8 |
| 2.8 | 1.31 | 7.29 | 1 | 7 |
| 3.1 | 1.19 | 6.58 | 1 | 6 |
| 3.4 | 1.08 | 6.00 | 1 | 6 |
| 3.7 | 1.00 | 5.52 | 1 | 5 |
| 4 | 0.92 | 5.10 | N/A | 5 |
| 4.3 | 0.86 | 4.75 | N/A | 4 |
| 4.6 | 0.80 | 4.44 | N/A | 4 |
| 5 | 0.74 | 4.08 | N/A | 4 |
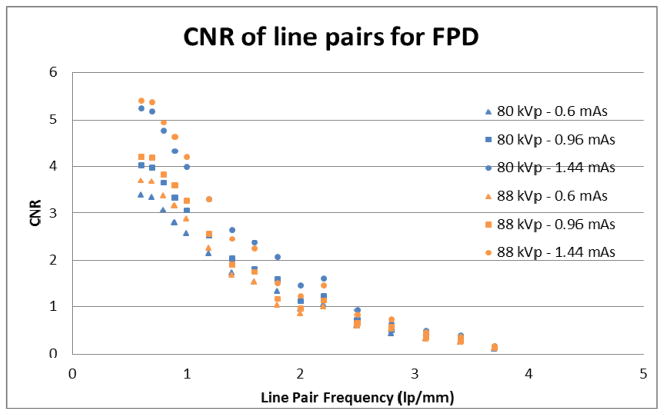
With the contrast measurement regions calculated and selected, the measured contrast to noise ratios for the line pairs imaged with the MAF and FPD are found and reported in Figures 11 and 12, respectively. Each line pair in the bar phantom has a different measured CNR depending on the line pair’s spatial frequency. The measured CNR of each line pair in the bar phantom is reported. It is important to note that because object plane Nyquist frequency is 3.71 lp/mm for the FPD, the line pairs with frequencies above this value were unable to be reliably measured. Aliasing occurs above this frequency and a contrast measurement region of less than one pixel width would need to be selected. Any line pairs in the bar phantom above the Nyquist frequency are therefore omitted from the figures and calculations. It should be noted however that in interventions, these objects may still be observable despite the aliasing.
Figure 11.
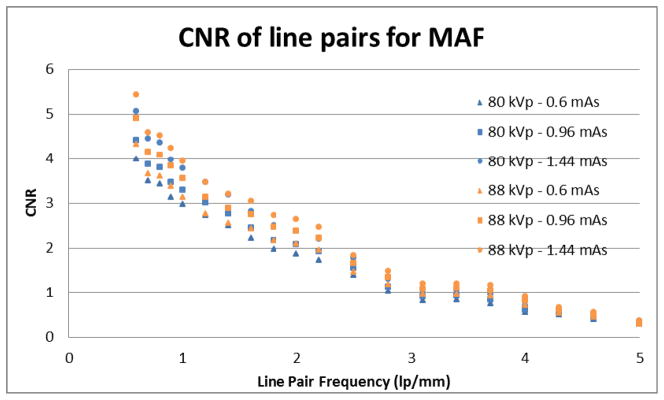
The graph shows the CNR of each line pair of the low-contrast bar phantom imaged by the MAF.
Figure 12.
The graph shows the CNR of each line pair of the low-contrast bar phantom imaged by the FPD.
Two different tube potentials are used and three different detector exposures for each tube potential are reported. Line pairs of low spatial frequency should have higher CNRs and line pairs of higher spatial frequency should have lower CNRs. Additionally, higher x-ray outputs should reduce the relative noise of the image, thus improving CNR for all line pair spatial frequencies.
The measured contrast to noise ratio for the MAF is reported in Figure 11. The measured contrast to noise for the FPD is reported in Figure 12. Again, each line pair in the bar phantom has a unique measured CNR which depends on the line pair’s spatial frequency. Also, the measured CNR for the three exposures at the tube potential of 80 kVp are shown as blue colored data point for each detector’s graph. The measured CNR for the three exposures at the 88 kVp tube potential is shown as the orange colored data points in each detector’s graph. The graphs also agree with the hypothesis that the low spatial frequency line pairs will show better CNRs and that the higher spatial frequency line pairs will show lower CNRs. Also CNRs increase as the x-ray tube output and exposure to the detector increases.
Using the line pair frequency dependent CNRs measured for the MAF and FPD, Figure 13 shows the ratio of the MAF CNRs to the FPD CNRs for each line pair spatial frequency not including the spatial frequencies that are greater than the FPD Nyquist frequency. Any relative CNR above one means the MAF has the better CNR for that particular line pair frequency and that the visualization of a similar neuro-EIGI object will be superior using the MAF. Any relative CNR below one means the FPD has an advantage at visualizing similar objects.
Figure 13.
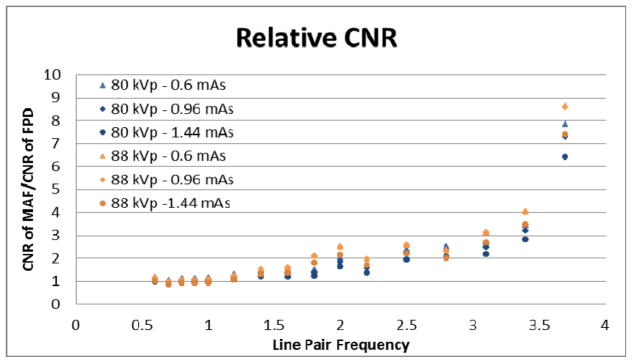
The graph shows the relative CNR of each line pair of the bar phantom.
Furthermore, in order to suppress the higher relative noise due to the smaller pixels in comparison with the FPD, the MAF has a temporal filter which is designed to reduce the image noise by decreasing the temporal resolution. Table 2 shows the factor by which the ‘per frame’ image noise is expected to be reduced for a given temporal filter weight (ω) selection. Typical ω values selected during use of the MAF range from 3 to 5. These factors result in a reduction of overall noise in the image of 2.24 to 3.00. However, if the lag introduced by the temporal filter is not prohibitive, the temporal resolution factor can be increased to a maximum of 10 which results in a reduction of overall image noise of 4.36 times. This feature is not used with the FPD and the resulting drop in the overall noise of the MAF images results in a significant increase in the relative CNR metric. This increase in the CNR metric is independent of the spatial frequency of the object and would therefore increase the relative CNR metric at all measured spatial frequencies.
Table 2.
The chart above shows the reduction in overall noise due to the MAF temporal filter feature. The noise reduction is function of the user selected ω factor. The range of possible ω factors is from 1 (no lag) to 10 (maximum lag). The lag should not introduce excessive blur due to motion during neuro-EIGI procedures.
| Temporal filter factor (ω) | Reduction in Overall Noise |
|---|---|
| 1 | 1.00 |
| 2 | 1.73 |
| 3 | 2.24 |
| 4 | 2.65 |
| 5 | 3.00 |
| 6 | 3.32 |
| 7 | 3.61 |
| 8 | 3.87 |
| 9 | 4.12 |
| 10 | 4.36 |
Finally, Table 3 shows the measured CNRs of the neurological stent imaged by both the MAF and the FPD. The relative CNR is also shown calculated for the stent at each tube potential and tube output.
Table 3.
The chart above shows the CNR of the produced by a neurological stent as imaged by the MAF and the FPD.
| 80 kVp | 88 kVp | ||||||
|---|---|---|---|---|---|---|---|
| 0.6 mAs | 0.96 mAs | 1.44 mAs | 0.6 mAs | 0.96 mAs | 1.44 mAs | ||
| Neuro Stent | MAF CNR | 1.24 ± 0.083 | 1.46 ± 0.16 | 1.77 ± 0.12 | 1.35 ± 0.14 | 1.53 ± 0.18 | 1.74 ± 0.17 |
| FPD CNR | 1.09 ± 0.12 | 1.49 ± 0.16 | 1.75 ± 0.23 | 1.20 ± 0.11 | 1.62 ± 0.16 | 1.75 ± 0.26 | |
| Rel. CNR | 1.14 ± 0.15 | 0.98 ± 0.15 | 1.03 ± 0.15 | 1.13 ± 0.16 | 0.94 ± 0.14 | 0.99 ± 0.18 | |
CONCLUSIONS
The CNR of the line pairs as imaged by the FPD and the MAF are consistent with the expected result that the contrast of small objects will decrease with increasing spatial frequency. In addition, it is also expected that as the exposure to the detector system increases, the relative noise decreases, resulting in an increase in CNR. These are both demonstrated by the results for the spatially dependent line pairs imaged by both detectors.
The relative CNRs are greater than one for all but a few line pair spatial frequencies. This indicates that the use of the MAF is preferred to maximize the CNR of an object for the spatial frequencies investigated (0.6–5.0 lp/mm). Furthermore, the relative CNR increases as the line pair spatial frequency increases. This is to be expected due to the high resolution of the MAF. This work confirms that the MAF is the superior detector to the FPD for object visualization in this imaging task.
At spatial frequencies greater than the FPD’s pixel-determined Nyquist frequency of 3.71 lp/mm in the object plane, any measured signal from objects with spatial frequencies beyond 3.71 lp/mm would be aliased and may not be detectable during neuro-EIGIs. Because the CNR for the MAF is still appreciable, using the described methodology to measure the relative CNR at these spatial frequencies would lead to an infinite value. Therefore, the CNRs and relative CNRs are not reported for these frequencies.
The use of the temporal filter with the MAF, while reducing the temporal resolution, gives a substantial increase in CNR. As noted, temporal weights of ω=3 to ω=5 have been routinely used without prohibitive reduction in temporal resolution. These temporal weights correspond to noise reductions of 0.3 to 0.45 times the initial background noise and to CNR increases of 2.24 to 3 times the non-temporally filtered images.
While superiority of the MAF over the FPD is demonstrated with the relative CNR metric when imaging the low contrast bar phantom, the relative CNR metric measured using the images of the neurological stent show less certain results since the relative CNR was approximately one.
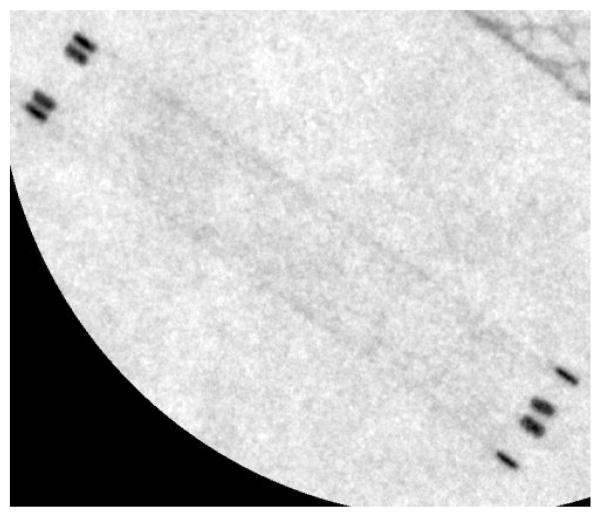
However, it is important to note that this neurological stent has very small struts. These struts are estimated to be around 50 μm in diameter. When considering the geometric unsharpness induced by the large distance of the object to the detector, it is apparent that neither detector in the present geometry had sufficient effective resolution to resolve such small details. Hence, their CNR appeared approximately the same. Nevertheless when comparing the visibility of the stent markers at the top of the stent one could easily see all four markers with the MAF but only two with the FPD since two pairs appeared to overlap (see figures 14 and 15). Therefore, the measurement of the relative CNR of the two detectors is quite dependent upon the specific task chosen.
Figure 14.
The image to the left is a magnified image taken by the MAF of the neurological stent. The four stent markers at the end of the stent can be clearly visualized.
Figure 15.
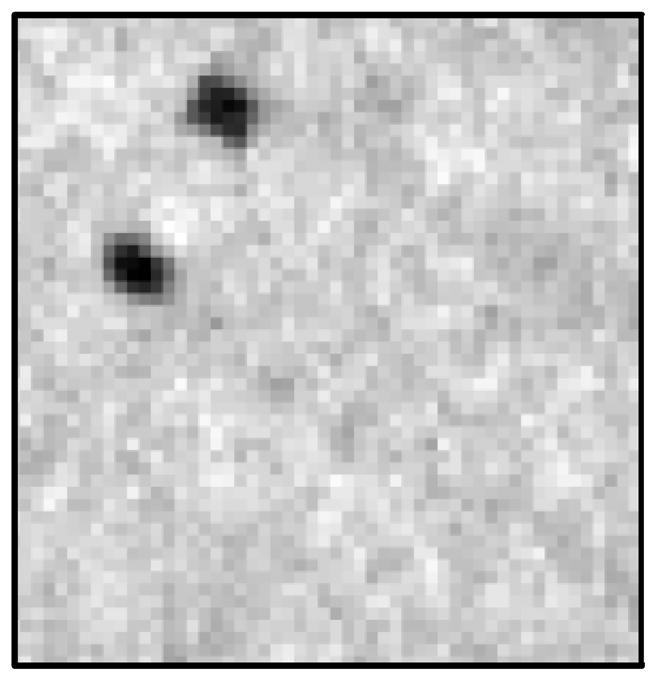
This image is a magnified image taken by the FPD of the neurological stent. The four stent markers appear as two markers due to the low resolution of the FPD.
The measured CNR’s and relative CNR of the low contrast bar phantom objects, as imaged by the MAF and FPD, indicates a superiority of the MAF for these specific image tasks. The relative CNR metric can be a valuable metric for evaluation and comparison of different x-ray detectors so long as the imaging geometry mimics the clinical imaging conditions, so long as the objects are carefully selected with realistic settings of geometric unsharpness and scatter, and that imaging geometries that degrade inherent detector performance are also avoided.
Acknowledgments
This study was supported in part by NIH Grant 2R01-EB002873 and an equipment grant from Toshiba Medical Systems Corp.
References
- 1.Rudin S, Bednarek DR, Hoffman KR. Endovascular image-guided interventions. Med Phys. 2008;35 (1):301–309. doi: 10.1118/1.2821702. [DOI] [PMC free article] [PubMed] [Google Scholar]
- 2.Wang W, Ionita C, Huang Y, Qu B, Panse A, Jain A, Bednarek DR, Rudin S. Region-of-interest micro-angiographic fluoroscope detector used in aneurysm and artery stenosis diagnoses and treatment. Proc SPIE. 2012;8313:831317-1–9. doi: 10.1117/12.910771. [DOI] [PMC free article] [PubMed] [Google Scholar]
- 3.Binning MJ, Orion D, Yasher P, Webb S, Ionita CN, Jain A, Rudin S, Hopkins LN, Siddiqui AH, Levy EI. Use of the Microangiographic Fluoroscope for Coiling of Intracranial Aneurysms. Neurosurgery. 2011;69(5):1131–1138. doi: 10.1227/NEU.0b013e3182299814. [DOI] [PMC free article] [PubMed] [Google Scholar]
- 4.Kan P, Yasher P, Ionita CN, Jain A, Rudin S, Levy EI, Siddiqui AH. Endovascular coil embolization of a very small ruptured aneurysm using a novel microangiographic technique: technical note. J Neuro Intervent Surg. 2012:1–4. doi: 10.1136/neurintsurg-2011-010154. Published Online. [DOI] [PMC free article] [PubMed] [Google Scholar]
- 5.Jain A. Design, construction, and evaluation of new high resolution medical imaging detector/systems. State University of New York; Buffalo: ProQuest, UMI Dissertations Publishing; 2010. p. 3723477. [Google Scholar]
- 6.Jain A, Bednarek DR, Ionita CN, Rudin S. A theoretical and experimental evaluation of the microangiographic fluoroscope: A high-resolution region-of-interest x-ray imager. Med Phys. 2011;38 (7):4112–4126. doi: 10.1118/1.3599751. [DOI] [PMC free article] [PubMed] [Google Scholar]
- 7.Panse A, Ionita CN, Wang W, Natarajan SK, Jain A, Bednarek DR, Rudin S. The Micro-Angiographic Fluoroscope (MAF) in High Definition (HD) Mode for Imporved Contrast-to-Noise Ratio and Resolution in Fluoroscopy and Roadmapping. IEEE Nuclear Science Symposium Conference Record; 2010 October 30; 1997. pp. 3217–3220. [DOI] [PMC free article] [PubMed] [Google Scholar]
- 8.Gill K, Ionita CN, Bednarek DR, Rudin S. Effective-Dose Rate Comparison between the Micro-Angiographic Fluoroscope (MAF) and the X-ray Image Intensifier (XII) Used during Neuro-Endovascular Device Deployment Procedures. Med Phys. 2011;38:3440. [Google Scholar]
- 9.Conwayk BJ, Duff JE, Fewell TR, Jennings RJ, Rothenberg LN, Fleischman RC. A patient equivalent attenuation phantom for estimating patient exposures from automatic exposure controlled x-ray examinations of the abdomen and lumbo-sacral spine. Med Phys. 1990;17:448–453. doi: 10.1118/1.596483. [DOI] [PubMed] [Google Scholar]
- 10.Ionita CN, Loughran B, Jain A, Vasan SNS, Bednarek DR, Levy E, Siddiqui AH, Snyder KV, Hopkins LN, Rudin S. New head equivalent phantom for task and image performance evaluation representative for neurovascular procedures occurring in the Circle of Willis. Proc SPIE. 2012;8318:83130Q. doi: 10.1117/12.911351. [DOI] [PMC free article] [PubMed] [Google Scholar]
- 11.Vasan SN, Swetadri, Ionita CN, Titus AH, Cartwright AN, Bednarek DR, Rudin S. Graphics processing unit (GPU) implementation of image processing algorithms to improve system performance of the control acquisition, processing, and image display system (CAPIDS) of the micro-angiographic fluoroscope (MAF) Proc SPIE. 2012;8313:83134C. doi: 10.1117/12.911272. [DOI] [PMC free article] [PubMed] [Google Scholar]
- 12.Hasegawa B. The Physics of Medical X-Ray Imaging. Chapter 11. Medical Physics Publishing; Madison: 1987. [Google Scholar]
- 13.Loughran B, Vasan SN, Singh V, Ionita CN, Jain A, Bednarek DR, Titus AH, Rudin S. Design considerations for a new, high resolution Micro-Angiographic Fluoroscope based on a CMOS sensor (MAF-CMOS) Proc SPIE. 2013;8668:866806. doi: 10.1117/12.2006430. [DOI] [PMC free article] [PubMed] [Google Scholar]


