

Abstract
Rationale
Current techniques for monitoring patients for apnoea suffer from significant limitations. These include insufficient availability to meet diagnostic needs, cost, accuracy of results in the presence of artefacts and difficulty of use in unsupervised conditions.
Objectives
We created and clinically tested a novel miniature medical device that targets overcoming these limitations.
Methods
We studied 20 healthy control participants and 10 patients who had been referred for sleep apnoea diagnosis. The performances of the new system and also of the Food and Drug Administration (FDA) approved SOMNO clinical system, conventionally used for sleep apnoea diagnosis were evaluated under the same conditions. Both systems were tested during a normal night of sleep in controls and patients. Their performances were quantified in terms of detection of apnoea and hypopnoea in individual 10 s epochs, which were compared with scoring of signals by a blinded clinician.
Main results
For spontaneous apnoeas during natural sleep and considering the clinician scorer as the gold standard, the new wearable apnoea detection device had 88.6% sensitivity and 99.6% specificity. In comparison the SOMNO system had 14.3% sensitivity and 99.3% specificity. The novel device had been specifically designed to detect apnoea, but if apnoea and hypopnoea during sleep were both considered in the assessment, the sensitivity and specificity were 77.1% and 99.7%, respectively, versus 54% and 98.5%, respectively, for the SOMNO.
Conclusions
The performance of the novel device compares very well to the scoring by an experienced clinician even in the presence of breathing artefacts, in this small pilot study. This can potentially make it a real solution for apnoea home monitoring.
Keywords: RESPIRATORY MEDICINE (see Thoracic Medicine), SLEEP MEDICINE
Strengths and limitations of this study.
We present the smallest, least intrusive technology to automatically detect apnoeas/hypopnoeas.
Performance characterisation in signals with and without artefacts, showing excellent agreement with expert—60 000 epochs assessed in controls and patients.
Sensitivity six times better than a state-of-the-art commercial system and excellent scoring in terms of user acceptance.
The size of the study is limited. This is, however, justified by the fact that it was an initial pilot study to prove the strength of this novel technology to detect individual events even in the presence of artefacts (study goals of 95% CIs for sensitivity and specificity values).
The technology is still not optimised for hypopnoea detection.
Introduction
Apnoea may occur acutely in the context of infectious, respiratory, cardiac and neurological disease1–5; may be caused by medication6–8; and, on occasion, death may be averted with urgent intervention.1 6 9–11 Apnoea may also occur recurrently either as a comorbidity in chronic conditions including asthma, gastro-oesophageal reflux, neuromuscular disorders and diabetes,12–16 or on its own in sleep apnoea syndrome.17–27
The importance of monitoring and quantifying apnoeas is widely acknowledged. Apnoeas are one of two leading causes of sudden death in epilepsy (SUDEP), which in the UK alone affects more people than cot death and AIDS put together.28 29 Apnoeas are also known to be a major problem due to their potentially disastrous consequences in anaesthesia recovery rooms.30 31 Sleep apnoea may affect between 2% and 10% of the adult population24 and 1% to 3% of the paediatric population,18 and is heavily underdiagnosed.19 The indirect medical costs of underdiagnosed adult patients, in the years preceding the diagnosis, is estimated to increase by up to twofold, even after correcting for chronic disease status.22 23 This, added to the potential social consequences in the form of accidents, increased morbidity and impact on work efficiency, makes the condition a major public health issue.24
Currently existing techniques for monitoring and quantification of apnoeas are not satisfactory. In sleep apnoea diagnosis, polysomnography is the gold standard; but the lack of sleep laboratories, sleep specialists and the associated cost either make it difficult for the family physician to confirm the suspicion, or delay diagnosis.25 The importance of the problem has led Medicare and Medicaid in the USA to recently authorise payment of treatment for adults diagnosed with unattended home sleep monitoring devices.24 Unfortunately, existing home monitoring devices suffer from one or several of the following limitations: the sensors can be difficult to place resulting in unacceptable recordings; they still require considerable specialist time in order to interpret the results; automatic interpretation is very inaccurate mainly due to the inability to deal with artefacts; and sensors can be cumbersome or intrusive, affecting the quality of sleep.26–27 Furthermore, there is no portable apnoea monitoring system that can detect apnoeas with high enough sensitivity and specificity in real time to potentially be used to alert carers of life-threatening situations due to acute apnoea, which can occur in the context of other clinical scenarios such as epilepsy or in anaesthesia. In these scenarios also, the alternative of relying on devices that might be able to detect the sequelae of apnoea (eg, pulse oximeters to detect hypoxaemia or heart rate monitors to detect bradycardia) might result in fatal consequences due to a delayed response to the apnoea.
We present the results of the first clinical study of a new wearable apnoea detection device (WADD) specifically designed to overcome the limitations of all other existing technologies.
Methods
Device
We determined that the strongest externally detectable signal related to breathing corresponded to turbulence in the trachea. This signal was detected with a customised acoustic chamber that optimised the signal transmission. The signal detected by the sensor has components corresponding to both the wanted ‘signal’ (breathing) and undesired ‘noise’ caused by artefacts (cardiac signal, external noise (eg speech, music and wind), movement causing rubbing against the sensor and electromagnetic interference). A novel signal processing algorithm was developed to differentiate ‘signal’ from ‘noise’. The algorithm evaluates the temporal and frequency characteristics of the signal obtained from the sensor. Over 15 different features are analysed with parametric functions that dynamically adapt over time, to compensate for changes in the participant and the environment. No precalibration or participant specific knowledge or modification is needed for the sensor or the signal processing algorithm.32–34 Part of the algorithm was implemented on hardware and incorporated into the sensor. This reduces the amount of data that is needed for wireless transmission and consequently the amount of power required from the battery; hence the small size of the device. The wireless receiver and the remaining part of the algorithm were run on a laptop computer.
The WADD we used in the study was wireless, measured 3.74×2.4×2.1 cm weighed 17 g and was fixed to the skin on the neck with hydrocolloid colostomy adhesive patches of approximately 4 cm diameter (Boots, UK). The preferred location was over the trachea, halfway between the lower margin of the thyroid cartilage and the suprasternal notch (figure 1(A)). If the skin in that location was loose, as was common in participants above 40 years of age, the device was placed anterolaterally, anterior to the sternomastoid muscle. The device was left in place overnight, for approximately 14 h.
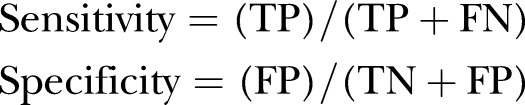
Figure 1.
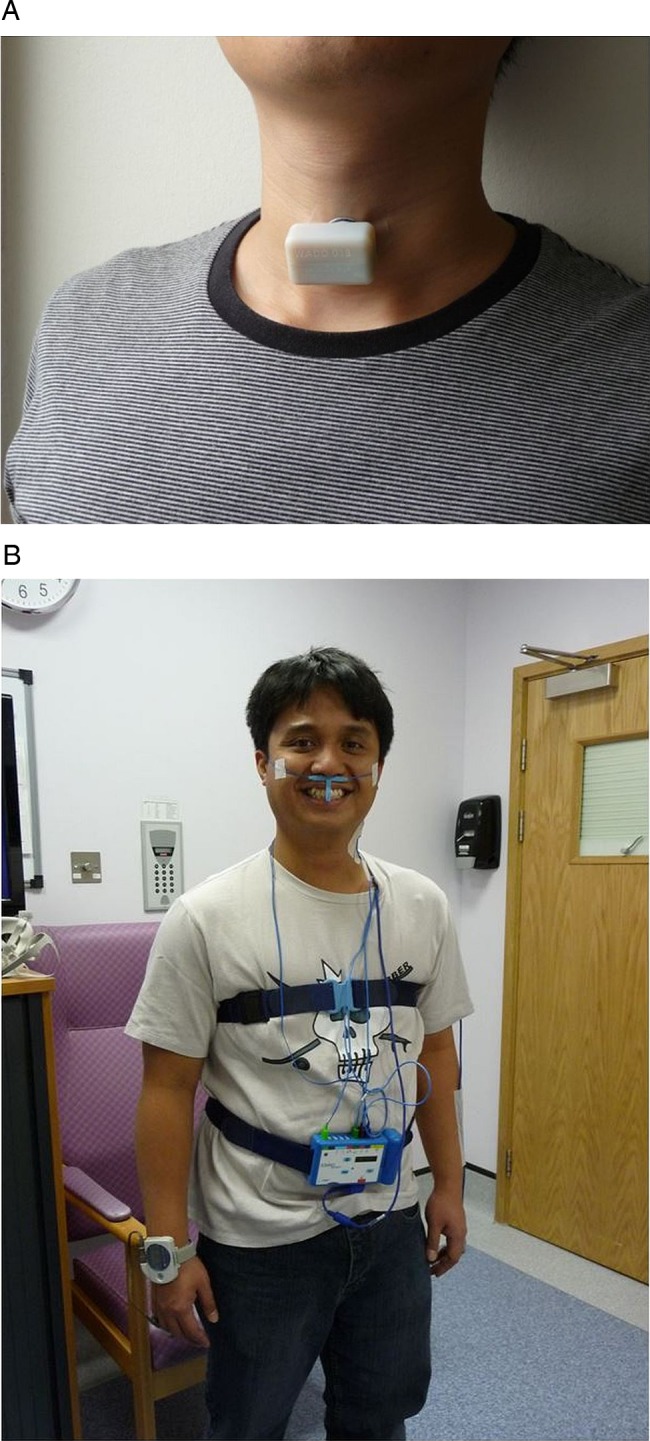
(A) wearable apnoea detection device (WADD) worn by one of the investigators. (B) Participant wearing an existing state of the art ambulatory apnoea monitoring system (SOMNO), comprising finger oximetry; oronasal flow sensors; thoracic and abdominal expansion bands; and ECG.
Participants
The study was conducted in a sleep study room of the National Hospital for Neurology and Neurosurgery (UK). We studied 20 healthy controls and 10 patients, as they were sequentially admitted for diagnostic monitoring of sleep-related disorders of breathing, because these were likely to have spontaneous apnoea events. The patients and controls were not matched. Patients also had a variety of neurological conditions, including epilepsy, dementia, neuropathy and motor neuron disease. The reasons to recruit patients who had been referred for diagnosis of possible sleep-related disorders of breathing, as opposed to those who had been already diagnosed, were twofold. First, the purpose of this study was not to evaluate the WADD for sleep apnoea diagnosis, but rather to evaluate its ability to detect individual events during controlled conditions to assess the robustness to artefact rejection and also during spontaneous sleep. Good performance on individual event identification would, however, be expected to translate in a good performance in the context of the different clinical applications. Second, non-diagnosed patients were recruited because studying diagnosed individuals would have involved either delay or interruption of their treatment. The decision on the number of patients was based on obtaining a large enough number of events that would lead to the study goals of 95% CIs for sensitivity and specificity values (based on clinical experience on the minimum number of apnoea events that would be expected per subject referred for sleep apnoea diagnosis, per night). A larger number of controls were included to be able to assess specificity among those who were most likely to be disease free, and also in the presence of artefacts. The patient group comprised 2 females and 8 males with: a median age of 44.5 years of age (range 25–82); a median weight of 74 kg (range 41–187); a median height of 177 cm (range 160–188); a median body mass index (BMI) of 23 kg/cm2 (range 17–61); and a median neck circumference of 40 cm (range 30–43). The control group comprised 3 females and 17 males with: a median age of 33.5 years of age (range 23–63); a median weight of 81.5 kg (range 60–120); a median height of 176 cm (range 145–185); a median BMI of 26.5 kg/cm2 (range 20–36); and a median neck circumference of 38 cm (range 34–48). Overall, 40% of the participants were overweight and 24% were obese.
Procedure
All participants also had simultaneous, clinically standard respiratory monitoring comprising: finger oximetry; oronasal airflow sensors; thoracic and abdominal expansion bands; and ECG; using the SOMNO polysomnography system (SOMNOscreen RC kombi. SOMNO Medics, Germany) (figure 1(B)). Additionally, to further facilitate expert interpretation of polysomnography data, a second pulse oximeter (Pulsox-300i, Konica Minolta, Japan) was attached to the free hand. After attachment of the WADD and the SOMNOmedics polysomnography system, control participants participated in a series of exercises, comprising:
Normal breathing for 5 min.
Shallow breathing for 5 min.
Normal breathing for 45 s alternating with 15 s instructed breath holds for 5 min.
Normal breathing for 30 s alternating with 30 s instructed breath holds for 10 min.
As in 3 but with loud music in the background.
Normal breathing while walking for 5 min.
Normal breathing for 30 s alternating with 30 s instructed breath holds while lying prone for 5 min.
These exercises were designed to be representative of the worse case of artefact situations affecting the WADD following previous, very exhaustive, laboratory-based research and testing. Following the exercises participants were allowed to prepare for sleep and were left undisturbed overnight.
Data analysis
The breathing exercises data were analysed by the automated WADD software and the automated SOMNO software. Instructed apnoeas were considered to be the ‘true events’. The last 6 h of sleep were blindly analysed by the automated WADD software, the automated SOMNO software and by the experienced clinician who reviewed the raw signals from all SOMNO sensors, and had no knowledge about how WADD had been designed or worked. The reason to evaluate the last 6 h of sleep was to try to keep the same amount of sleep data in as many participants as possible in order to prevent biasing of the results. The pulse oximeter was also used by the clinician to support the diagnostic decisions and also individual event classification mostly in those cases in which the signals from the other SOMNO pulse oximeter were corrupted by artefacts. After the separate classification of WADD and SOMNO data, a further investigator compared the results.
The breathing exercises data were analysed in 15 s epochs because this was the shortest duration of an instructed apnoea. The sleep data were analysed in 10 s epochs.
Two assessments were carried out of the sleep data. In the first assessment there was no preassumption of a gold standard, and the three systems (WADD, SOMNO and expert marker) were put under test and treated indistinctively. An epoch would be classified as true positive apnoea or true positive hypopnoea if at least two out of the three systems concurred on the classification. In the second assessment the final classification of these epochs would be that of the expert marker or, in other words, the expert marker was considered to be the gold standard deciding, and the performances of SOMNO and WADD system were evaluated. The SOMNO was evaluated as well as the WADD, as there is little or no quantitative information about the accuracy of automated polysomnography systems.
In both assessments epochs could be classified as:
True positive apnoea (cessation of breathing signal, with correspondent absence of respiratory airflow).
True positive hypopnoea (over 50% reduction in oronasal signal and in thoracoabdominal movement together with over 2% decrease in oxygen saturation).
False positive hypopnoea (if a system had classified a breathing epoch as a hypopnoea).
False positive apnoea (if a system had classified a breathing epoch as an apnoea).
False classification apnoea as hypopnoea (if a system had classified an apnoea epoch as hypopnoea).
False classification hypopnoea as apnoea (if a system had classified hypopnoea as apnoea).
False negative apnoea (if a system had classified an apnoea as breathing).
False negative hypopnoea (if a system had classified a hypopnoea as breathing).
The breathing exercises data were analysed in the same way, but the instructed apnoeas and breathing sections were considered the absolute truth and hence there was no independent expert review.
The performances of the three systems were evaluated using the following metrics:
 |
(TP=true positive, TN=true negative, FP=false positive, FN=false negative).
The analysis was carried out assuming that all apnoea events were independent, since it was observed that the characteristics of the breathing signal changed as much within the same participant (depending on timing, position, external artefacts, etc), as between different participants. This was further verified by taking three random 10 min sections of the sensed breathing signals in the 30 different participants and obtaining the different correlation coefficients (2700 in total). The maximum correlation coefficient obtained from signals within the same participant was 0.05. The maximum correlation coefficient obtained from different subjects was 0.067.
For each of the two assessments (ie, not presuming a gold standard and considering the expert to be the gold standard), two different analyses were carried out. First, only apnoeas were considered to be true positives. Hence any hypopnoea would be regarded as breathing (true negative); False classification of hypopnoeas as apnoeas were reclassified as false positives; and false classification of apnoeas as hypopnoeas were re-classified as false negatives. Second, apnoeas and hypopnoeas were considered indistinctively, and hence true events of both varieties would be also considered together.
These two analyses were carried out as they would be relevant to different clinical scenarios. For example, high sensitivity for detecting apnoea would be crucial for identification of sudden apnoea if monitoring those with epilepsy; whereas for diagnosis of sleep-related breathing dysfunction, which generally relies on the Apnoea Hypopnoea Index, the differentiation between apnoea and hypopnoea might be clinically less important.
Results
Breathing exercises data
Data were available in 3956 15s epochs for the controls performing the breathing exercises (132 in total). Table 1 summarises the performance of WADD and SOMNO in the seven breathing exercises. Figure 2 illustrates examples of the signals obtained from the different sensors. Table 1 is divided in three parts. Part (a) and (b) quantify performance considering different scenarios for wrongly classified hypopnoeas. Although the real events were apnoeas, both systems had the ability to indicate hypopnoeas too. This resulted in some real apnoea and breathing epochs being wrongly marked as hypopnoeas. To account for these, table 1 (A) shows the sensitivity and specificity when only apnoeas are considered as events (ie, hypopnoeas would be regarded as breathing). In part (B) of the table hypopnoeas and apnoeas are indistinctively considered. Part (C) illustrates the total number of epochs that fall into a specific classification for both systems. The combined sensitivity and specificity for all the exercises across all the participants for the WADD was 97.7% and 99.6% (considering hypopnoeas as breathing); or 99.2% and 99.5% (considering hypopnoeas as events). With the same criteria the sensitivity and specificity for the SOMNO was only 37.8% sensitivity, 96.5% specificity; or 62.8% sensitivity, 90.5% specificity.
Table 1.
Summary of performance for the WADD and SOMNO across the seven breathing exercises (as detailed in procedure)
| Exercise | Sensitivity (%) |
Specificity (%) |
||
|---|---|---|---|---|
| WADD | SOMNO | WADD | SOMNO | |
| (A) WADD versus SOMNO performance in instructed exercises with hypopnoeas NOT considered as events | ||||
| T1 | NA | NA | 100 | 99.2 |
| T2 | NA | NA | 100 | 90.6 |
| T3 | 94.6 | 38 | 99 | 96.9 |
| T4 | 98.9 | 38.8 | 99.7 | 94.5 |
| T5 | 99.2 | 31.4 | 99.2 | 99.7 |
| T6 | NA | NA | 100 | 96.5 |
| T7 | 94.2 | 48.2 | 98.5 | 99 |
| Total | 97.7 | 37.8 | 99.6 | 96.5 |
| (B) WADD versus SOMNO performance in instructed exercises with hypopnoeas and apnoeas indistinctively considered as events | ||||
| T1 | NA | NA | 100 | 99 |
| T2 | NA | NA | 100 | 81.4 |
| T3 | 96.7 | 66.3 | 99 | 87.5 |
| T4 | 100 | 64.6 | 99.7 | 87.9 |
| T5 | 99.2 | 59.2 | 99.2 | 95.1 |
| T6 | NA | NA | 100 | 89.8 |
| T7 | 99 | 64.4 | 97 | 93.4 |
| Total | 99.2 | 62.8 | 99.5 | 90.5 |
| Exercise | TP |
TN |
FC |
FP |
FN |
|||||
|---|---|---|---|---|---|---|---|---|---|---|
| WADD | SOMNO | WADD | SOMNO | WADD | SOMNO | WADD | SOMNO | WADD | SOMNO | |
| (C) Summary of classification of the different epochs | ||||||||||
| T1 | 0 | 0 | 380 | 376 | 0 | 0 | 0 | 4 | 0 | 0 |
| T2 | 0 | 0 | 360 | 293 | 0 | 0 | 0 | 67 | 0 | 0 |
| T3 | 89 | 61 | 285 | 252 | 2 | 26 | 3 | 36 | 3 | 31 |
| T4 | 356 | 230 | 363 | 320 | 4 | 92 | 1 | 44 | 0 | 126 |
| T5 | 357 | 213 | 365 | 350 | 0 | 100 | 3 | 18 | 3 | 147 |
| T6 | 0 | 0 | 400 | 359 | 0 | 0 | 0 | 41 | 0 | 0 |
| T7 | 189 | 123 | 191 | 184 | 9 | 31 | 6 | 13 | 2 | 68 |
| Total | 991 | 627 | 2344 | 2134 | 15 | 249 | 13 | 223 | 8 | 372 |
Part (a) of the table shows the sensitivity and specificity not considering hypopnoeas as events (ie, all hypopnoeas are considered breathing). Based on this all FCs (apnoeas wrongly classified as hypopnoeas) are considered FNs; and all FPs hypopnoeas are considered TNs. Part (b) shows the sensitivity and specificity considering apnoea and hypopnoea as indistinctive events. Based on this all FC are reclassified as TPs; and all FP hypopnoeas are FPs. Part (c) details the number of epochs corresponding to a particular classification.
FC, false classification; FN, false negative; FP, false positive; TN, true negative (breathing); TP, true positive (apnoea); WADD, wearable apnoea detection device.
Figure 2.

Illustration of the SOMNO and wearable apnoea detection device (WADD) output signals showing an apnoea event: (top) raw signals from the different SOMNO sensors, (middle) processed WADD signal, (bottom) WADD output signal.
Sleep data
For the sleep data 62727 10s epochs were analysed, in total, 34 true apnoea epochs and 40 true hypopnoea epochs were identified for the controls (36 and 37 if the clinician scorer was considered to be the gold standard); and 312 apnoea epochs and 181 hypopnoea epochs for the patients (342 and 200 if the clinician scorer was considered to be the gold standard). The average number of apnoea epochs for the patient group throughout the night was 32. All patients had episodes of apnoea or hypopnoea. There were only two patients who did not have any episode of apnoea. For one control, only 3.2 h of data were recorded, because of an ICT error. For one patient, only 3 h were analysed as more than one SOMNO sensor including the nasal cannula and the pulse oximeters detached prematurely. The results in terms of sensitivity and specificity for the control group, patient group and overall are presented in table 2. Table 2 is divided in four parts: the first and second evaluate the performance for apnoea and apnoea/hypopnoea combined detection respectively without assuming a gold standard (ie, the consensus of the majority determines a true event); and the third and fourth parts present the same evaluation but considering the expert as the gold standard.
Table 2.
Summary of performance for the WADD, SOMNO and clinician scorer systems for detection of apnoea and hypopnoea in 10 s epochs of overnight recordings
| SOMNO sensitivity | WADD sensitivity | Clinician sensitivity | SOMNO specificity | WADD specificity | Clinician specificity | |
|---|---|---|---|---|---|---|
| Apnoea detection (% sensitivity and specificity) | ||||||
| Controls | 47.1 | 97.1 | 94.1 | 99.3 | 99.8 | 100 |
| (95% CI) | (30.3 to 63.8) | (91.4 to 100) | (86.2 to 100) | (99.2 to 99.3) | (99.7/99.8) | (100 to 100) |
| Patients | 14.7 | 99.4 | 98.1 | 99.5 | 99.5 | 99.9 |
| (95% CI) | (10.8 to 18.7) | (98.5 to 100) | (96.6 to 99.6) | (99.5 to 99.6) | (99.4 to 99.6) | (99.8 to 99.9) |
| All | 17.9 | 99.1 | 97.7 | 99.4 | 99.7 | 99.9 |
| (95% CI) | (13.9 to 22.0) | (98.2/100) | (96.1 to 99.3) | (99.3 to 99.4) | (99.6 to 99.7) | (99.9 to 100) |
| Apnoea and hypopnoea combined detection (%) | ||||||
| Controls | 87.8 | 58.1 | 94.6 | 98.6 | 99.7 | 100 |
| (95% CI) | (80.4 to 95.3) | (46.9 to 69.4) | (89.4 to 99.8) | (98.5 to 98.7) | (99.6 to 99.7) | (100 to 100) |
| Patients | 53.3 | 88.2 | 98.8 | 97.9 | 99.5 | 99.8 |
| (95% CI) | (48.9 to 57.8) | (85.4 to 91.1) | (97.8 to 99.8) | (97.7 to 98.1) | (99.4 to 99.6) | (99.8 to 99.9) |
| All | 57.8 | 84.1 | 98.2 | 98.4 | 99.5 | 99.9 |
| (95% CI) | (53.8 to 61.9) | (81.1 to 87.1) | (97.2 to 99.3) | (98.3 to 98.5) | (99.5 to 99.6) | (99.9 to 100) |
| SOMNO sensitivity | WADD sensitivity | SOMNO specificity | WADD specificity | |
|---|---|---|---|---|
| Apnoea detection with the clinician scorer as gold standard reference (%) | ||||
| Controls | 38.9 | 86.1 | 99.2 | 99.7 |
| (95% CI) | (23.0 to 54.8) | (74.8 to 97.4) | (99.1 to 99.3) | (99.7 to 99.8) |
| Patients | 11.7 | 88.9 | 99.5 | 99.4 |
| (95% CI) | (8.3 to 15.1) | (85.6 to 92.2) | (99.4 to 99.6) | (99.3 to 99.5) |
| All | 14.3 | 88.6 | 99.3 | 99.6 |
| (95% CI) | (10.8 to 17.8) | (85.4 to 91.8) | (99.2 to 99.4) | (99.6 to 99.7) |
| Apnoea and hypopnoea combined detection with clinician scorer as gold standard (%) | ||||
| Controls | 86.3 | 54.8 | 98.6 | 99.6 |
| (95% CI) | (63/73) | (40/73) | (41 539/42 139) | (41 987/42 139) |
| Patients | 49.6 | 80.1 | 98.4 | 100 |
| (95% CI) | (45.4 to 53.8) | (75.2 to 82.1) | (98.2 to 98.6) | (99.9 to 100) |
| All | 54.0 | 77.1 | 98.5 | 99.7 |
| (95% CI) | (50.0 to 57.9) | (73.8 to 80.5) | (98.4 to 98.6) | (99.7 to 99.8) |
WADD, wearable apnoea detection device.
The WADD also had the added feature of being able to differentiate between central and obstructive apnoea. 90% of the central apnoeas were rightly marked as central. 96% were rightly marked as obstructive. Approximately 60% of the total apnoeas were obstructive in origin.
Device comfort
After the overnight study, the devices were detached and the participants scored the comfort of the devices and quality of sleep (rating 1–5, with 5 representing maximum comfort and quality). Skin irritation caused by the WADD's adhesive was also rated from 1 to 5 (5 representing no irritation, 4 mild transient, redness and 1 severe irritation). The median rating for WADD comfort was 5 (range 4–5). The median rating for SOMNO comfort was 3 (range 1–5 for controls and 2–5 for patients). The median rating for irritation caused by the WADD plaster on the neck was 5 (range 5–5 for controls and 4–5 for patients).
Discussion
Main findings
WADD had very high sensitivity and specificity for detecting apnoea in 15 s epochs in a series of breathing and breath-holding exercises in a variety of conditions, including the presence of external background noise, movement and posture. The tolerability of WADD was superior to the portable polysomnography system (SOMNO) during overnight recordings.
WADD had 97.7–99.2% sensitivity to detect instructed apnoeas and 88.6–99.1% for 10 s spontaneous apnoeas during natural sleep, with similar performance in controls and patients. The WADD also detected all apnoeas over 30 s and there were only 3 over 30 s false positives. For short apnoeas, in most cases, disagreement between the clinician scorer and the WADD were caused by the WADD identifying as apnoea epochs that the expert classified as hypopnoeas.
As expected, the WADD performance was not as good when apnoeas and hypopnoeas were considered together (minimum sensitivity 77.1%).This is not surprising since the WADD was designed to identify apnoea, not hypopnoeas and the latter were detected from the transmitted signal that had already been preprocessed for apnoea detection. From the table, it can be observed that the degradation of performance was more evident in the controls because the controls had a large number of shorter hypopnoeas (under 22.5 s), which the WADD did not detect properly. In the patients, who often demonstrated apnoeas, the hypopnoea events were longer and these were detected by the WADD. Although the lower sensitivity in hypopnoea detection might in principle seem problematic if the WADD were to be used in the context of sleep apnoea diagnosis (hypopnoeas are very common events in sleep laboratories), it is worth noting that: (1) there is no other reported automatic system that gets anywhere close to this with similar specificity and apnoea detection performance; (2) the variations between different sleep laboratories due to the non-uniform definition of hypopnoeas already leads to much larger diagnostic variations than the limitation in sensitivity of the WADD35–37; and (3) assuming the worse case scenario for the WADD, being that a patient only had hypopnoeas throughout the night, this reduced sensitivity would be a problem that would translate to non-diagnosis of sleep apnoea for patients who with 100% sensitivity would have had a sleep apnoea hypopnoea index (AHI) between 5 and 6 (ie, very mild cases of sleep apnoea). Patients with no sleep apnoea, moderate sleep apnoea, severe sleep apnoea and those with mild sleep apnoea with AHI between 6 and 15 would have been rightly diagnosed.
The median difference between the WADD calculated AHI and the one obtained by the gold standard was 0 (average=0.7).
SOMNO performance
The automatic analysis of the SOMNO apparatus, a Food and Drug Administration (FDA) approved and clinically accepted system, based on assessing apnoea from a variety of different sensors, significantly differed from that of the expert marker, with an average sensitivity value of around 14%. The results obtained from the instructed apnoeas tests also showed that even in the absence of artefacts, apnoeas were not well detected by the SOMNO system, with an average sensitivity of 37.8%. This demonstrates the need for caution if relying on current automated assessment methods for diagnosing apnoea. While performance might be improved by optimising parameters for individual patients, this is not practical for single overnight recordings or use as an alerting monitor. The WADD does not require any parameter optimisation or participant specific calibration.
The SOMNO system performance improved in the event of indistinct classification of apnoeas and hypopnoeas, but was still poor compared with the clinician scorer (54% sensitivity). This sensitivity was at the cost of reduced specificity: for every true hypopnoea detected there were approximately four false detections. Overall, the performance of the WADD in hypopnoea/apnoea combined detection was significantly better than the SOMNO, in sensitivity (77.1% vs 54% if considering the clinician scorer as a gold standard, and 84.1% vs 57.8% otherwise), but also in specificity, as the WADD only detected one false hypopnoea epoch for every four true events.
Limitations and future improvements
The study described in this paper is a small pilot study and hence further comprehensive clinical evaluation of the technology will be necessary before it can be used. The size of the study was, however, adequate to assess the potential of the technology; to determine whether the initial performance results in controlled conditions were equivalent to those obtained in real scenarios; and to inform a clinical trial. Based on these positive results it is expected that a fully powered clinical trial, focused on diagnosis rather than on individual event identification, will follow in the future.
The calculation of the sensitivity and specificity has assumed that all apnoea events were independent, which for some might not be completely correct. If the data had not been pooled, and taking the expert marker as the gold-standard, in 67% of the participants the individual apnoea detection sensitivity was 100%. In 77% it was over 90%. In the remaining cases, the drop in sensitivity corresponded always to just one non-detected apnoea shorter than 15 s in the 6 h night, which is clinically insignificant. The average from the individual sensitivities was 2% higher than the value obtained pooling the data. In terms of specificity 90% of the participants had values higher than 99%. Two-thirds of them were over 99.9%. The average of the individual specificities was identical to the specificity obtained pooling the data.
A different statistical analysis, possibly comparing pooled with non-pooled data, will be the subject of investigation when the technology undergoes a larger clinical trial.
The WADD is obviously no substitute to a full night study in a sleep clinic, since it does not provide all the information that a full polysomnography system would. There are advantages and disadvantages to this device with respect to full polysomnography. The WADD can be used to determine the AHI, which is used in sleep apnoea diagnosis to ascertain whether a patient has sleep apnoea and to score the severity of the condition. The WADD's main advantage is that it can be used for home assessment or monitoring, and from that point of view it is clearly superior to any of the other existing devices (highly resilient to artefacts, very easy to attach and durable in position, low cost, much more comfortable and accurate). Considering the restricted resources for sleep clinic referral this device could be a very useful tool to determine, at very low cost, who should be referred to a specialist centre for full polysomnography. The disadvantage is that there are other parameters that could be used for extra-assessment that the device does not measure, such as microarousal or full cardiac activity. Furthermore, the WADD does not allow assessment of the hypoxic load or autonomic activation and therefore impacts the cardiovascular or stroke risk associated with OSA syndrome.
The WADD device used in the current study relied on wireless transmission to a PC. However, changing the PC to a dedicated mobile phone sized receiver poses no technological challenge. A subsequent version that is being developed is smaller (2.4 by 2.4 by 1.2 cm, weighing 7.5 g) and can operate continuously on hearing aid batteries for over 48 h. It has a separate dedicated receiver of comparable size to a mobile phone, which can be located up to 10 m from the participant.
Supplementary Material
Acknowledgments
The authors thank Eduardo Aguilar-Pelaez for assisting with the data collection at the initial phases of the clinical study and proof reading one of the versions of the manuscript; Pauline Rogers (Statistician, UCL/H Biomedical Research Unit) for carrying out the statistical analysis leading to the number of tested participants; UCL Business; Epilepsy Society; and Staff on MITU at NHNN.
Footnotes
Contributors: JD and ER-V had the initial idea of developing a wearable breathing monitoring device. ER-V and GC were the main creators of the novel device carrying out the electronic design, which includes hardware and software. JD contributed through the process helping to define the engineering specifications to meet the clinical need. JD designed the protocol for the clinical study. ER-V created the documentation for MHRA approval. JR led the clinical studies and blindly marked all the data using the sensors of the SOMNO system as well as the Konica Minolta pulse oximeter. ER-V and GC compared the results of the data scored by the WADD, SOMNO and blinded expert, and carried out the data analysis. All the authors contributed to the interpretation of data. JD, JR and ER-V wrote the paper.
Funding: UCL Business (grant number PoC-09-007).
Competing interests: None.
Ethics approval : The study was approved by the Medicine and Healthcare products Regulatory Agency (MHRA) and the Research Ethics Committee of the UK National Hospital for Neurology and Neurosurgery
Provenance and peer review: Not commissioned; externally peer reviewed.
Data sharing statement: No additional data are available.
References
- 1.Shorvon S, Tomnson T. Sudden unexpected death in epilepsy. Lancet 2011;378:2028–38 [DOI] [PubMed] [Google Scholar]
- 2.Mace SE. Acute bacterial meningitis. Emerg Med Clin North Am 2008;26:281–317 [DOI] [PubMed] [Google Scholar]
- 3.Cordero L, Rau R, Taylor D, et al. Enteric gram-negative bacilli bloodstream infections: 17 years’ experience in a neonatal intensive care unit. Am J Infect Control 2004;32:189–95 [DOI] [PubMed] [Google Scholar]
- 4.Powers KS. Acute pulmonary infections. In: Lucking SE, Maffei FA, Tamburro RF, Thomas NJ, eds. Pediatric critical care study guide. London: Springer, 2012:514–34 [Google Scholar]
- 5.Moruzzi P, Sarzi-Braga S, Rossi M, et al. Sleep apnea in ischaemic heart disease: differences between acute and chronic coronary syndromes. Heart 1999;82:343–7 [DOI] [PMC free article] [PubMed] [Google Scholar]
- 6.Van Vliet G, Deal CL, Crock PA, et al. Sudden death in growth hormone-treated children with Prader-Willi syndrome. J Pediatr 2004;144:129–31 [DOI] [PubMed] [Google Scholar]
- 7.Taylor MB, Grounds RM, Mulrooney PD, et al. Ventilatory effects of propofol during induction of anaesthesia. Comparison with thiopentone Anaesthesia 1986;41:816–20 [DOI] [PubMed] [Google Scholar]
- 8.Murphy JJ, Swanson T, Ansermino M, et al. The frequency of apneas in premature infants after inguinal hernia repair: do they need overnight monitoring in the intensive care unit?. J Pediatr Surg 2008;43:865–8 [DOI] [PubMed] [Google Scholar]
- 9.Naeem N, Montenegro H. Beyond the intensive care unit: a review of interventions aimed at anticipating and preventing in-hospital cardiopulmonary arrest. Resuscitation 2005;67:13–23 [DOI] [PubMed] [Google Scholar]
- 10.Moon RY, Horne RS, Hauck FR. Sudden infant death syndrome. Lancet 2007;370:1578–87 [DOI] [PubMed] [Google Scholar]
- 11.Gami AS, Howard DE, Olson EJ, et al. Day-night pattern of sudden death in obstructive sleep apnea. N Engl J Med 2005;352:1206–14 [DOI] [PubMed] [Google Scholar]
- 12.Julien JY, Martin JG, Ernst P, et al. Prevalence of obstructive sleep apnea–hypopnea in severe versus moderate asthma. J Allergy Clin Immunol 2009;124:371–6 [DOI] [PubMed] [Google Scholar]
- 13.Emilsson O, Janson C, Benediktsdóttir B, et al. Nocturnal gastroesophageal reflux, lung function and symptoms of obstructive sleep apnea: Results from an epidemiological survey. Respir Med 2012;106:459–66 [DOI] [PubMed] [Google Scholar]
- 14.Reichmuth K, Austin D, Skatrud JB, et al. Association of sleep apnea and type II diabetes. A population-based study. Am J Respir Crit Care Med 2005;172:1590–5 [DOI] [PMC free article] [PubMed] [Google Scholar]
- 15.Hanly PJ. Mechanisms and management of central sleep apnea. Lung 1992;170:1–17 [DOI] [PubMed] [Google Scholar]
- 16.Culebras A. Sleep and neuromuscular disorders. Neurol Clin 2005;23:1209–23 [DOI] [PubMed] [Google Scholar]
- 17.Young T, Palta M, Dempsey J, et al. The occurrence of sleep disordered breathing among middle aged adults. N Engl J Med 1993;328:1230–5 [DOI] [PubMed] [Google Scholar]
- 18.Faroux B. What's new in pediatric sleep? Pediatr Respir Rev 2007;8:85–9 [DOI] [PubMed] [Google Scholar]
- 19.Pang KP, Terris DJ. Screening for obstructive sleep apnea; an evidence-based analysis. Am J Otolaryngol 2006;27:112–18 [DOI] [PubMed] [Google Scholar]
- 20.Redline S, Quan SF. Sleep apnea: a common mechanism for the deadly triad--cardiovascular disease, diabetes, and cancer? Am J Respir Crit Care Med 2012;186:123–4 [DOI] [PubMed] [Google Scholar]
- 21.Hirshkowitz M. The clinical consequences of obstructive sleep apnea and associated excessive sleepiness. J Fam Pract 2008; 57(8 Suppl):S9–16 [PubMed] [Google Scholar]
- 22.Wittmann V, Rodenstein DO. Health care costs and the sleep apnea syndrome. Sleep Medicine Rev 2004;8:269–79 [DOI] [PubMed] [Google Scholar]
- 23.Smith R, Ronald J, Delaive K, et al. What are obstructive sleep apnea patients being treated for prior to this diagnosis? Chest 2002;12:164–72 [DOI] [PubMed] [Google Scholar]
- 24.Leger D, Bayon V, Laaban JP, et al. Impact of sleep apnea on economics. Sleep Med Rev 2012;16:455–62 [DOI] [PubMed] [Google Scholar]
- 25.Flemons WW, Douglas NJ, Kuna ST, et al. Access to diagnosis and treatment of patients with suspected sleep apnea. Am J Respir Crit Care Med 2004;169:668–72 [DOI] [PubMed] [Google Scholar]
- 26.Oliveira MG, Nery LE, Santos-Silva R, et al. Is portable monitoring accurate in the diagnosis of obstructive sleep apnea syndrome in chronic pulmonary obstructive disease? Sleep Med 2012;13: 1033–8 [DOI] [PubMed] [Google Scholar]
- 27.Flemons WW, Littner MR, Rowley JA, et al. Home diagnosis of sleep apnea: a systematic review of the literature. An evidence review cosponsored by the American Academy of Sleep Medicine, the American College of Chest Physicians, and the American Thoracic Society. Chest 2003;124:1543–79 [DOI] [PubMed] [Google Scholar]
- 28.McDonald F. Avoidable epilepsy-related deaths: the case for prevention. Epilepsy Bereaved Report, 2011
- 29.Surges R, Sander JW. Sudden unexpected death in epilepsy: mechanisms, prevalence and prevention. Curr Opin Neurol 2012;2:201–7 [DOI] [PubMed] [Google Scholar]
- 30.Lofsky A. Sleep apnea and narcotic postoperative pain medication: a morbidity and mortality risk. Anaesthesia Patient Safety Foundation Newsletter. Summer 2002;17:24–5 [Google Scholar]
- 31.Bhananker SM, Posner KL, Cheney FW, et al. Injury and liability associated with monitored anesthesia care: a closed claims analysis. Anesthesiology 2006;104:228–34 [DOI] [PubMed] [Google Scholar]
- 32.Rodriguez-Villegas E, Corbishley P, Duncan JS, et al. A method and apparatus for monitoring respiratory activity. Patent WIPO; WO/2007/099314
- 33.Corbishley PG, Rodriguez-Villegas E. Breathing detection: towards a miniaturized wearable, battery-operated monitoring system. IEEE Trans Biomed Eng 2008;55:196–204 [DOI] [PubMed] [Google Scholar]
- 34.Rodriguez-Villegas E, Chen G, Aguilar-Pelaez E. Feature characterization for breathing monitor. Patent WIPO; WO/2012/007719
- 35.Nigro CA, Rhodius EE. Effect of the definition of hypopnea on apnea/hypopnea index. Medicina 2003;63:119–24 [PubMed] [Google Scholar]
- 36.Redline S, Kapur VK, Sanders MH, et al. Effects of varying approaches for identifying respiratory disturbances on sleep apnea assessment. Am J Respir Crit Care Med 2000;161:369–74 [DOI] [PubMed] [Google Scholar]
- 37.Ruehland WR, Rochford PD, O'Donoghue FJ, et al. The New AASM Criteria for Scoring Hypopneas: impact on the Apnea Hypopnea Index. Sleep 2009;32:150–7 [DOI] [PMC free article] [PubMed] [Google Scholar]
Associated Data
This section collects any data citations, data availability statements, or supplementary materials included in this article.