

Abstract
Background
Exercise testing provides valuable information in addition to ST‐segment changes. The present study evaluated the associations among exercise test parameters and all‐cause mortality in a referral population.
Methods and Results
We examined conventional cardiovascular risk factors and exercise test parameters in 6546 individuals (mean age 49 years, 58% men) with no known cardiovascular disease who were referred to our clinic for exercise stress testing between 1993 and 2003. The association of exercise parameters with mortality was assessed during a follow‐up of 8.1±3.7 years. A total of 285 patients died during the follow‐up period. Adjusting for age and sex, the variables associated with mortality were: smoking, diabetes, functional aerobic capacity (FAC), heart rate recovery (HRR), chronotropic incompetence, and angina during the exercise. Adjusting for cardiovascular risk factors (diabetes, smoking, body mass index, blood pressure, serum total, HDL, LDL cholesterol, and triglycerides) and other exercise variables in a multivariable model, the only exercise parameters independently associated with mortality were lower FAC (adjusted hazard ratio [HR] per 10% decrease in FAC, 1.21; 95% confidence interval [CI], 1.13 to 1.29; P<0.001), and abnormal HRR, defined as failure to decrease heart rate by 12 beats at 1 minute recovery (adjusted HR per 1‐beat decrease, 1.05; 95% CI, 1.03 to 1.07; P<0.001). The additive effects of FAC and HRR on mortality were also highly significant when considered as categorical variables.
Conclusion
In this cohort of patients with no known cardiovascular disease who were referred for exercise electrocardiography, FAC and HRR were independently associated with all‐cause mortality.
Keywords: exercise test, fitness, mortality
Introduction
Apart from diagnosing obstructive coronary disease, exercise treadmill test (ETT) provides useful prognostic information such as an estimate of cardiopulmonary fitness,1–3 chronotropic reserve,4–5 blood pressure (BP) response,6 heart rate recovery (HRR),7–8 and ventricular ectopy.9 Abnormalities in these variables have been shown to be associated with cardiovascular events and mortality in general population. Coronary heart disease (CHD) continues to be the leading cause of mortality in North America and Europe,10 and accounts for more than half of the deaths. ETT provides a point estimate of cardiopulmonary fitness in the form of functional aerobic capacity (FAC), chronotrophic reserve, and heart rate recovery (HRR); all of which are affected by the level of physical activity in the last few months,3,7,11 and are associated with adverse outcome. There is no large body of data that has evaluated the effect of a combination of exercise parameters on mortality in a referral population who are at increased risk of cardiovascular events, after accounting for conventional cardiovascular risk factors and other variables provided by an ETT such as ST‐segment changes, blood pressure (BP) response, angina, and ventricular ectopy during exercise.
The purpose of this study was to examine the association of variables provided by an ETT in a referral population free of CHD and cancer, to determine the ability of these variables independently and in combination to predict all‐cause mortality, after adjusting for conventional cardiovascular risk factors.
Methods
Study Population
The study consisted of retrospective observation of 9030 individuals residing in Olmsted County, Minnesota who underwent ETT between 1993 and 2003 in our Exercise Testing Laboratory, Cardiovascular Health Clinic, Mayo Clinic, Rochester, MN. Study participants were referred by their employers, physicians, or were self‐referred. The patients with age of either <25 or >85 years (n=292), previous cardiovascular disease including coronary and peripheral vascular disease, significant valvular heart disease, congenital heart disease, previous heart procedure or surgery (n=2082), and malignancy (n=39) were excluded. We also excluded patients who did not undergo ETT using Bruce, Naughton or modified Naughton protocols (n=71). Thus, after exclusion of 2484 patients, the final sample comprised of 6546 patients. The study was reviewed and approved by the Institutional Review Boards of Mayo Clinic and Olmsted Medical Center, and all the patients gave written informed consent to be included in a study.
Risk Factor Measurement
Baseline characteristics of the study population were recorded on the day of ETT. This included their age, sex, smoking status, family history of CHD, resting heart rate, BP, body mass index (BMI), history of comorbid conditions, medication use, and electrocardiogram (ECG). These patients also had fasting plasma tests within 6 months of ETT day. The plasma samples were measured in Mayo Clinic Laboratory facility for total cholesterol (TC), high‐density lipoprotein cholesterol (HDL), low‐density lipoprotein cholesterol (LDL), triglycerides (TG), glucose (FPG), and hemoglobin A1C if a patient had suspicion or diagnosis of diabetes mellitus. Diabetes was considered present if they either had physician‐documented diagnosis of diabetes, were taking hypoglycemic medication/s, or hemoglobin A1C of ≥6.5%. Patients were considered current smokers if they have smoked in the last 30 days, and were considered past smokers if they were not a current smoker but have smoked ≥100 cigarettes in their lifetime.
Exercise Treadmill Test
Each patient underwent a symptom‐limited maximal exercise testing using Bruce, Naughton, or modified Naughton protocol. Patients were discouraged from holding on to the handrails, and the test was only stopped if the patient requested to stop due to exhaustion, or the physician stopped the test due to medical reasons. The physicians stopped the test either due to symptoms or positive high‐risk features, including a drop in systolic BP of >20 mm Hg with increasing workload, high‐risk ST‐changes, and sustained ventricular tachycardia. The parameters recorded during ETT were: symptoms, continuous heart rate and ECG, and every 3‐minute BP recordings. A standardized recovery protocol was followed. The patients were asked to be supine within 30 seconds of exercise. The patients were monitored during recovery for symptoms, vital signs, and ECG for the first 3 minutes if they were stable, or longer if any abnormalities were noted. Exercise duration was expressed in minutes and in percent of age‐ and gender‐predicted value. Cardiopulmonary fitness was measured in the form of FAC, which was calculated as actual exercise duration/predicted exercise time×100. Predicted exercise time was calculated depending on the treadmill protocol using previously published equations as following12–13: For Bruce protocol: for men: 16−0.11×age in years, for women: 13.3−0.1×age in years; for Naughton protocol: for men: (60−0.5×age in years)/1.75, for women: (55−0.5×age in years)/1.75; and for modified Naughton protocol: for men: 16.3−0.12×age in years, for women: 13−0.1×age in years. Heart rate recovery was calculated as peak heart rate−heart rate at 1 minute into recovery. It was considered abnormal if it was ≤12.7–8 Maximal heart rate was calculated as 220−age in years. Heart rate reserve was calculated as maximal heart rate−resting heart rate. Proportion of heart rate reserve used was then calculated as (peak heart rate−resting heart rate)/heart rate reserve×100. Chronotrophic incompetence was considered present if proportion of heart rate reserve used was <80% or <62% if patient is taking a beta‐blocker.4 ECG was diagnosed positive for ischemia based on standard criteria recommended by latest guidelines.14 In a patient with right‐bundle branch block, only V5 and V6 leads were analyzed. Blood pressure response was considered hypotensive if there was a drop in systolic BP below baseline with increasing workload.6,12
Mortality Ascertainment
All patients were followed through May 2008 for all‐cause mortality. Vital status for all patients were determined using Mayo Clinic registration database as previously described,15 death certificate database from State of Minnesota, and Accurint (an institutionally approved web‐based resource and location service). We excluded deaths within 60 days of follow‐up to minimize potential bias due to serious underlying illness on mortality.
Statistical Analysis
Descriptive statistics on baseline variables are presented as median (range), mean (standard deviation [SD]), or count (percentage) as appropriate. The influence of conventional risk factors and ETT parameters on mortality was evaluated with Cox proportional hazards (PH) regression. Of these hypothesized risk factors, each was individually tested in models adjusted for age and sex, and those with complete data were all carried forward into the final multivariable modeling. However, for the few lab parameters that had sizable amounts of missing data, only those showing evidence of an association with mortality (independent of age and sex) were selected for inclusion in multivariable analysis. To retain those subjects with these missing data, we used single imputation to fill in their values under the assumption this missing‐ness occurred at random. Data was mostly complete for all the potential risk factors of interest, except for 7 variables (resting diastolic and systolic blood pressure, glucose, triglycerides, and total, HDL and LDL cholesterol), which were each 20% to 30% missing. Based on the age and sex‐adjusted modeling results of these 7 parameters, 6 did not show any evidence of an association with mortality and thus were not carried forward into the multivariable modeling. For the one that did show some preliminary signal, serum glucose, we used a regression‐based imputation method (using diabetes status as the primary predictor) to fill in missing glucose values. This allowed us to include serum glucose in the multivariable model, along with all other study variables that had complete data, and thus retain the entire cohort in the analysis set. In addition, the functional form (eg, the adequacy of assuming a linear effect) of each continuous variable was evaluated via graphical impressions from a p‐spline plot, which uses a smoothing technique to estimate the mortality hazard function in relation to the range of values of the predictor. For the final multivariable model, the time‐dependent c statistic is reported to summarize the model's discriminative performance, with bootstrap resampling used to correct for optimism in this measure. In order to evaluate the incremental prognostic values from FAC and HRR, measures of model performance were compared between 2 nested models with and without the effects of FAC and HRR using the likelihood ratio test, c‐statistics, and integrative discrimination index (IDI). All analyses were carried out with the statistical software package SAS, version 9.1 (SAS Institute), except for the p‐spline plots which were performed in R, version 2.13.0 (R Development Core Team).
Results
The cohort consisted of 6546 subjects. Their baseline demographic, laboratory, and exercise test characteristics are described in Table 1. Baseline characteristics according to FAC levels are given in the Table 2.
Table 1.
Baseline Demographic and Clinical Characteristics, Anthropometric Measurements, Medication Use, Laboratory Values, and Responses to Exercise During Stress Test
| Characteristics | |
|---|---|
| Demographics/baseline characters | |
| Age | 49.3 (41.4, 58.6) |
| Males | 3807 (58%) |
| Ethnicity | |
| Caucasian | 5272 (81%) |
| Others/not reported | 1274 (19%) |
| Body mass index, kg/m2 | 28.1 (25.0, 32.0) |
| Waist/Hip ratio | 0.9 (0.8, 1.0) |
| Smoking | |
| Never | 3440 (53%) |
| Past | 2141 (33%) |
| Current | 958 (15%) |
| Family history of coronary disease | 3544 (54%) |
| Diabetes | 609 (9%) |
| Medications | |
| Hypertension therapy | 1565 (24%) |
| Lipid lowering therapy | 388 (6%) |
| Resting BP, mm Hg | |
| Diastolic BP | 80.0 (72.0, 88.0) |
| Systolic BP | 126.0 (114.0, 140.0) |
| Fasting blood tests, mg/dL | |
| Total cholesterol | 209.0 (183.0, 239.0) |
| HDL‐cholesterol | 46.0 (38.0, 56.0) |
| LDL‐cholesterol | 129.0 (106.0, 154.0) |
| Glucose | 97.0 (90.0, 106.0) |
| Triglycerides | 142.0 (101.0, 205.0) |
| Exercise test parameters | |
| Abnormal heart rate recovery at 1 minute | 1618 (25%) |
| Functional aerobic capacity, % | 84.2 (68.8, 98.7) |
| Premature ventricular beats | |
| None | 4519 (69%) |
| ≤5 /minute | 1527 (23%) |
| >5 /minute | 500 (8%) |
| Positive ST changes | 432 (7%) |
| Chronotrophic incompetence | 1578 (24%) |
| Blood pressure response | |
| Normal | 5885 (90%) |
| Hypotensive | 118 (2%) |
| Hypertensive | 543 (8%) |
| Chest pain | |
| Absent | 6059 (93%) |
| Atypical chest pain | 325 (5%) |
| Typical angina | 162 (2%) |
| Test protocol | |
| Bruce | 5611 (86%) |
| Modified Bruce | 780 (12%) |
| Naughton | 103 (2%) |
| Modified Naughton | 43 (1%) |
BP indicates blood pressure; HDL, high‐density lipoprotein; LDL, low‐density lipoprotein.
Table 2.
Baseline Characteristics According to the Level of FAC
| Variable | FAC <80% (n=2763) | FAC >80% (n=3760) | P Value |
|---|---|---|---|
| Demographics/baseline characters | |||
| Age | 49.9 (40.6, 60.7) | 49.0 (41.8, 57.3) | 0.006 |
| Males | 1518 (55%) | 2276 (61%) | <0.001 |
| Ethnicity | 0.002 | ||
| Caucasian | 2274 (82%) | 2979 (79%) | |
| Others/not reported | 489 (18%) | 781 (21%) | |
| Body mass index (kg/m2) | 30.4 (26.7, 35.5) | 26.7 (24.3, 29.9) | <0.001 |
| Waist/Hip ratio | 0.9 (0.8, 1.0) | 0.9 (0.8, 0.9) | <0.001 |
| Smoking | <0.001 | ||
| Never | 1256 (46%) | 2175 (58%) | |
| Past | 965 (35%) | 1167 (31%) | |
| Current | 539 (20%) | 415 (11%) | |
| Family history of coronary disease | 1448 (52%) | 2091 (56%) | 0.010 |
| Diabetes | 401 (15%) | 205 (5%) | <0.001 |
| Medications | |||
| Lipid lowering therapy | 178 (6%) | 210 (6%) | 0.148 |
| Hypertension therapy | 846 (31%) | 711 (19%) | <0.001 |
| Resting BP | |||
| Resting diastolic BP | 80.0 (72.0, 88.0) | 80.0 (72.0, 88.0) | 0.303 |
| Resting systolic BP | 126.0 (114.0, 140.0) | 126.0 (114.0, 140.0) | 0.910 |
| Fasting blood tests, mg/dL | |||
| Total cholesterol | 210.0 (183.0, 239.0) | 208.0 (183.0, 238.0) | 0.266 |
| HDL‐cholesterol | 44.0 (37.0, 53.0) | 48.0 (40.0, 58.0) | <0.001 |
| LDL‐cholesterol | 127.0 (104.0, 153.0) | 130.0 (106.0, 154.0) | 0.107 |
| Glucose | 99.0 (92.0, 112.0) | 95.0 (89.0, 102.0) | <0.001 |
| Triglycerides | 159.5 (114.0, 227.0) | 129.0 (92.0, 188.0) | <0.001 |
| Exercise test parameters | |||
| Abnormal heart rate recovery at 1 minute (<12/min) | 999 (36%) | 612 (16%) | <0.001 |
| Chronotrophic incompetence | 1136 (41%) | 434 (12%) | <0.001 |
| Premature ventricular beats | <0.001 | ||
| None | 1973 (71%) | 2527 (67%) | |
| ≤5 /minute | 576 (21%) | 948 (25%) | |
| >5 /minute | 214 (8%) | 285 (8%) | |
| Positive ST changes | 184 (7%) | 247 (7%) | 0.885 |
| Blood pressure response | <0.001 | ||
| Normal | 2404 (87%) | 3460 (92%) | |
| Hypotensive | 57 (2%) | 61 (2%) | |
| Hypertensive | 302 (11%) | 239 (6%) | |
| Chest pain | <0.001 | ||
| Absent | 2508 (91%) | 3529 (94%) | |
| Atypical chest pain | 145 (5%) | 180 (5%) | |
| Typical angina | 110 (4%) | 51 (1%) |
BP indicates blood pressure; FAC, functional aerobic capacity; HDL, high‐density lipoprotein; LDL, low‐density lipoprotein.
During a mean follow‐up of 8.1±3.7 years, a total of 285 patients died, corresponding to a 10‐year cumulative incidence of 5.1%. Out of 285 deaths, 106 were due to cardiovascular causes. Controlling for risk factors age and sex, variables that were significantly associated with increased rates of mortality were: current or past smoking, diabetes, typical angina during exercise, chronotropic incompetence, reduced HRR, and lower FAC. A full multivariable model identified the following as statistically significant, independent risk factors of mortality: increasing age, male gender, smoking, BMI (increasing BMI levels up to <40 corresponded to decreased risk of mortality, while increasing levels for BMI ≥40 were marginally associated with increased risk), and decreasing levels of FAC (per 10% decrease, for the range of values <100%: HR=1.21; 95% CI, 1.13 to 1.29; P<0.001) and HRR (per 1 beat decrease, for the range of values <25 beats: HR=1.05; 95% CI, 1.03 to 1.07; P<0.001) (Table 3). To estimate the optimism bias from the model selection process and then compute a bias‐corrected c‐statistic, we tested each bootstrap‐selected model on the original data and measured its performance. Bias was estimated as the average difference in concordance [c]‐statistic values between the bootstrap model and the test model, which was then subtracted from the “apparent” (ie, model c‐statistic from original data) to obtain a bias‐corrected c‐statistic. We noted a high c‐statistic of 0.835 reflecting high predictive accuracy of the original multivariable model, with a bias‐corrected c‐statistic of 0.824 indicating very little optimism bias in the original model fitting. A C‐statistic of >0.8 is considered to represent excellent discriminative ability.16
Table 3.
Cox‐Proportional‐Hazard Analysis for Association of Variables With All‐Cause Mortality in Univariate and Multivariable Models
| Variable | Univariate (Unadjusted) Model Results | Age‐ and Sex‐Adjusted Model Results | Full Multivariable Model Results* |
|---|---|---|---|
| Male gender | 1.06 (0.83, 1.34) [0.639] | 1.53 (1.20, 1.94) [<0.001] | 1.39 (1.08, 1.80) [0.011] |
| Age (per 10 year increase) | 2.42 (2.20, 2.67) [<0.001] | 2.50 (2.27, 2.76) [<0.001] | 1.97 (1.75, 2.21) [<0.001] |
| Ischemic ST changes | 1.83 (1.28, 2.61) [<0.001] | 1.12 (0.79, 1.61) [0.522] | 1.04 (0.71, 1.53) [0.825] |
| Chronotrophic incompetence | 2.50 (1.98, 3.16) [<0.001] | 1.74 (1.37, 2.22) [<0.001] | 1.09 (0.84, 1.42) [0.520] |
| FAC* (per 10% increase) | 0.73 (0.70, 0.78) [<0.001] | 0.79 (0.75, 0.84) [<0.001] | 0.83 (0.78, 0.88) [<0.001] |
| BMI (per 1 kg/m2 increase) | |||
| Among those BMI<40 | 0.96 (0.93, 0.98) [0.002] | 0.98 (0.95, 1.01) [0.115] | 0.94 (0.92, 0.97) [<0.001] |
| Among those BMI ≥40 | 1.02 (0.92, 1.12) [0.732] | 1.09 (0.98, 1.20) [0.114] | 1.12 (0.99, 1.27) [0.082] |
| Smoking past/current | 2.02 (1.59, 2.58) [<0.001] | 1.79 (1.40, 2.30) [<0.001] | 1.61 (1.25, 2.07) [<0.001] |
| Diabetes | 2.10 (1.53, 2.88) [<0.001] | 1.59 (1.16, 2.19) [0.004] | 1.41 (0.89, 2.24) [0.147] |
| Total cholesterol (per 20 unit increase) | 0.97 (0.91, 1.03) [0.317] | 0.96 (0.90, 1.02) [0.223] | — |
| HDL (per 10 unit decrease) | 1.06 (0.97, 1.17) [0.178] | 1.00 (0.90, 1.10) [0.930] | — |
| LDL (per 20 unit increase) | 0.98 (0.91, 1.06) [0.680] | 0.98 (0.91, 1.06) [0.637] | — |
| Glucose (per 1 unit increase) | 1.00 (1.00, 1.01) [0.006] | 1.00 (1.00, 1.01) [0.081] | 1.00 (0.99, 1.00) [0.540] |
| Triglycerides | 1.00 (1.00, 1.00) [0.722] | 1.00 (1.00, 1.00) [0.520] | — |
| Family history of coronary disease | 0.70 (0.55, 0.88) [0.003] | 0.91 (0.72, 1.15) [0.439] | 0.95 (0.75, 1.20) [0.660] |
| Hypertension therapy | 2.18 (1.71, 2.79) [<0.001] | 1.17 (0.90, 1.51) [0.232] | 1.06 (0.81, 1.38) [0.679] |
| Lipid lowering therapy | 1.15 (0.70, 1.88) [0.574] | 0.71 (0.43, 1.16) [0.176] | 0.73 (0.44, 1.22) [0.229] |
| Hypotensive BP response | 1.05 (0.44, 2.55) [0.908] | 0.99 (0.41, 2.41) [0.990] | 0.79 (0.32, 1.94) [0.605] |
| Typical angina during exercise | 3.39 (2.15, 5.35) [<0.001] | 1.77 (1.12, 2.80) [0.015] | 1.52 (0.93, 2.48) [0.098] |
| Resting systolic BP | 1.00 (1.00, 1.01) [0.543] | 1.00 (0.99, 1.01) [0.821] | 1.00 (0.99, 1.00) [0.512] |
| Resting diastolic BP | 1.01 (1.00, 1.02) [0.204] | 1.01 (1.00, 1.02) [0.143] | 1.01 (1.00, 1.02) [0.130] |
| HR recovery* (per 1 beat increase) | 0.89 (0.88, 0.91) [<0.001] | 0.94 (0.92, 0.95) [<0.001] | 0.95 (0.94, 0.97) [<0.001] |
| Premature atrial beats | |||
| None | 1.0 (ref) [F test P<0.001] | 1.0 (ref) [F test P=0.461] | 1.0 (ref) [F test P=0.469] |
| <5 | 1.77 (1.37, 2.29) | 1.09 (0.84, 1.41) | 1.18 (0.91, 1.53) |
| >5 | 3.59 (2.30, 5.61) | 1.31 (0.83, 2.07) | 1.08 (0.68, 1.72) |
| Premature ventricular beats | |||
| None | 1.0 (ref) [F test P<0.001] | 1.0 (ref) [F test P=0.088] | 1.0 (ref) [F test P=0.062] |
| <5 | 1.47 (1.13, 1.92) | 1.06 (0.81, 1.39) | 1.20 (0.91, 1.57) |
| >5 | 2.64 (1.86, 3.73) | 1.48 (1.04, 2.11) | 1.51 (1.00, 2.15) |
BMI indicates body mass index; BP, blood pressure; FAC, functional aerobic capacity; HDL, high‐density lipoprotein; HR, heart rate; HRR, heart rate recovery; LDL, low‐density lipoprotein.
Multivariable model had an apparent c‐statistic of 0.835 and a bias‐corrected c‐statistic of 0.824.
FAC: upper cap for FAC set at 100% to satisfy the assumption of linearity; reported risk only applies to those with FAC values <100%.
HRR: lower and upper caps for HRR set at 0 and 25 beats to satisfy the assumption of linearity; reported risk only applies to those with an HRR between 0 to 25 beats.
The values in parentheses indicate confidence interval, and the value in the bracket indicate P‐value.
To visually assess calibration, which is the model's ability to predict accurately the absolute level of risk that is subsequently observed, we plotted deciles of predicted 5‐year survival from the Cox model by the empirical rates of surviving at least 5 years obtained from Kaplan‐Meier. Note that in the Figure 1, predicted survival was captured both from the apparent model and the bootstrap (bias‐corrected) model. For a reference of perfect calibration, the Y=X line is displayed.
Figure 1.
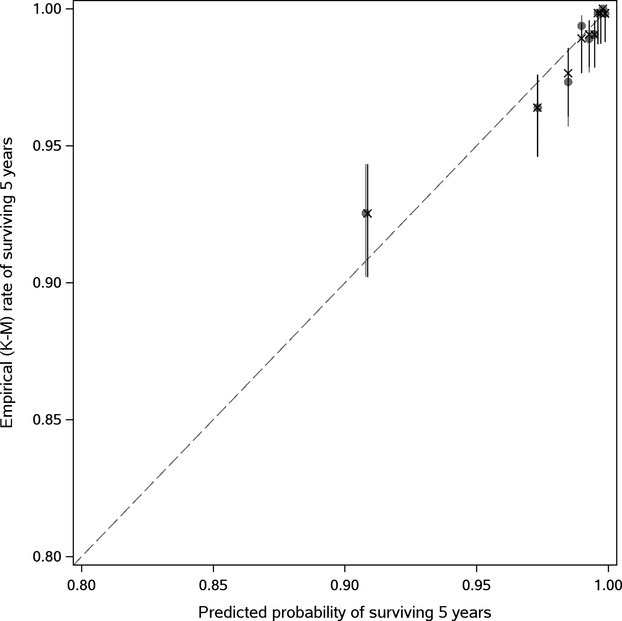
Model calibration plots (based on observed vs predicted survival at 5 years; X=resampling optimism added). K‐M indicates Kaplan‐Meier rates.
From a sensitivity analysis of the final multivariable model re‐fit with the continuous scales of FAC and HRR dichotomized at clinically useful cut‐points (ie, FAC at <80% and HRR and ≤12 at 1 minute), both variables retained highly significant associations with mortality independent of the other factors in the model (FAC <80%: HR=1.88; 95% CI, 1.42 to 2.47; P<0.001; and HRR ≤12: HR=2.13; 95% CI, 1.63 to 2.76, P<0.001). The Kaplan‐Meier survival curves in Figure 2 help visualize this comparison of rates over time between subjects with below average FAC (<80%) versus above average FAC (≥80%), and subjects with abnormal HRR (≤12 beats at 1 minute) versus normal. Also, according to the combinations of these FAC and HRR groupings, patients who had above‐average FAC and normal HRR had high rates of survival, whereas patients with low FAC and abnormal HRR demonstrated noticeably poorer survival (Figure 3), particularly after about 5 years of follow‐up. In a separate analysis, no significant interaction was noted between FAC and HRR in relation to mortality.
Figure 2.
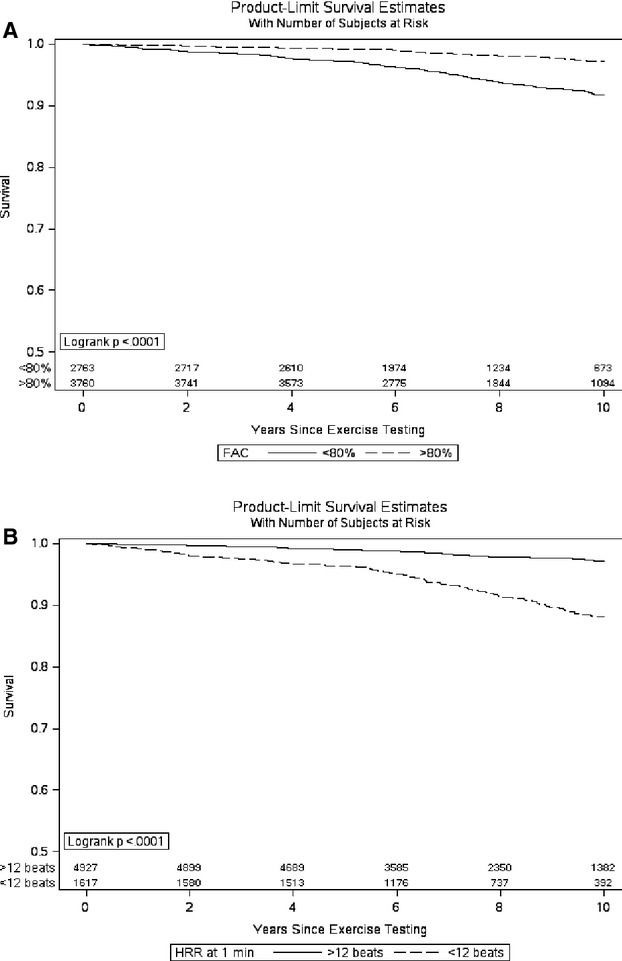
Kaplan‐Meier survival curves after dichotomizing (A) functional aerobic capacity (FAC) at 80% (<80%: below average, ≥80%: average or above average) and (B) heart rate recovery (HRR) at 12 beats (≤12: abnormal, >12: normal).
Figure 3.
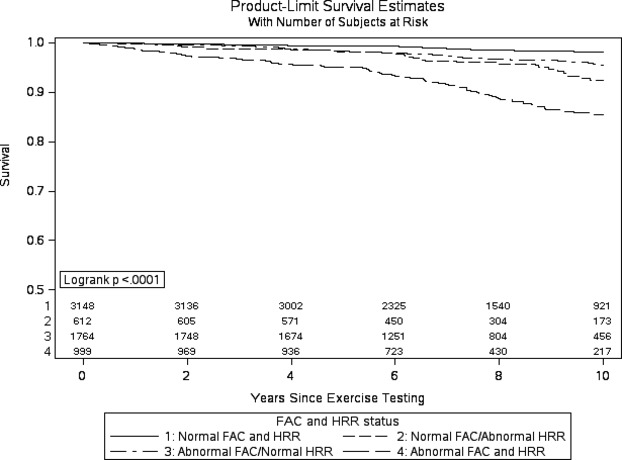
Survival as a function of fitness level and heart rate recovery (functional aerobic capacity [FAC] and HRR categorized at 80% and 12 beats, respectively).
In terms of whether those 2 parameters contribute prognostic importance beyond all the other predictor variables in the model, measures of performance were compared between 2 nested models with and without the effects of FAC and HRR. In particular, a likelihood ratio test demonstrated their combined effect (using a 2 degree of freedom test) was significant, as is the improvement in model c‐statistic (from 0.806 to 0.835) with the addition of FAC and HRR to the multivariable model. Furthermore, IDI was assessed to demonstrate how far on average individuals were moving (in an appropriate direction) along the continuum of predicted risk between these 2 models. An aggregate measure of IDI, estimated as the equally weighted sum of improvement in predicted risk between subjects who were censored and those who died, showed an average improvement in prediction of 0.71% (±0.36%) in the models with FAC and HRR (P=0.046 from a one‐sample t test).
Discussion
In this large referral cohort of consecutive patients from Olmsted County undergoing ETT, we examined conventional cardiovascular risk factors and ETT parameters, and their ability to predict all‐cause mortality. Poor exercise tolerance in the form of FAC and abnormal HRR were independent predictors of death after adjusting for conventional cardiovascular risk factors during approximately 10 years follow‐up period. The multivariable model used both these parameters as continuous variables and found a linear relationship with the mortality, ie, the risk of death increased for every 10% decrease in FAC below 100%, and for every one beat decrease in HRR below 25 at 1 minute. Expressed as groups using single cut‐points, the categories of low exercise tolerance (indicated by FAC <80%) and severely abnormal heart rate recovery (of ≤12 beats at 1 minute) were also highly associated with increased risk of mortality. It should be noted that blood pressure, glucose, and lipids were appropriately controlled in most patients as indicated in Table 1. Almost all of these patients were evaluated by an internist or a cardiologist prior to their ETT, and were appropriately managed and counseled according to the current guidelines, which is reflected in their baseline clinical and laboratory characteristics.
We had almost complete data for all the potential risk factors of interest, except for laboratory variables which were each 20% to 30% missing. Among these, only serum glucose showed some preliminary signal and was therefore retained in the multivariable analysis. A regression‐based method of single imputation was used to fill in missing glucose values, thereby allowing nearly the entire cohort to be included in the final multivariable model. We used death as an end‐point, because it is a robust and clinically most relevant outcome. The methods used for ascertainment for deaths were vigorous, and provided follow‐up for all the patients through 2008.
Although exercise capacity expressed in terms of metabolic equivalents is the common clinical measure of exercise tolerance, exercise capacity is strongly influenced by age and gender. Hence we used FAC as a measure of exercise capacity in our study. FAC is an excellent objective measure of total activity in recent months.2,7 Low FAC reflects low cardiopulmonary fitness, and is a very strong known predictor of mortality and CV events,3,17–18 even after accounting for Framingham19 risk score. Sustaining or improving fitness level is associated with a lower risk of all‐cause and CV mortality.20 Our findings indicate that poor exercise tolerance provides important additional prognostic information, and confirms previous findings derived from community cohorts and health surveys,17–19,17–23 and extends them by demonstrating an independent relationship between the level of cardiopulmonary fitness and death in referred patients at risk for CHD. Heart rate recovery refers to the inability of heart rate to appropriately decrease after exercise, and indicates autonomic imbalance and low fitness level, and has been shown to be associated with mortality and coronary disease, even after adjusting for conventional cardiovascular risk factors.7,18,21 The precise mechanism is unknown, but an abnormal dynamic interaction between sympathetic and parasympathetic systems is thought to be one of the etiologies.
There are multiple long‐term studies in the literature that are conducted on a relatively healthy population, such as community‐derived cohorts24–25 and health surveys.26 Our study focuses on a clinically more relevant population, ie, patients referred for exercise testing mostly by a physician for clinical indications. The reasons for referral in our cohort were several including, but not limited to dyslipidemia, family history of CHD, and nonspecific symptoms such as chest pain or dyspnea. There are very few studies in the literature that has looked at such a group.23 In our cohort, less than half of the deaths were from cardiovascular causes. On further analysis, only exercise test variable associated with cardiovascular deaths was FAC.
There have been a few studies attempting to examine the relationship of combination of various exercise test parameters with the mortality.18,27–28 The “Cooper Center Longitudinal Study” showed that the increasing number of abnormal exercise parameters was associated with increased all‐cause and cardiovascular mortality, and that those having ≥3 abnormal exercise parameters had a 5‐fold increased risk of all‐cause mortality when compared with those without any exercise test abnormalities.18 In a study of male veterans, a combination of chronotropic incompetence and an abnormal HR recovery strongly predicted cardiovascular mortality.28 In a previous study from Olmsted County, a graded increase in mortality was reported as individuals exhibited multiple abnormal characteristics such as ST changes, chronotropic incompetence, and/or poor exercise capacity.27 The current study concurs and adds to the limited number of studies that have examined the effects of multiple exercise parameters in combination on mortality. We found that the lower cardiopulmonary fitness, and abnormal heart rate recovery were each independently associated with adverse CV outcome, and that the combination of these 2 abnormalities were additive in nature.
Limitations
This study is limited by several factors, including the observational nature of our data. The cohort consisted of referral sample, and may be limited by potential selection bias. We also had some missing data, but it was accounted for by using a regression‐based method of single imputation. The population of Olmsted County is primarily Caucasian,29 and the findings may not apply to the other ethnic groups. The characteristics of our cohort are similar to those of non‐Hispanic whites in the United States overall, except that a higher proportion of the residents are employed in the health‐care sector.29 It is beyond the scope of our study to determine whether altering physical fitness and heart rate recovery will improve survival.
Conclusion
In conclusion, exercise test provides useful prognostic information in a referred, relatively healthy population. Our findings add to the growing body of evidence that the lower cardiopulmonary fitness and abnormal heart rate recovery are associated with premature deaths. The effects of FAC and HRR are additive, meaning that risk of mortality is increased with impairment in either one and increased further with impairments in both. These results underscore the importance of exercise training in people at risk of coronary disease, in addition to addressing conventional cardiovascular risk factors.
Sources of Funding
This project was supported by Division of Cardiovascular Diseases, Mayo Clinic, Rochester, MN.
Disclosures
None.
Acknowledgments
Authors would like to acknowledge Laurie Barr for her significant efforts in data collection.
References
- 1.Kligfield P, Lauer MS. Exercise electrocardiogram testing: beyond the ST segment. Circulation. 2006; 114:2070-2082 [DOI] [PubMed] [Google Scholar]
- 2.Lauer M, Froelicher ES, Williams M, Kligfield P. Exercise testing in asymptomatic adults: a statement for professionals from the American Heart Association Council on Clinical Cardiology, Subcommittee on Exercise, Cardiac Rehabilitation, and Prevention. Circulation. 2005; 112:771-776 [DOI] [PubMed] [Google Scholar]
- 3.Kodama S, Saito K, Tanaka S, Maki M, Yachi Y, Asumi M, Sugawara A, Totsuka K, Shimano H, Ohashi Y, Yamada N, Sone H. Cardiorespiratory fitness as a quantitative predictor of all‐cause mortality and cardiovascular events in healthy men and women: a meta‐analysis. JAMA. 2009; 301:2024-2035 [DOI] [PubMed] [Google Scholar]
- 4.Lauer MS, Francis GS, Okin PM, Pashkow FJ, Snader CE, Marwick TH. Impaired chronotropic response to exercise stress testing as a predictor of mortality. JAMA. 1999; 281:524-529 [DOI] [PubMed] [Google Scholar]
- 5.Lauer MS, Pashkow FJ, Larson MG, Levy D. Association of cigarette smoking with chronotropic incompetence and prognosis in the Framingham heart study. Circulation. 1997; 96:897-903 [DOI] [PubMed] [Google Scholar]
- 6.de Liefde, Hoeks SE, van Gestel YR, Klein J, Verhagen HJ, van Domburg RT, Poldermans D. Prognostic value of hypotensive blood pressure response during single‐stage exercise test on long‐term outcome in patients with known or suspected peripheral arterial disease. Coron Artery Dis. 2008; 19:603-607 [DOI] [PubMed] [Google Scholar]
- 7.Nishime EO, Cole CR, Blackstone EH, Pashkow FJ, Lauer MS. Heart rate recovery and treadmill exercise score as predictors of mortality in patients referred for exercise ECG. JAMA. 2000; 284:1392-1398 [DOI] [PubMed] [Google Scholar]
- 8.Aktas MK, Ozduran V, Pothier CE, Lang R, Lauer MS. Global risk scores and exercise testing for predicting all‐cause mortality in a preventive medicine program. JAMA. 2004; 292:1462-1468 [DOI] [PubMed] [Google Scholar]
- 9.Frolkis JP, Pothier CE, Blackstone EH, Lauer MS. Frequent ventricular ectopy after exercise as a predictor of death. N Engl J Med. 2003; 348:781-790 [DOI] [PubMed] [Google Scholar]
- 10.Capewell S, Ford ES, Croft JB, Critchley JA, Greenlund KJ, Labarthe DR. Cardiovascular risk factor trends and potential for reducing coronary heart disease mortality in the United States of America. Bull World Health Organ. 2010; 88:120-130 [DOI] [PMC free article] [PubMed] [Google Scholar]
- 11.Lauer MS, Okin PM, Larson MG, Evans JC, Levy D. Impaired heart rate response to graded exercise. Prognostic implications of chronotropic incompetence in the Framingham heart study. Circulation. 1996; 93:1520-1526 [DOI] [PubMed] [Google Scholar]
- 12.Daida H, Allison TG, Squires RW, Miller TD, Gau GT. Peak exercise blood pressure stratified by age and gender in apparently healthy subjects. Mayo Clin Proc. 1996; 71:445-452 [DOI] [PubMed] [Google Scholar]
- 13.Bruce RA, Kusumi F, Hosmer D. Maximal oxygen intake and nomographic assessment of functional aerobic impairment in cardiovascular disease. Am Heart J. 1973; 85:546-562 [DOI] [PubMed] [Google Scholar]
- 14.Gibbons RJ, Balady GJ, Bricker JT, Chaitman BR, Fletcher GF, Froelicher VF, Mark DB, McCallister BD, Mooss AN, O'Reilly MG, Winters WL, Jr, Gibbons RJ, Antman EM, Alpert JS, Faxon DP, Fuster V, Gregoratos G, Hiratzka LF, Jacobs AK, Russell RO, Smith SC., Jr ACC/AHA 2002 guideline update for exercise testing: summary article: a report of the American College of Cardiology/American Heart Association task force on practice guidelines (committee to update the 1997 exercise testing guidelines). Circulation. 2002; 106:1883-1892 [DOI] [PubMed] [Google Scholar]
- 15.Roger VL, Weston SA, Redfield MM, Hellermann‐Homan JP, Killian J, Yawn BP, Jacobsen SJ. Trends in heart failure incidence and survival in a community‐based population. JAMA. 2004; 292:344-350 [DOI] [PubMed] [Google Scholar]
- 16.Lloyd‐Jones DM. Cardiovascular risk prediction: basic concepts, current status, and future directions. Circulation. 2010; 121:1768-1777 [DOI] [PubMed] [Google Scholar]
- 17.Bijnen FC, Feskens EJ, Caspersen CJ, Nagelkerke N, Mosterd WL, Kromhout D. Baseline and previous physical activity in relation to mortality in elderly men: the Zutphen elderly study. Am J Epidemiol. 1999; 150:1289-1296 [DOI] [PubMed] [Google Scholar]
- 18.Ho JS, Fitzgerald SJ, Barlow CE, Cannaday JJ, Kohl HW, III, Haskell WL, Cooper KH. Risk of mortality increases with increasing number of abnormal non‐ST parameters recorded during exercise testing. Eur J Cardiovasc Prev Rehabil. 2010; 17:462-468 [DOI] [PubMed] [Google Scholar]
- 19.Balady GJ, Larson MG, Vasan RS, Leip EP, O'Donnell CJ, Levy D. Usefulness of exercise testing in the prediction of coronary disease risk among asymptomatic persons as a function of the Framingham risk score. Circulation. 2004; 110:1920-1925 [DOI] [PubMed] [Google Scholar]
- 20.Lee DC, Sui X, Artero EG, Lee IM, Church TS, McAuley PA, Stanford FC, Kohl HW, III, Blair SN. Long‐term effects of changes in cardiorespiratory fitness and body mass index on all‐cause and cardiovascular disease mortality in men: the aerobics center longitudinal study. Circulation. 2011; 124:2483-2490 [DOI] [PMC free article] [PubMed] [Google Scholar]
- 21.Chen MS, Blackstone EH, Pothier CE, Lauer MS. Heart rate recovery and impact of myocardial revascularization on long‐term mortality. Circulation. 2004; 110:2851-2857 [DOI] [PubMed] [Google Scholar]
- 22.Mora S, Redberg RF, Cui Y, Whiteman MK, Flaws JA, Sharrett AR, Blumenthal RS. Ability of exercise testing to predict cardiovascular and all‐cause death in asymptomatic women: a 20‐year follow‐up of the lipid research clinics prevalence study. JAMA. 2003; 290:1600-1607 [DOI] [PubMed] [Google Scholar]
- 23.Myers J, Prakash M, Froelicher V, Do D, Partington S, Atwood JE. Exercise capacity and mortality among men referred for exercise testing. N Engl J Med. 2002; 346:793-801 [DOI] [PubMed] [Google Scholar]
- 24.Blair SN, Kohl HW, III, Barlow CE, Paffenbarger RS, Jr, Gibbons LW, Macera CA. Changes in physical fitness and all‐cause mortality. A prospective study of healthy and unhealthy men. JAMA. 1995; 273:1093-1098 [PubMed] [Google Scholar]
- 25.Gregg EW, Cauley JA, Stone K, Thompson TJ, Bauer DC, Cummings SR, Ensrud KE. Relationship of changes in physical activity and mortality among older women. JAMA. 2003; 289:2379-2386 [DOI] [PubMed] [Google Scholar]
- 26.Lissner L, Bengtsson C, Bjorkelund C, Wedel H. Physical activity levels and changes in relation to longevity. A prospective study of Swedish women. Am J Epidemiol. 1996; 143:54-62 [DOI] [PubMed] [Google Scholar]
- 27.Aijaz B, Babuin L, Squires RW, Kopecky SL, Johnson BD, Thomas RJ, Allison TG. Long‐term mortality with multiple treadmill exercise test abnormalities: comparison between patients with and without cardiovascular disease. Am Heart J. 2008; 156:783-789 [DOI] [PubMed] [Google Scholar]
- 28.Myers J, Tan SY, Abella J, Aleti V, Froelicher VF. Comparison of the chronotropic response to exercise and heart rate recovery in predicting cardiovascular mortality. Eur J Cardiovasc Prev Rehabil. 2007; 14:215-221 [DOI] [PubMed] [Google Scholar]
- 29.Melton LJ., III History of the Rochester epidemiology project. Mayo Clin Proc. 1996; 71:266-274 [DOI] [PubMed] [Google Scholar]