

Abstract
Background
Nuclear factor of activated T‐cells 5 (NFAT5) has recently been described to control the phenotype of vascular smooth muscle cells (VSMCs). Although an increase in wall stress or stretch (eg, elicited by hypertension) is a prototypic determinant of VSMC activation, the impact of this biomechanical force on the activity of NFAT5 is unknown. This study intended to reveal the function of NFAT5 and to explore potential signal transduction pathways leading to its activation in stretch‐stimulated VSMCs.
Methods and Results
Human arterial VSMCs were exposed to biomechanical stretch and subjected to immunofluorescence and protein‐biochemical analyses. Stretch promoted the translocation of NFAT5 to the nucleus within 24 hours. While the protein abundance of NFAT5 was regulated through activation of c‐Jun N‐terminal kinase under these conditions, its translocation required prior activation of palmitoyltransferases. DNA microarray and ChiP analyses identified the matrix molecule tenascin‐C as a prominent transcriptional target of NFAT5 under these conditions that stimulates migration of VSMCs. Analyses of isolated mouse femoral arteries exposed to hypertensive perfusion conditions verified that NFAT5 translocation to the nucleus is followed by an increase in tenascin‐C abundance in the vessel wall.
Conclusions
Collectively, our data suggest that biomechanical stretch is sufficient to activate NFAT5 both in native and cultured VSMCs where it regulates the expression of tenascin‐C. This may contribute to an improved migratory activity of VSMCs and thus promote maladaptive vascular remodeling processes such as hypertension‐induced arterial stiffening.
Keywords: hypertension, NFAT5, tenascin‐C, vascular smooth muscle cells, wall stress
Introduction
Phenotypic adaptation of cells is a prerequisite to comply with microenvironmental changes triggered by physiological or pathophysiological factors that may drive the growth of a specific tissue or result in its dysfunction. The vascular system is continuously exposed to a highly variable environment as the biomechanical load defined by blood flow and pressure is steadily altered by lifestyle, age, and physical activity. To tightly regulate these pivotal hemodynamic parameters, vascular smooth muscle cells (VSMCs) located in the media of the arterial vessel wall are able to rapidly respond to subtle changes in blood pressure/flow by contraction or relaxation. Despite this ability, VSMCs are also capable to permanently rearrange the local architecture of the vessel wall in response to chronic changes in blood pressure and/or flow. In this context, it is well documented that hypertension induces arterial remodeling by stimulating the migration and proliferation of VSMCs located in the media,1–2 which subsequently leads to media hypertrophy and/or hyperplasia.2–3 By definition, hypertension is characterized by a chronic increase in mean arterial blood pressure that elicits an increase in wall stress—a biomechanical force with major impact on the VSMC phenotype4–6—and thus a rise in the level of stretch to which these cells are exposed. Prolonged exposure to supra‐physiological levels of transmural pressure or stretch elicits VSMC hypertrophy and/or hyperplasia7–8 that both require a phenotype change by these cells. As a consequence, VSMCs migrate and proliferate as well as degrade or synthesize components of the extracellular matrix9–10—a phenotype referred to as “synthetic”.
This shift in VSMC phenotype is orchestrated by the activity of transcription factors controlling the expression of genes promoting the contractile or synthetic state of these cells. For instance, the transcription factor activator protein‐1 (AP‐1) controls their stretch‐induced activation by regulating the expression of many stress response genes, including those associated with a pro‐inflammatory state.11–13 In contrast, the coactivator myocardin regulates the expression of genes encoding cytoskeletal and contractile proteins in VSMCs such as SM‐α‐actin or calponin through interaction with serum response factor (SRF).14–16 Recently, nuclear factor of activated T‐cells 5 (NFAT5 or tonicity enhancer binding protein)—a member of the Rel family of transcription factors—was characterized to affect the VSMC phenotype.17 Originally described as a hypertonicity‐responsive transcription factor that orchestrates cellular homeostasis,18 NFAT5 has meanwhile been implicated in regulating the expression of genes associated with migration and proliferation of cells.19–21 With respect to its function in VSMCs, it has been suggested that NFAT5 regulates the expression of smooth muscle differentiation markers such as SM‐α‐actin depending on the microenvironmental context.17 Moreover, with angiotensin II and platelet‐derived growth factor BB (PDGF‐BB) 2 humoral factors were described that coevally affect the activity and expression of NFAT5 as well as the phenotype of VSMCs.17 As an increase in wall stress or stretch is another well‐known determinant of the VSMC phenotype, we assumed that this biomechanical force affects the activity of NFAT5—a hypothesis that tackles emerging questions in this field of research.22 We further reasoned that under hypertensive conditions NFAT5 may alter the expression of genes that affect the phenotype of VSMCs. Therefore, we have investigated the abundance, localization, and activity of NFAT5 in human arterial VSMCs exposed to biomechanical stretch and in mouse arteries exposed to hypertensive perfusion conditions.
Material and Methods
Cell Culture
Human arterial smooth muscle cells (HUASMCs) were freshly isolated from individual umbilical cords and grown on collagen I‐bonded BioFlex® plates (Flexcell International) with DMEM medium containing 15% FCS, 50 U/mL penicillin, 50 μg/mL streptomycin and fungizone (Invitrogen). The isolation of HUASMCs was approved by the local Ethics Committee (Heidelberg, Germany; reference 336/2005) and conformed to the principles outlined in the Declaration of Helsinki (1997). Biomechanical stretch was typically applied at a frequency of 0.5 Hz and an elongation of 0% to 13% for 24 hours by using a Flexercell FX‐5000 tension system. In addition, cells were exposed to the following reagents: 20 μmol/L SP600125 (SABioscience), 50 μmol/L PD98059 (Biomol), 20 μmol/L SB202190 (Biomol), 13 μmol/L palmostatin B (Merck), and 100 μmol/L 2‐bromopalmitate (Sigma Aldrich). All compounds were dissolved in DMSO. Pure DMSO (0.1%, v/v) was simultaneously applied to the control cells as solvent control. After stretching, the cells were subjected to immunofluorescence analysis.
Perfusion of Isolated Mouse Arteries
All animal experiments were performed with permission from the Regional Council Karlsruhe and conformed to the Guide for the Care and Use of Laboratory Animals published by the US National Institutes of Health (NIH Publication no. 85‐23, revised 1996). Animals were sacrificed by cervical dislocation; the femoral arteries were excised, trimmed of excess adipose tissue, and inserted into the chamber of a myograph (Culture Myograph, DMT). The chambers were placed in an incubator at 37°C and 5% CO2, and the arteries were perfused by applying a constant axial pressure difference (∆P) of 20 mm Hg for up to 24 hours with DMEM medium (Invitrogen) containing 15% FCS. Hypertensive perfusion conditions were mimicked by increasing the mean transmural pressure gradient (∆Ptm) from 60 mm Hg (control conditions) to 110 mm Hg (hypertensive conditions).
Immunocytochemistry
Cells were fixed in ice‐cold methanol for 15 minutes and allowed to dry for 20 minutes. Rehydrated cells were blocked with 0.25% casein and 0.1% BSA for 30 minutes. Cells were incubated with rabbit anti‐NFAT5 antibody 1:100 (Abcam, Cambridge, UK; detects NFAT5 isoforms a to d) at 4°C overnight. After washing, cells were incubated with donkey anti‐rabbit‐Cy3 1:100 (Dianova) for 1 hour and mounted with Mowiol (Calbiochem). Nuclei were visualized by counterstaining the cells with DAPI (Invitrogen). Fluorescence intensity was recorded using an Olympus IX81 confocal microscope (Olympus). Quantitative image analyses were performed using the Olympus Xcellence software.
Immunohistochemistry
Mouse femoral arteries were fixed in 4% paraformaldehyde, dehydrated, and embedded in paraffin. Antigens were retrieved by incubating 5‐μm thick rehydrated tissue sections with citrate buffer (pH 6.0) at 100°C for 15 minutes. The sections were consecutively incubated with peroxidase blocking solution for 5 minutes and 0.25% casein and 0.1% BSA for 30 minutes. Thereafter, the sections were incubated with rabbit anti‐NFAT5 antibody 1:50 (Abcam) overnight at 4°C. For visualization, the Dako Envision™ (Dako) and TSA™‐Cy3 system (PerkinElmer) was used according to the manufacturers' instructions. Fluorescence intensity was recorded using an Olympus IX81 confocal microscope (Olympus). Quantitative image analyses were performed using the Olympus Xcellence software.
Transfection With siRNA
HUASMCs were transfected with short interfering RNA directed against NFAT5 (5′‐CCA GTT CCT ACA ATG ATA A‐3′), tenascin‐C (Santa Cruz Biotechnology) or ACTBL2 (Qiagen). As control, commercially available siGENOME Non‐Targeting siRNA (Thermo Scientific) was applied. For each well of a 6‐well plate, 3 μg of siRNA was diluted in Opti‐MEM I (Invitrogen) together with 3 μL of MATra‐si reagent (IBA) to give a final volume of 200 μL. After mixing and incubating for 20 minutes at ambient temperature, the solution was added onto the cells, which had been cultivated in 2 mL Opti‐MEM I prior to the transfection. Cells were then incubated on a magnetic plate (IBA) at 37°C and 5% CO2. After 15 minutes cells were washed and cultured in normal cell medium for a resting period of 48 hours for ACTBL2 and TNC or 72 hours for NFAT5 knockdown.
Analysis of Gene Expression
Total RNA was isolated from the cultured HUASMCs using the RNeasy Kit (Qiagen) according to the manufacturer's instructions. Subsequently, reverse transcription (RT) and polymerase chain reaction (PCR) for the target sequences and 60S ribosomal protein L32 (RPL32) cDNA as an internal standard was performed. Primers based on the following sequences were used for amplification:
NFAT5 for 5′‐AAG AGT GAA GAT GTT ACT CCA ATG GAA G‐3′, rev 5′‐AAA GTC TGT GCT TGT TCT TGT AGT GG‐3′; tenascin‐C for 5′‐TCA TTG TGG GTC CAG ATA CC‐3′, rev 5′‐GGA GTC CAA TTG TGG TGA AG‐3′; retinoic acid receptor beta for 5′‐GGG TAG GAT CCG GAA CGC ATT‐3′, rev 5′‐GAC GAG TTC CTC AGA GCT GG‐3′; junctional adhesion molecule 3 for 5′‐GCA ACC CTC GAC ATG GCG CT‐3′, rev 5′‐ACA GGG GTC ACT GGC TTC ACC T‐3′; RPL32 for 5′‐GTT CAT CCG GCA CCA GTC AG‐3′, rev 5′‐ACG TGC ACA TGA GCT GCC TAC‐3′. CPT1A for 5′‐GAG AGG AGA CAG ACA CCA TC‐3′, rev 5′‐ACT TGT CAA ACC ACC TGT C‐3′. ACTBL2 primers were bought from Qiagen.
Western Blot
HUASMCs were lysed using sample buffer containing 1% Triton X‐100 and 0.1 μmol/L DTT or buffers for preparing nuclear and cytosolic fractions. Protein samples were separated by SDS (10%), blotted onto nitrocellulose membranes and analyzed by chemiluminescence‐based immunodetection according to standard procedures. Primary antibodies: rabbit anti‐NFAT5 1:2000 (Abcam), rabbit anti‐NFAT5 1:500 (Santa Cruz Biotechnology), mouse anti‐β‐actin 1:10 000 (Abcam), anti‐JNK/anti‐phospho (JNK1/2: T183/Y185, JNK3: T221/Y223)‐JNK 1:2000 (R&D systems, Germany), anti‐TNC 1:500 (R&D Systems), anti‐histone H3 (Abcam).
Nuclear Extraction
Nuclear protein extraction was performed according to the following protocol: HUASMCs were lysed using buffer I containing 10 mmol/L HEPES, 10 mmol/L KCl, 1 μmol/L EDTA, 1 μmol/L EGTA, 15% Nonidet, protease and phosphatase inhibitors. After centrifugation (12 000g at 4°C for 15 minutes) the supernatant (cytosolic fraction) was transferred to a new tube and stored or immediately used for Western blotting. The remaining pellet containing the nuclear fraction was dissolved in 40 μL buffer II consisting of 20 mmol/L HEPES, 400 mmol/L NaCl, 0.01 mol/L EDTA, 0.01 mol/L EGTA, 15% Nonidet, and protease and phosphatase inhibitors. Subsequently, this solution was sonicated 2 times for 5 seconds at 50 Watts at 4°C. After centrifugation (12 000g at 4°C for 15 minutes) the supernatant containing the nuclear fraction was transferred to a new tube and stored at −80°C or was immediately used.
Chromatin Immune‐Precipitation (ChIP)
ChIP assay was performed using a ChIP kit (17‐295, Millipore) as described previously.23 In brief, after cross‐linking and cell lysis the chromatin was sheared by sonication (UP50H sonicator) resulting in DNA fragments in the range of 500 to 800 bp. One percent of the diluted cell supernatant was kept as the input material to quantify the DNA content of the samples. The supernatants were immunoprecipitated overnight at 4°C with an antibody against NFAT5 (PA1‐023 from Thermo Scientific Pierce). For a negative control a no‐antibody immunoprecipition was performed in parallel (NAC, no‐antibody control). DNA was isolated using the QiaQuick‐PCR Purification Kit (Qiagen) according to the manufacturer's instructions and used for the subsequent PCR analysis. Amplification of the tenascin‐C promoter fragments (Homo sapiens tenascin‐C, RefSeqGene on chromosome 9, accession number NG_029637) was carried out by conventional PCR adjusting the optimal number of cycles to avoid saturation and visualized by agarose gel electrophoresis. The following primer pair was used (position 31449 to 31592, containing a NFAT5 binding site): 5′‐TCTTGCCTCTTATTGATT‐3′ (for) and 5′‐GACTGAATGCTATACTGA‐3′ (rev). PCR signals obtained from the immunoprecipitated DNA were visualized and analyzed with a GelDoc™ XR molecular imager and the Quantity One 1‐D analysis software (BioRad). Rabbit IgG (#2729 from Cell Signaling Technology) were utilized as IgG control.
Bioinformatic Analysis
About 3512 bp of the promoter sequence upstream of the human tenascin‐C translation start site (Homo sapiens tenascin‐C, RefSeqGene on chromosome 9, accession NG_029637, position 28727 to 32239) were analyzed using the MatInspector software (Genomatrix Software) for potential NFAT5 consensus sequences.
DNA Microarray Analysis
To characterize the stretch‐dependent effects of NFAT5, 3 cell preparations each were stretched for 24 hours (0% to 13% elongation, 0.5 Hz) after siRNA‐mediated knockdown of NFAT5 or transfection with control siRNA. RNA was isolated (see above) and processed for DNA microarray analysis according to manufacturers' instructions:
Gene expression profiling was performed by using the HuGene‐1_0‐st‐v1 array from Affymetrix (High Wycombe). Biotinylated antisense cRNA was then prepared according to the Affymetrix standard labeling protocol. Afterwards, hybridization on the chip was performed in a GeneChip Hybridization oven 640 which was then dyed in a GeneChip Fluidics Station 450 and thereafter scanned with a GeneChip Scanner 3000.
A custom CDF version 14 with Entrez‐based gene definitions was used to annotate the arrays.24 Raw fluorescence intensity values were normalized applying quantile normalization. Differential gene expression analysis was performed with one‐way analysis of variance (ANOVA) using the software package JMP8 Genomics version 4 from SAS (SAS Institute). A false positive rate of a=0.05 with FDR correction was taken as the level of significance.
Collagen Gel Invasion Assay
The spheroid‐based invasion assay was adapted from the spheroid angiogenesis assay as described before.25 In brief, HUASMCs were grown as spheroids (500 cells per spheroid) with methylcellulose‐containing medium in U‐bottom 96‐well plates for 24 hours. Spheroids were then suspended into a collagen‐type‐I‐gel. The gel was aliquotted into a 24‐well plate to polymerize. After 30 minutes, 100 μL FCS‐containing (30%) DMEM medium was added. The cumulative length of VSMCs originating from each spheroid was measured after 24 hours at ×10 magnification. At least 10 spheroids per experimental condition were analyzed.
Cell Migration Assay
After transfection with specific siRNA or control siRNA, the cultured HUASMCs were seeded into 24‐well culture plates with 4‐mm thick and 10‐mm long silicon walls in the center of each well. After 24 hours, the silicon walls were removed and the distance between the cell borders was measured at ×2 magnification. The measurement was repeated after 24 and 48 hours. Optionally, cell culture medium was supplemented for 30 minutes with 0.65 μg/cm² recombinant human TN‐C (R&D systems) following removal of the silicon walls and substituted with new medium to remove excess TN‐C after washing with serum‐free D‐MEM medium.
Statistical Analysis
All results are expressed as means±SD of n individual experiments. Differences between 2 individual experimental groups were analyzed by unpaired Student t test with P< 0.05 considered statistically significant. Differences among 3 or more experimental groups were analyzed by ANOVA, followed by a Tukey multiple comparisons test or repeated measures ANOVA if applicable, with a probability value of P<0.05 considered statistically significant.
Results
Biomechanical Stretch Induces Translocation of NFAT5 to the Nucleus of VSMCs
Changes in osmolarity of the VSMC microenvironment elicit the translocation of NFAT5 to the nucleus (Figure 1). Exposing the cultured HUASMCs to biomechanical stretch for 24 hours produced the same effect (Figure 2). Furthermore, alterations in the overall staining intensity (Figure 2) indicated a change in the expression of NFAT5. Specificity of the antibody was verified by immunofluorescence analyses of VSMCs that had been treated with NFAT5‐specific siRNA (Figure 3).
Figure 1.
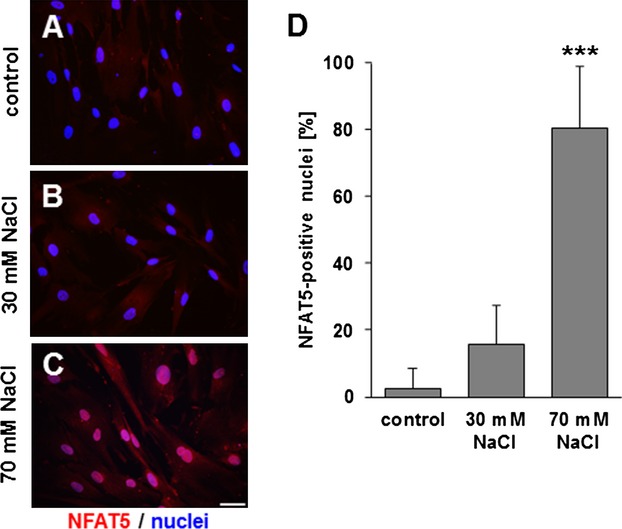
NFAT5 translocates to the nucleus upon hyperosmolarity. Immunofluorescence analysis of HUASMCs treated with control medium (A), 30 mmol/L NaCl (B) and 70 mmol/L NaCl (C) for 24 hours. Quantification of NFAT5‐positive nuclei (D) (n=3, ***P<0.001 vs control; scale bar: 50 μm). HUASMCs indicates human arterial smooth muscle cells; NFAT5, nuclear factor of activated T‐cells 5.
Figure 2.

Nuclear factor of activated T cells 5 (NFAT5) translocates to the nucleus upon stretch Immunofluorescence analysis of control (A) and stretch‐stimulated (B) HUASMCs for 24 hours (0.5 Hz, 0% to 13% elongation) shows an increase in NFAT5‐specific immunofluorescence in the nuclei. Quantification of NFAT5‐positive nuclei (C, ***P<0.001 vs control, n=6 for all experimental groups, scale bar: 50 μm). Western blot analyses of nuclear extracts (H‐H3: histone H3) from these cells show a stretch‐induced increase in the abundance of NFAT5 in the nuclei (D, *P<0.05 vs control, n=3 for all experimental groups). HUASMCs indicates human arterial smooth muscle cells; NFAT5, nuclear factor of activated T‐cells 5.
Figure 3.

Validation of NFAT5 knockdown efficiency. HUASMCs were treated with control siRNA and NFAT5 siRNA or left untreated. NFAT5 knockdown efficiency was verified by RT‐PCR analysis after 2 days (A) and by Western blot analysis after 3 days. B, In a similar experiment, immunofluorescence anaylsis was performed with HUASMCs stretched for 24 hours 3 days after transfection of control siRNA (C) or NFAT5 siRNA (D) to show the knockdown efficiency for the microarray setup under these conditions (scale bar=50 μm). HUASMCs indicates human arterial smooth muscle cells; NFAT5, nuclear factor of activated T‐cells 5; RPL32, ribosomal protein L32.
Stretch‐Induced Expression and Translocation of NFAT5 Depends on JNK Activity
The aforementioned results suggested that biomechanical stretch triggers mechanisms modifying NFAT5 expression and activity in a way that enables it to enter the nucleus. Therefore, we systematically blocked prototypic kinases known to be activated in stretch‐stimulated VSMCs.16 While neither p38 MAP kinase, the ERK1/2 pathway nor the phosphatase calcineurin appeared to play a role in NFAT5 translocation and/or expression (Figure 4), the number of NFAT5‐positive nuclei as well as the overall NFAT5 abundance was markedly decreased in stretch‐stimulated HUASMCs upon blocking the activity of c‐Jun‐N‐terminal kinase (JNK) with SP600125 (Figure 5A through 5E). Correspondingly, we detected that JNK phosphorylation (indicating its activity) is increased right upon exposing the cells to biomechanical stretch (Figure 5F). Further experiments revealed that inhibition of JNK has no impact on the stretch‐induced up‐regulation of NFAT5 mRNA expression (Figure 5G) but diminishes its increased protein abundance under these conditions (Figures 5H and 8D). In this context, we detected a JNK‐dependent change in NFAT5 (serine) phosphorylation in stretch‐stimulated VSMCs at an individual site (S1197) while total serine phosphorylation remained unchanged (Figures 6A through 6C). In fact, phosphorylation of S1197 appears to prevent NFAT5 from entering the nucleus of VSMCs (Figure 6D).
Figure 4.

ERK1/2, p38 MAPK and calcineurin are not involved in stretch‐induced translocation of NFAT5. Immunofluorescence analysis of HUASMCs stretched for 24 hours and treated with DMSO (A) or 50 μmol/L PD98059 (B, scale bar: 50 μm), an inhibitor of the ERK1/2 pathway. Quantification of NFAT5‐positive nuclei (C, n=3). Immunofluorescence analysis of HUASMCs stretched for 24 hours and treated with DMSO (D) or 20 μmol/L SB202190 (E, scale bar: 50 μm), a specific inhibitor of p38 MAP kinase. Quantification of NFAT5‐positive nuclei (F, n=3). Immunofluorescence analysis of HUASMCs stretched for 24 hours and treated with DMSO (G and I) or 10 μmol/L cyclosporin A (H and J), an inhibitor of calcineurin. Quantification of NFAT5‐positive nuclei (K, *P<0.05 vs corresponding DMSO or cyclo A control, bars represent the mean of 1 experiment ±SD performed in triplicates). DMSO indicates Dimethylsulfoxide; ERK1/2, extracellular‐regulated kinase 1/2; HUASMCs, human arterial smooth muscle cells; NFAT5, nuclear factor of activated T‐cells 5.
Figure 5.
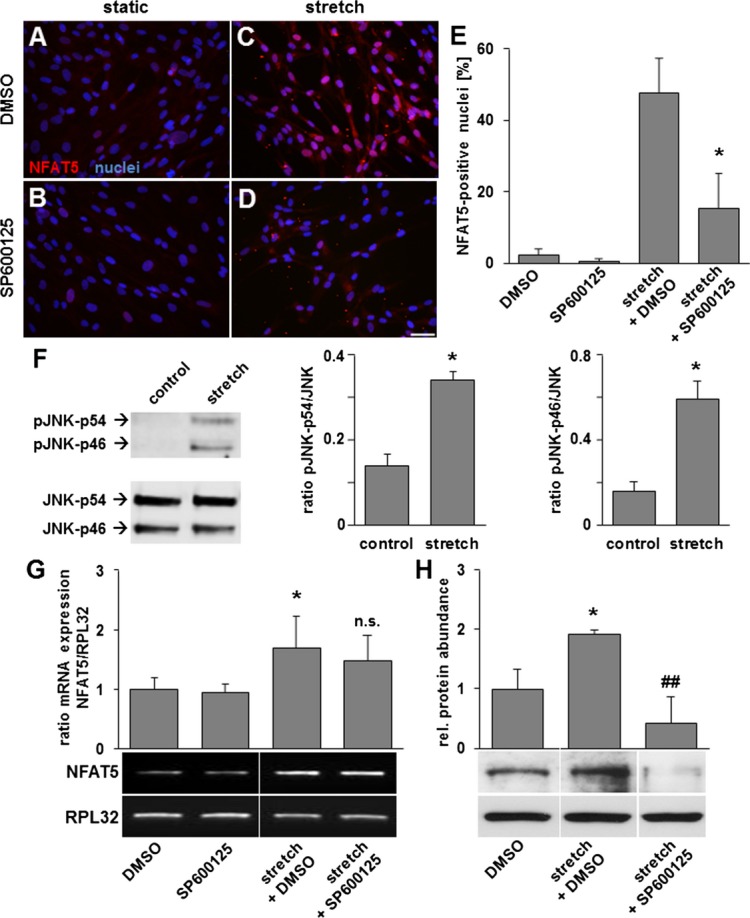
JNK inhibition by SP600125 decreases stretch‐induced protein abundance and translocation of NFAT5. Immunofluorescence analyses of HUASMCs (A and B static cell culture) exposed to biomechanical stretch for 24 hours revealed a decrease in the number of NFAT5 positive nuclei in the presence of 20 μmol/L SP600125 (D) as compared to untreated (C) cells (E, *P<0.05 vs DMSO stretch, n=3 for all experimental groups). As evidenced by corresponding Western blot analyses, the phosphorylation of JNK‐p46 and JNK‐p54 is increased in HUASMCs exposed to biomechanical stretch for 1 hour (F, ***P<0.05 vs control, n=3 for all experimental groups, scale bar: 50 μm). Semiquantitative PCR‐analyses revealed an increase in NFAT5 expression in SMCs exposed to biomechanical stretch for 24 hours, which is not inhibited by SP600125 (G, *P<0.05 vs DMSO, n=6 for both experimental groups; not significant (n.s.) vs stretch, n=6 for both experimental groups; n=4 for SP600125). The stretch‐mediated increase in the overall NFAT5 protein abundance was blocked by SP600125 as evidenced by Western blot analyses (H, *P<0.05 vs DMSO, ##P<0.01 vs stretch, n=3 for all comparison groups). HUASMCs indicates human arterial smooth muscle cells; JNK, c‐Jun‐N‐terminal kinase; NFAT5, nuclear factor of activated T‐cells 5; RPL32, ribosomal protein L32.
Figure 6.

Stretch‐dependent phosphorylation of NFAT5. HUASMCs were exposed to biomechanical stretch for 24 hours and lysed. Immunoprecipitation was performed by incubating the protein samples with anti‐NFAT5 antibodies for 2 hours at room temperature which were then captured by protein A‐agarose beads. After washing, the proteins were eluted from the beads, separated by SDS‐PAGE, blotted onto nitrocellulose membranes and analyzed by chemiluminescence‐based immunodetection. Analysis of changes in the phosphorylation of NFAT5 revealed that its total serine phosphorylation does not change upon stretch exposure (A) while individual serine residues such as S1197 become phosphorylated (B, *P<0.05 vs control, n=3; anti‐NFAT5 pS1198 antibody was from Abcam, Cambridge, UK). Stretch‐induced S1197 phosphporylation is inhibited by blocking JNK‐activity with SP600125. C, Immunofluorescence‐based detection of S1197‐phosphorylated NFAT5 indicates that it does not enter the nucleus (D, arrows) but accumulates in the cytoplasm of stretch‐stimulated (6 and 24 hours) HUVSMCs (D, *P<0.05 vs control, n=3 to 6). HUASMCs indicates human arterial smooth muscle cells; JNK, c‐Jun‐N‐terminal kinase; NFAT5, nuclear factor of activated T‐cells 5; PAGE, polyacrylamide gel electrophoresis; SDS, sodium dodecyl sulfate.
Inhibition of Palmitoyltransferase Activity Blocks Stretch‐Induced Translocation of NFAT5
Considering that osmolarity‐induced NFAT5 activity depends on its palmitoylation,26 we next explored the possibility that stretch‐induced palmitoylation of NFAT5 is a prerequisite for its stretch‐induced nuclear translocation. To this end, we pre‐treated stretch‐stimulated HUASMCs with 2‐bromopalmitate, a general palmitoyltransferase inhibitor, or palmostatin B, an inhibitor of depalmitoylation by blocking acyl protein thioesterase 1. While inhibition of palmitoylation did not affect NFAT5 protein abundance (Figure 7) but attenuated stretch‐induced NFAT5 translocation (Figures 8A through 8C), blocking depalmitoylation had the opposite effect (Figures 8D through 8G). Both compounds had no effect on the localization of NFAT5 in HUASMCs cultured under static conditions (Figure 8H) and did not affect stretch‐induced JNK expression or phosphorylation as evidenced by Western blot analyses (data not shown). Interestingly, biomechanical stretch caused a slower electrophoretic migration speed of the NFAT5 protein band that disappeared upon treatment with 2‐bromopalmitate (Figure 9A). In line with these observations, click chemistry techniques suggest that NFAT5 is palmitoylated in stretch‐stimulated HUASMCs (Figure 9B).
Figure 7.

Inhibition of palmitoylation by 2‐bromopalmitate has no impact on the increased protein abundance of NFAT5 in stretch‐stimulated SMCs. HUASMCs were exposed to biomechanical stretch for 24 hours and treated with 2‐bromopalmitate (100 μmol/L) to inhibit protein palmitoylation. Western blot analyses of whole cell lysates indicated that the NFAT5 protein abundance is increased in stretch‐stimulated HUASMCs and not affected by 2‐bromopalmitate (**P<0.01 vs DMSO, #P<0.01 vs DMSO, not significant (n.s.) vs stretch, n=3). HUASMCs indicates human arterial smooth muscle cells; NFAT5, nuclear factor of activated T‐cells ; SMC, smooth muscle cells.
Figure 8.

NFAT5 translocation depends on palmitoylation. Immunofluorescence images of stretch‐stimulated HUASMCs pretreated with DMSO as control (A) or 100 μmol/L 2‐bromopalmitate (B), an inhibitor of the DHHC family palmitoyl transferases (protein palmitoylation). Quantification of NFAT5‐positive nuclei (C, *P<0.05 vs control, n=3 for all experimental groups). Western blot analyses of nuclear extracts from HUASMCs exposed to stretch for 24 hours show a decline in nuclear NFAT5 abundance upon 2‐bromopalmitate and SP600125 (20 μmol/L) but not palmostatin B treatment (D, *P<0.05 vs control, n=3 for all experimental groups). In contrast to 2‐bromopalmitate, palmostatin B (13 μmol/L), an inhibitor of protein depalmitoylation, augments stretch‐induced translocation of NFAT5 to the nucleus (E through G, **P<0.01 vs DMSO with n=6 for the DMSO group and n=5 for the palmostatin group, scale bar: 50 μm). Both inhibitors had no significant effect on the percentage of NFAT5‐positive nuclei in HUASMCs cultured under static conditions (H, n=3 for all experimental groups). HUASMCs indicates human arterial smooth muscle cells; NFAT5, nuclear factor of activated T‐cells.
Figure 9.

Stretch induces NFAT5 palmitoylation. Exposure to biomechanical stretch promotes a slower electrophoretic migration speed of NFAT5 resulting in a band shift of about 5 kDa (see also Figures 6A and 6B) which disappears upon treatment with 2‐bromopalmitate (A, *P<0.05 vs stretch, n=3). HUASMCs were incubated with fatty‐acid free BSA, treated with 100 μmol/L 17‐octadecynoic acid (Cayman Chemical) to label palmitoylated proteins (control was left untreated) and exposed to biomechanical stretch for 24 hours (13% elongation, 0.5 Hz) or cultured under static conditions. Afterwards, proteins were isolated and excess 17‐octadecynoic acid was removed by chloroform/methanol extraction. Standard click chemistry (Martin et al, Nat Methods. 2009;6:135‐138) was performed for 90 minutes utilizing 1 to 2 mg/mL protein, 100 μmol/L biotin‐azide (in DMSO), 1 mmol/L Tris(2‐carboxyethyl)phosphine (in water), 100 μmol/L Tris[(1‐benzyl‐1H‐1,2,3‐triazol‐4‐yl)methyl]amine (in DMSO/t‐butanol, 20%/80%), and 1 mmol/L CuSO4 (in PBS). After a second chloroform/methanol extraction, biotinylated and thus palmitoylated proteins were captured by streptavidin agarose beads. After rinsing, proteins were eluted from the beads, separated by SDS‐PAGE, blotted onto nitrocellulose membranes and analyzed by chemiluminescence‐based immunodetection. NFAT5 was only detected in stretch‐stimulated HUASMCs as evidenced by Western blot analysis indicating its palmitoylation. β‐actin was detected in the flowthrough by standard Western blot analysis to verify that comparable amounts of proteins had been applied. BSA indicates bovine serum albumin; HUASMCs, human arterial smooth muscle cells; NFAT5, nuclear factor of activated T‐cells; PAGE, polyacrylamide gel electrophoresis; PBS, phosphate buffered saline: SDS, sodium dodecyl sulfate.
Tenascin‐C is a Transcriptional Target of NFAT5 in Stretch‐activated VSMCs
To assess the impact of NFAT5 on the VSMC phenotype, its expression was silenced by siRNA (Figure 3). By comparing cDNA microarray data acquired by comparison of mRNA isolated from stretch‐stimulated HUASMCs with and without prior knockdown of NFAT5 (Figure 10), we identified about 2000 differently regulated gene products (Figure 11A and Table 1). NFAT5‐dependent expression of selected gene products was verified by RT‐PCR (Figure 11B). With tenascin‐C (a matrix molecule) we next focused on a gene product whose expression has been linked to cardiovascular diseases such as intimal hyperplasia, pulmonary artery hypertension, or atherosclerosis27 and appears to control VSMC differentiation.28 Subsequent in silico analyses of the first 3512 bp of the promoter sequence upstream of the transcription start site of the human tenascin‐C gene revealed seven putative NFAT5 binding sites (Table 2). Exemplary ChIP analysis of binding site no.1 (819 to 837) confirmed a stretch‐mediated binding of NFAT5 to the tenascin‐C promoter (Figure 11C). Likewise, TNC expression was blocked by decoy oligo‐deoxynucleotides mimicking the NFAT5 binding site (Figure 12) and upon inhibiting the activity of JNK with SP600125 (Figure 13). Moreover, stretch‐induced NFAT5 expression and nuclear translocation coincided with the mRNA expression of TNC (Figure 14).
Figure 10.

Microarray analysis of stretch‐dependent NFAT5 target genes. Layout of an Affymetrix microarray‐based analysis of gene products whose expression is significantly up‐ or downregulated in stretch‐stimulated (24 hours) HUASMCs transfected with control or NFAT5‐specific siRNA. A heat map was generated from the statistical microarray data comparing HUASMCs transfected with control or NFAT5 siRNA. Each square represents the mean value of 3 replicates. Colors represent log2 values from −2 to 2. HUASMCs indicates human arterial smooth muscle cells; NFAT5, nuclear factor of activated T‐cells.
Figure 11.

Transcriptional targets of NFAT5 upon biomechanical stretch. Volcano plot analysis of transcriptome changes (fold expression level vs calculated probability value) in HUASMCs transfected with control or NFAT5 siRNA shows nearly 2000 differently regulated genes for P<0.005 (A, n=3 for all experimental groups). Verification of 4 microarray targets by RT‐PCR (B, **P<0.01, ***P<0.001 vs control, n=3 for all experimental groups). There are 7 putative NFAT5 binding sites in the human tenascin‐C promotor as evidenced by in silico analysis of the first 3512 bp of the promoter sequence upstream of the transcription start site. C, The maximum core similarity (core similarity of 1.0) is only reached when the highest conserved bases of a matrix are exactly matched by the sequence (cf. capitals in the sequence). A good match to the matrix has a similarity of >0.80 (matrix similarity). Based on a ChIP DNA fragment length in the range of 500 to 800 bp the primer pair used for ChIP analysis (651 to 807 bp) focuses on the NFAT5 binding site no. 1 (819 to 837 bp). Exemplary ChIP analysis functionally verified the stretch‐induced binding of NFAT5 to this site (D, ChIP DNA panel). Total input DNA serves as a control to verify that almost equal DNA amounts were used for the analysis. The no‐antibody‐control (NAC) reveales all non‐specifically precipitated chromatin species, the IgG control unspecific antibody binding. ACTBL2 indicates actin, beta‐like 2; ChIP, chromatin immune‐precipitation; HUASMCs, human arterial smooth muscle cells; JAM3, junctional adhesion molecule 3; NFAT5, nuclear factor of activated T‐cells; RARB, retinoic acid receptor beta; TNC, tenascin‐C.
Table 1.
Transcriptional Targets of NFAT5 in Stretch‐Stimulated HUASMCs
| Gene Name | Symbol | Regulation of Gene Expression (x‐Fold vs Control) |
|---|---|---|
| Actin, beta‐like 2 | ACTBL2 | −5.5x |
| Retinoic acid receptor, beta | RARB | −3.5x |
| Neutral cholesterol ester hydrolase 1 | NCEH1 | −3.3x |
| Transmembrane protein 2 | TMEM2 | −3.0x |
| Annexin A3 | ANXA3 | −2.8x |
| Annexin A10 | ANXA10 | −2.7x |
| Leukemia inhibitory factor receptor alpha | LIFR | −2.7x |
| Lipase A, lysosomal acid, cholesterol esterase | LIPA | −2.6x |
| Aldehyde dehydrogenase 1 family, member A1 | ALDH1A1 | −2.6x |
| Sulfotransferase family, cytosolic, 1B, member 1 | SULT1B1 | −2.6x |
| Lipase, endothelial | LIPG | −2.6x |
| Potassium voltage‐gated channel, member 4 | KCNE4 | −2.6x |
| Inositol polyphosphate‐4‐phosphatase, type II, 105 kDa | INPP4B | −2.6x |
| Speckle‐type POZ protein‐like | SPOPL | −2.5x |
| Phosphoglucomutase 2‐like 1 | PGM2L1 | −2.4x |
| Nucleolar and coiled‐body phosphoprotein 1 | NOLC1 | −2.4x |
| Chromosome 1 open reading frame 27 | C1orf27 | −2.4x |
| Coiled‐coil domain containing 23 | CCDC23 | −2.4x |
| Polo‐like kinase 2 | PLK2 | −2.3x |
| Tetraspanin 13 | TSPAN13 | −2.3x |
| Tenascin C | TNC | −2.3x |
| DEAD (Asp‐Glu‐Ala‐Asp) box polypeptide 18 | DDX18 | −2.2x |
| Phosphatidylcholine transfer protein | PCTP | −2.2x |
| Dual specificity phosphatase 4 | DUSP4 | −2.2x |
| KIAA1324‐like | KIAA1324L | −2.1x |
| Translocated promoter region (to activated MET oncogene) | TPR | −2.1x |
| Sulfotransferase family 1E, estrogen‐preferring, member 1 | SULT1E1 | −2.1x |
| Deoxynucleotidyltransferase, terminal, interacting protein 2 | DNTTIP2 | −2.1x |
| Arylacetamide deacetylase (esterase) | AADAC | −2.1x |
| Natriuretic peptide receptor C/guanylate cyclase C | NPR3 | −2.1x |
| Aldo‐keto reductase family 1, member C2 | AKR1C2 | −2.1x |
| T‐box 18 | TBX18 | −2.1x |
| Serine/threonine kinase 4 | STK4 | −2.0x |
| Suppressor of zeste 12 homolog (Drosophila) | SUZ12 | −2.0x |
| GLE1 RNA export mediator homolog (yeast) | GLE1 | −2.0x |
| Fibroblast growth factor receptor substrate 2 | FRS2 | −2.0x |
| General transcription factor IIE, polypeptide 1, alpha 56 kDa | GTF2E1 | −2.0x |
| Nuclear factor of activated T‐cells 5, tonicity‐responsive | NFAT5 | −2.0x |
| Bone morphogenetic protein 6 | BMP6 | −2.0x |
| General transcription factor IIIC, polypeptide 3, 102 kDa | GTF3C3 | −2.0x |
| Plasminogen activator, urokinase | PLAU | 2.0x |
| Transmembrane protein 45A | TMEM45A | 2.0x |
| Prenylcysteine oxidase 1 | PCYOX1 | 2.0x |
| CD9 molecule | CD9 | 2.0x |
| Protease, serine, 12 (neurotrypsin, motopsin) | PRSS12 | 2.0x |
| Family with sequence similarity 8, member A1 | FAM8A1 | 2.0x |
| Dynamin 1‐like | DNM1L | 2.0x |
| Argininosuccinate synthase 1 | ASS1 | 2.0x |
| Tumor protein D52‐like 1 | TPD52L1 | 2.0x |
| ATPase, class I, type 8B, member 2 | ATP8B2 | 2.0x |
| T‐complex 11 (mouse)‐like 2 | TCP11L2 | 2.0x |
| Claudin 11 | CLDN11 | 2.0x |
| Carnitine palmitoyltransferase 1A | CPT1A | 2.0x |
| CUB domain containing protein 1 | CDCP1 | 2.0x |
| Inositol monophosphatase domain containing 1 | IMPAD1 | 2.0x |
| Perilipin 2 | PLIN2 | 2.0x |
| Leiomodin 1 (smooth muscle) | LMOD1 | 2.0x |
| Heparan sulfate 2‐O‐sulfotransferase 1 | HS2ST1 | 2.0x |
| Calcium channel, voltage‐dependent, beta 3 subunit | CACNB3 | 2.0x |
| STE20‐related kinase adaptor beta | STRADB | 2.1x |
| Chromosome 13 open reading frame 31 | C13orf31 | 2.1x |
| ATPase, class V, type 10D | ATP10D | 2.1x |
| Chromosome 5 open reading frame 32 | C5orf32 | 2.1x |
| Transducer of ERBB2, 1 | TOB1 | 2.1x |
| Superoxide dismutase 2, mitochondrial | SOD2 | 2.1x |
| Armadillo repeat containing, X‐linked 6 | ARMCX6 | 2.1x |
| Keratin 34 | KRT34 | 2.1x |
| BCL2/adenovirus E1B 19 kDa interacting protein 3‐like | BNIP3L | 2.1x |
| PX domain containing serine/threonine kinase | PXK | 2.1x |
| PDZ and LIM domain 3 | PDLIM3 | 2.1x |
| Solute carrier family 37, member 3 | SLC37A3 | 2.1x |
| Transducin (beta)‐like 1 X‐linked receptor 1 | TBL1XR1 | 2.1x |
| Zinc finger protein 286A | ZNF286A | 2.1x |
| Interleukin‐1 receptor‐associated kinase 4 | IRAK4 | 2.1x |
| Platelet‐derived growth factor receptor‐like | PDGFRL | 2.2x |
| Chromosome 9 open reading frame 6 | C9orf6 | 2.2x |
| Myosin ID | MYO1D | 2.2x |
| Metallothionein 1G | MT1G | 2.2x |
| Keratin 19 | KRT19 | 2.2x |
| Calcium/calmodulin‐dependent protein kinase II delta | CAMK2D | 2.2x |
| Nudix‐type motif 21 | NUDT21 | 2.2x |
| Leucine rich repeat containing 8 family, member A | LRRC8A | 2.2x |
| ADAM metallopeptidase domain 12 | ADAM12 | 2.2x |
| Lysyl oxidase‐like 4 | LOXL4 | 2.2x |
| C1q and tumor necrosis factor related protein 1 | C1QTNF1 | 2.2x |
| Dynein, light chain, Tctex‐type 3 | DYNLT3 | 2.2x |
| NMD3 homolog (Saccharomyces cerevisiae) | NMD3 | 2.2x |
| Reversion‐inducing‐cysteine‐rich protein with kazal motifs | RECK | 2.3x |
| v‐raf‐1 murine leukemia viral oncogene homolog 1 | RAF1 | 2.3x |
| Cytochrome P450, family 1, subfamily B, polypeptide 1 | CYP1B1 | 2.3x |
| Zinc finger E‐box binding homeobox 2 | ZEB2 | 2.3x |
| A kinase (PRKA) anchor protein 12 | AKAP12 | 2.3x |
| Sarcoglycan, epsilon | SGCE | 2.3x |
| Cyclin‐dependent kinase 8 | CDK8 | 2.3x |
| DnaJ (Hsp40) homolog, subfamily B, member 6 | DNAJB6 | 2.3x |
| Small nucleolar RNA, C/D box 116‐24 | SNORD116‐24 | 2.3x |
| Fatty acid desaturase 1 | FADS1 | 2.4x |
| Solute carrier family 2, member 10 | SLC2A10 | 2.4x |
| Midkine (neurite growth‐promoting factor 2) | MDK | 2.4x |
| cAMP responsive element binding protein 3‐like 1 | CREB3L1 | 2.4x |
| Solute carrier family 39 (zinc transporter), member 6 | SLC39A6 | 2.4x |
| Surfeit 4 | SURF4 | 2.4x |
| Ring finger protein 149 | RNF149 | 2.4x |
| Transmembrane protein 106C | TMEM106C | 2.4x |
| Synaptotagmin XI | SYT11 | 2.4x |
| Cyclin G1 | CCNG1 | 2.5x |
| Ankyrin repeat domain 13A | ANKRD13A | 2.5x |
| Intercellular adhesion molecule 1 | ICAM1 | 2.5x |
| Transmembrane protein 87B | TMEM87B | 2.5x |
| DDB1 and CUL4 associated factor 12 | DCAF12 | 2.6x |
| Family with sequence similarity 198, member B | FAM198B | 2.6x |
| Family with sequence similarity 171, member B | FAM171B | 2.6x |
| Solute carrier family 35, member B1 | SLC35B1 | 2.7x |
| Sterol O‐acyltransferase 1 | SOAT1 | 2.7x |
| ABI family, member 3 (NESH) binding protein | ABI3BP | 2.7x |
| Hypothetical LOC554202 | LOC554202 | 2.7x |
| Amyloid beta (A4) precursor‐like protein 2 | APLP2 | 2.8x |
| Junctional adhesion molecule 3 | JAM3 | 2.8x |
| WD repeat domain, phosphoinositide interacting 1 | WIPI1 | 2.9x |
| Male‐enhanced antigen 1 | MEA1 | 2.9x |
| Stearoyl‐CoA desaturase 5 | SCD5 | 3.2x |
| Malectin | MLEC | 3.3x |
| Transmembrane and coiled‐coil domains 1 | TMCO1 | 4.4x |
The indicated values represent the degree of up‐ or down‐regulation of gene products in stretch‐stimulated (24 hours) HUASMCs transfected with control or NFAT5‐specific siRNA (P<0.005 for all gene products listed, with highlighted p‐values as follows: RARB P=0.00212; ACTBL2 P=0.000754; TNC=0.0005; JAM3 P=0.002799; CPT1A P=0.00006699; n=3). Gene products printed in bold have been verified by at least one other method of detection. The NFAT5 knockdown efficiency (see Figure 6) of each sample was separately verified by RT‐PCR analysis. HUASMC indicates human arterial smooth muscle cells; NFAT5, nuclear factor of activated T‐cells 5; PCR, polymerase chain reaction; RT, reverse transcription.
Table 2.
In Silico Tenascin‐C Promotor Analysis
| Start | End | Core Similarity | Matrix Similarity | Sequence | |
|---|---|---|---|---|---|
| Matrix | |||||
| V$NFAT5.01 | 819 | 837 | 1 | 0.83 | tttGGAAataaatcaagga |
| V$NFAT5.02 | 2016 | 2034 | 1 | 0.917 | tctGGAAagattttatcct |
| V$NFAT5.02 | 2122 | 2140 | 1 | 0.891 | caaGGAAaattgaactggg |
| V$NFAT5.02 | 2688 | 2706 | 1 | 0.914 | gatGGAAatttaagtcatt |
| V$NFAT5.02 | 2928 | 2946 | 1 | 0.924 | ttgGGAAaaatccattata |
| V$NFAT5.02 | 3075 | 3093 | 1 | 0.911 | tctGGAAaggttttgactc |
| V$NFAT5.02 | 3472 | 3490 | 1 | 0.915 | cagGGAAacttacttgaga |
| Primer | |||||
| NFAT5 ChIP sense | 651 | 669 | |||
| NFAT5 ChIP antisense | 789 | 807 | |||
There are 7 putative NFAT5 binding sites in the human tenascin‐C promotor as evidenced by in silico analysis of the first 3512 bp of the promoter sequence upstream of the transcription start site (C). The maximum core similarity (core similarity of 1.0) is only reached when the highest conserved bases of a matrix are exactly matched by the sequence (cf. capitals in the sequence). A good match to the matrix has a similarity of >0.80 (matrix similarity).ChIP indicates chromatin immune‐precipitation; NFAT5, nuclear factor of activated T‐cells 5.
Figure 12.

Attenuation of TNC mRNA expression in stretch‐stimulated HUASMCs upon NFAT5‐dODN treatment. HUASMCs were pretreated (10 μmol/L) with control deoxyoligonucleotides (ODNscr; ODNscrFor: 5′GAGTGAAGGCATACTGACTC′3, ODNscrRev: 5′GAGTCAGTATGCCTTCACTC′3; 5′/3′‐ends were modified by phosphorothioate) or decoy oligo‐deoxynucleotides mimicking the NFAT5 binding site (NFAT5‐dODN, NFAT5‐dODNFor: 5′GAGTGGAAACATACTGACTC′3; NFAT5‐dODNRev: 5′GAGTCAGTATGTTTCCACTC′3; 5′/3′‐ends were modified by phosphorothioate) for 3 hours and exposed to biomechanical stretch for 24 hours (0.5 Hz, 0% to 13% elongation). Subsequent PCR analyses revealed that the stretch‐induced increase of tenascin C (TNC) mRNA expression is significantly attenuated in HUASMCs treated with the NFAT5‐dODN (*P<0.05 vs stretch+ODNscr and stretch, 1 out of 2 independent experiments with similar results performed in quadruplicates). HUASMCs indicates human arterial smooth muscle cells; NFAT5, nuclear factor of activated T‐cells; PCR, polymerase chain reaction; RPL32, ribosomal protein L3.
Figure 13.

Inhibition of JNK blocks stretch‐induced RARB and TNC expression. HUASMCs were exposed to biomechanical stretch for 24 hours, treated with DMSO (control) or the JNK inhibitor SP600125 and the mRNA expression of the NFAT5 target genes RARB and tenascin C (TNC) was determined by real time PCR. Stretch up‐regulates RARB and TNC mRNA expression (A and B: *P<0.05 vs DMSO, n=3), which is inhibited upon SP600125 treatment (A and B: #P<0.05 vs stretch+DMSO, n=3). HUASMCs indicates human arterial smooth muscle cells; JNK, c‐Jun‐N‐terminal kinase; NFAT5, nuclear factor of activated T‐cells; PCR, polymerase chain reaction; RARB, retinoic acid receptor beta; RPL32, ribosomal protein L3.
Figure 14.

Dynamics of NFAT5 expression/translocation and TNC expression in stretch‐stimulated HUASMCs. Cells were exposed to biomechanical stretch for 6, 24, and 48 hours (0.5 Hz, 0% to 13% elongation). Western blot analyses of nuclear protein fractions (H‐H3: histone H3) and cytoplasmic protein fractions (A) as well as detection of NFAT5‐specific immunofluorescence in the nuclei (B) reveal a robust nuclear localization of NFAT5 24 hours upon onset of stretch stimulation (A, *P<0.05 vs control; n.s.—not significant vs control; A, n=3 for all experimental groups (repeated measures ANOVA); B, n.s.—not significant vs control, *P<0.05 vs control with n=5 for control, n=3 for 6 hours, n=6 for 24 hours and n=3 for 48 hours). Tenascin‐C (TNC) mRNA expression is significantly increased in HUASMC exposed to stretch for 24 but not 6 hours (C, n.s.—not significant vs control, *P<0.05 vs control, with n=5 for control, n=3 for 6 hours, n=3 for 24 hours, and n=3 for 48 hours; TNC expression was normalized to RPL32 expression). HUASMCs indicates human arterial smooth muscle cells; RPL32, ribosomal protein L3.
With tenascin‐C, we identified an NFAT5 target gene whose expression is upregulated about twofold in stretch‐stimulated HUASMCs (Figure 15A). To evaluate the potential function of this matrix molecule in VSMC migration during hypertension‐associated remodeling processes, HUASMC spheroids were seeded in collagen gels supplemented with tenascin‐C. Subsequent examination of the gels after 24 hours revealed that tenascin‐C stimulates the migratory capacity of VSMC in this 3D culture system (Figures 15B through 15D). However, proliferation of VSMCs seeded onto tenascin‐C‐coated culture plastic surfaces (ie, 2D culture system) was not altered (data not shown). Likewise, siRNA‐mediated knockdown of tenascin‐C (Figure 16) partially inhibited VSMC migration (Figures 15E through 15G). A similar failure in VSMC migration was observed upon NFAT5 knockdown, which was, however, in part rescued by covering the migration surface with recombinant tenascin‐C (Figure 15H).
Figure 15.

Tenascin‐C promotes and partially rescues HUASMC migration upon loss of NFAT5. Cells were stretched for 24 hours and tenascin‐C (TNC) mRNA expression was compared to that of static control cells (A) (*P<0.05 vs control, n=3 for all experimental groups). Spheroid sprouting assay of control and HUASMCs exposed to recombinant human tenascin‐C demonstrates a stimulating effect of tenascin‐C (TNC) on both cell migration and invasion (B through D, **P<0.01 vs control, n=5 for all experimental groups, scale bar: 100 μm). siRNA‐mediated knockdown of TNC inhibits migration (48 hours) of HUASMCs (E through G, *P<0.05 vs ctr. siRNA, n=5 for all experimental groups). In contrast to control siRNA‐treated HUASMCs, planar migration is inhibited upon NFAT5 silencing as evidenced by quantifying their migration distance 24 and 48 hours after initiating the assay. This is partially rescued by coating the migration surface with recombinant TNC (0.65 μg/cm² rhTNC) (H, ***P<0.001/**P<0.01 vs control siRNA or vs NFAT5 siRNA as indicated, n=4 for all experimental groups). HUASMCs indicates human arterial smooth muscle cells; NFAT5, nuclear factor of activated T‐cells; RPL32, ribosomal protein L3.
Figure 16.

Validation of tenacin‐C knockdown efficiency. HUASMCs were treated with control siRNA and tenascin‐C (TNC) siRNA. TNC knockdown efficiency (ca. 90%) was verified by Western blot analysis 2 days after siRNA treatment. Note that TNC generates a number of splice variants as evidenced by the 3 to 4 protein bands detected by Western blotting whose intensity was diminished by TNC siRNA treatment. HUASMCs indicates human arterial smooth muscle cells.
Hypertensive Perfusion Conditions Induce NFAT5 Translocation and Tenascin‐C Expression in Mouse Femoral Arteries
The increase in stretch of VSMCs is a result of the rise in the transmural pressure difference and thus a consequence of hypertension. To prove the relevance of our findings in this context, mouse femoral arteries were isolated and exposed to physiological or supraphysiological (hypertensive) pressure levels for 24 hours. Detection of NFAT5 in the media by immunofluorescence analyses unveiled a stretch/hypertension‐induced translocation of NFAT5 to the nucleus (Figures 17A through 17C). As could be expected from the aforementioned results, the abundance and mRNA expression of tenascin‐C increased under these conditions (Figures 17D through 17G). Similar results were obtained in rabbit carotid arteries perfused under hypertensive conditions for 24 hours (Figure 18).
Figure 17.

Hypertension induces NFAT5 translocation and tenascin‐C expression in mouse arteries. Mouse femoral arteries were exposed to normotensive (70 to 50 mm Hg; A, D) and hypertensive (100 to 120 mm Hg; B, E) perfusion conditions. Nuclei were visualized by DAPI staining (A through E, blue fluorescence) and NFAT5 was detected by immunofluorescence analysis (B, red fluorescence, arrows) in cross sections of the arteries. The number of NFAT5‐positive nuclei is increased in high‐pressure perfused arteries (C, ***P<0.001 vs 70 to 50 mm Hg with n=5 for “70 to 50 mm Hg” and n=4 for “120 to 100 mm Hg”). Likewise, the abundance (D through F, red fluorescence, arrow) and mRNA expression (G, real‐time PCR results) of tenascin‐C in the vessel wall is significantly increased under these conditions (F, *P<0.05 vs 70 to 50 mm Hg, n=6 for all experimental groups; scale bar: 100 μm; G, *P<0.05 vs 70 to 50 mm Hg, n=3 for all experimental groups). DAPI indicates 4′,6‐diamidino‐2‐phenylindole; NFAT5, nuclear factor of activated T‐cells; PCR, polymerase chain reaction; TNC, tenascin‐C.
Figure 18.

Hypertensive perfusion conditions increase the abundance of tenascin‐C in rabbit carotid arteries. Rabbit carotid arteries were exposed to a transmural pressure difference of 20 mm Hg and 150 mm Hg (mimicking hypertension) for 24 hours (Cattaruzza et al. Cell Death Differ. 2002;9:219–226). Tenascin‐C expression was visualized by immunohistochemistry (arrowheads, red staining) in paraffin‐embedded cross sections.
Discussion
An increase in wall stress or biomechanical stretch is a consequence of hypertension and a potent driver for arterial remodeling7,29–31 causing thickening of the arterial vessel wall and eventually its stiffening and malfunction.2,32 These detrimental morphological and functional adaptations are preceded by a phenotypic switch of the VSMCs in the media that is controlled by transcription factors such as AP‐1 and SRF.12,14 Recently, NFAT5 was discovered to modulate the phenotype of these cells upon angiotensin II or PDGF‐BB stimulation.17 In fact, hypertonicity was originally described as the prototypic mechanism of NFAT5 activation. This microenvironmental stimulus induces phosphorylation of the carboxy‐terminal transactivation domain of NFAT5, which subsequently results in its nuclear translocation and thus activation.18,33–36 Likewise, angiotensin II (a G‐protein‐coupled receptor agonist that elicits VSMC contraction) stimulates the entry of NFAT5 into the nucleus without altering its protein or mRNA expression.17 By expanding these findings, our study identified biomechanical stretch as a novel regulatory determinant of NFAT5 activity in VSMCs, which increases its mRNA expression, elicits its transient translocation to the nucleus, and like angiotensin II increases its protein abundance. In this context, it is reasonable to assume that AP‐1 controls the mRNA expression of NFAT‐5 in stretch‐stimulated VSMCs as it is a crucial regulator of stretch‐dependent gene expression and may control NFAT5 expression through binding to multiple AP‐1 binding sites located in the NFAT5 promotor.
Despite the implication of different kinases in the control of NFAT5 activity,19,22 p38 MAP kinase and ERK1/2‐dependent signaling—prototypic stretch‐activated kinase pathways—were not involved in the mechanism that drives the translocation of NFAT5 to the nucleus of the stretched VSMCs. Although biomechanical stretch elicits the release of intracellular calcium37 and the calcium/calcineurin signaling cascade activates NFAT5 in T‐cells,38 a corresponding mechanism does not seem to be involved in the stretch‐dependent control of NFAT5 activity in VSMCs. Interestingly, JNK activity appears to be a prerequisite for this process to occur as it regulates the protein abundance but not mRNA of NFAT5 in stretch‐stimulated VSMCs. Furthermore, it is likely that this kinase phosphorylates NFAT5 at Ser‐1197 under these conditions while no changes were observed in total serine phosphorylation upon the chosen experimental conditions. The role of this specific serine phosphorylation is still unclear and may contribute to the protein stability of NFAT5 under these conditions. However, as S1197‐phosphorylated NFAT5 does not enter the nucleus of stretch‐stimulated VSMCs this modification may restrict nuclear translocation of this transcription factor and thus tightly controls its dynamics in biomechanically stressed VSMCs. Interestingly, phosphorylation of other members of the NFAT family (NFAT1‐4) is usually associated with their localization in the cytosol.39–40 Activation of these transcription factors is realized by calcineurin, a serine/threonine phosphatase that controls their dephosphorylation and thus their ability to enter the nucleus. In contrast to NFAT1‐4, NFAT5 does not cooperate with Fos/Jun to bind to DNA and its nuclear translocation is independent of calcineurin.34 Nevertheless, phosphorylation of individual NFAT5 sites such as S1197 appear to be controlled by JNK and prevent a distinct portion of NFAT5 from entering the nucleus—a mechanism resembling a basic principle to arrest other members of the NFAT family in the cytoplasm.
The orchestration of NFAT5 activity becomes even more complex when considering that nucleocytoplasmic trafficking of NFAT5 may also be influenced by palmitoylation and/or myristoylation as has been observed upon changes in osmolarity.26 Along these data, we found that palmitoylation of NFAT5 is required to enter the nucleus in stretch‐stimulated VSMCs and is enhanced further upon inhibition of depalmitoylation. Palmitoylation is a highly relevant and reversible post‐translational modification of proteins regulating their activity, localization, and trafficking. The human genome encodes 23 protein palmitoyl acyltransferases that are all capable to link palmitate to cysteine residues acting as putative palmitoylation sites in many proteins such as Src family of kinases, G‐protein‐coupled receptors, Ras GTPases as well as NFAT5.26 Due to the hydrophobic characteristic of lipid anchors, palmitoylation may explain the slower electrophoretic migration speed of proteins26,41 as was observed for NFAT5 in protein lysates of stretch‐stimulated HUASMCs. Of note, the JNK target c‐Jun as a subunit of the transcription factor AP‐1 controls the expression of carnitine palmitoyltransferase42 which is upregulated in stretch‐stimulated VSMCs and may therefore promote the generation of palmitoylated NFAT5 in VSMCs exposed to biomechanical stretch.
As a ubiquitously expressed transcription factor, NFAT5 regulates the context‐dependent expression of gene products in many different cell types. With smooth muscle α‐actin NFAT5 appears to govern the expression of a protein of the contractile apparatus in angiotensin II‐stimulated VSMCs17 that is also controlled by myocardin.14,43 According to the fact that biomechanical stretch or an increase in wall stress is associated with the loss of contractile marker gene expression and favors activation of VSMC,16 we identified inter alia tenascin‐C as a stretch‐dependent NFAT5 target that stimulates migration of VSMCs and therefore promotes their activity. Tenascin‐C is a glycoprotein of the extracellular matrix whose expression and synthesis is correlated with proliferation of VSMCs and amplifies the mitogenic response to FGF‐2.44 Likewise, tenascin‐C has been shown to mediate VSMC migration induced by PDGF‐BB,45 which may explain why knockdown of NFAT5 in these cells inhibits their PDGF‐BB‐induced migration.17 Furthermore, tenascin‐C expression has often been associated with detrimental vascular remodeling processes that are linked to vascular injury or an increase in wall stress.46–48 Most notably, progression of pulmonary hypertension is accompanied by an increased abundance of tenascin‐C in the vessel wall and repression of tenascin‐C expression under these conditions triggers apoptosis of VSMCs and limits vascular thickening.49–50 In this context, tenascin‐C may act as a survival factor that context‐dependently adjusts growth of VSMCs by providing an anti‐apoptotic scaffold. The close relationship of tenascin‐C to vascular diseases suggests that the medicinal control of NFAT5 activity may be an interesting therapeutic option.
In summary, our findings indicate that (1) biomechanical stretch raises protein abundance and elicits translocation of NFAT5 to the nucleus in both cultured and native arterial smooth muscle cells, (2) palmitoylation of NFAT5 is a prerequisite for its nuclear translocation, and (3) NFAT5 directly upregulates the expression of tenascin‐C—a gene product that orchestrates the migration of VSMCs and thus contributes to the activation of VSMCs under conditions of hypertension. The stretch‐induced translocation of NFAT5 therefore constitutes a novel regulatory mechanism underlying this phenomenon during stretch or wall stress‐induced maladaptive remodeling processes that occur in the early phases of hypertension or atherosclerosis.
Sources of Funding
This work was supported by a grant from the Deutsche Forschungsgemeinschaft (SFB TR 23, project sections C5 and C6).
Disclosures
None.
Acknowledgments
The authors would like to acknowledge the excellent technical assistance of Gudrun Scheib, Maria Harlacher, Ender Serbest, and Franziska Mohr.
References
- 1.Haudenschild CC, Grunwald J, Chobanian AV. Effects of hypertension on migration and proliferation of smooth muscle in culture. Hypertension. 1985; 7:I101-I104 [DOI] [PubMed] [Google Scholar]
- 2.Olivetti G, Melissari M, Marchetti G, Anversa P. Quantitative structural changes of the rat thoracic aorta in early spontaneous hypertension. Tissue composition, and hypertrophy and hyperplasia of smooth muscle cells. Circ Res. 1982; 51:19-26 [DOI] [PubMed] [Google Scholar]
- 3.Intengan HD, Schiffrin EL. Vascular remodeling in hypertension: roles of apoptosis, inflammation, and fibrosis. Hypertension. 2001; 38:581-587 [DOI] [PubMed] [Google Scholar]
- 4.Bohr DF, Sitrin M. Regulation of vascular smooth muscle contraction. Changes in experimental hypertension. Circ Res. 1970; 27suppl 2:83-90 [PubMed] [Google Scholar]
- 5.Heerkens EH, Izzard AS, Heagerty AM. Integrins, vascular remodeling, and hypertension. Hypertension. 2007; 49:1-4 [DOI] [PubMed] [Google Scholar]
- 6.Weiser MC, Majack RA, Tucker A, Orton EC. Static tension is associated with increased smooth muscle cell DNA synthesis in rat pulmonary arteries. Am J Physiol. 1995; 268:H1133-H1138 [DOI] [PubMed] [Google Scholar]
- 7.Zeidan A, Nordstrom I, Dreja K, Malmqvist U, Hellstrand P. Stretch‐dependent modulation of contractility and growth in smooth muscle of rat portal vein. Circ Res. 2000; 87:228-234 [DOI] [PubMed] [Google Scholar]
- 8.Lee S, Lee RT. Mechanical stretch and intimal hyperplasia: the missing link? Arterioscler Thromb Vasc Biol. 2010; 30:459-460 [DOI] [PMC free article] [PubMed] [Google Scholar]
- 9.Mahoney WM, Schwartz SM. Defining smooth muscle cells and smooth muscle injury. J Clin Invest. 2005; 115:221-224 [DOI] [PMC free article] [PubMed] [Google Scholar]
- 10.Fukuda N, Hu WY, Satoh C, Nakayama M, Kishioka H, Kubo A, Kanmatsuse K. Contribution of synthetic phenotype on the enhanced angiotensin II‐generating system in vascular smooth muscle cells from spontaneously hypertensive rats. J Hypertens. 1999; 17:1099-1107 [DOI] [PubMed] [Google Scholar]
- 11.Lauth M, Wagner AH, Cattaruzza M, Orzechowski HD, Paul M, Hecker M. Transcriptional control of deformation‐induced preproendothelin‐1 gene expression in endothelial cells. J Mol Med (Berl). 2000; 78:441-450 [DOI] [PubMed] [Google Scholar]
- 12.Demicheva E, Hecker M, Korff T. Stretch‐induced activation of the transcription factor activator protein‐1 controls monocyte chemoattractant protein‐1 expression during arteriogenesis. Circ Res. 2008; 103:477-484 [DOI] [PubMed] [Google Scholar]
- 13.Wung BS, Cheng JJ, Hsieh HJ, Shyy YJ, Wang DL. Cyclic strain‐induced monocyte chemotactic protein‐1 gene expression in endothelial cells involves reactive oxygen species activation of activator protein 1. Circ Res. 1997; 81:1-7 [DOI] [PubMed] [Google Scholar]
- 14.Wang Z, Wang DZ, Hockemeyer D, McAnally J, Nordheim A, Olson EN. Myocardin and ternary complex factors compete for SRF to control smooth muscle gene expression. Nature. 2004; 428:185-189 [DOI] [PubMed] [Google Scholar]
- 15.Parmacek MS. Myocardin‐related transcription factors: critical coactivators regulating cardiovascular development and adaptation. Circ Res. 2007; 100:633-644 [DOI] [PubMed] [Google Scholar]
- 16.Pfisterer L, Feldner A, Hecker M, Korff T. Hypertension impairs myocardin function—a novel mechanism facilitating arterial remodeling. Cardiovasc Res. 2012; 96:120-129 [DOI] [PubMed] [Google Scholar]
- 17.Halterman JA, Kwon HM, Zargham R, Bortz PD, Wamhoff BR. Nuclear factor of activated T cells 5 regulates vascular smooth muscle cell phenotypic modulation. Arterioscler Thromb Vasc Biol. 2011; 31:2287-2296 [DOI] [PMC free article] [PubMed] [Google Scholar]
- 18.Miyakawa H, Woo SK, Dahl SC, Handler JS, Kwon HM. Tonicity‐responsive enhancer binding protein, a rel‐like protein that stimulates transcription in response to hypertonicity. Proc Natl Acad Sci USA. 1999; 96:2538-2542 [DOI] [PMC free article] [PubMed] [Google Scholar]
- 19.Jauliac S, Lopez‐Rodriguez C, Shaw LM, Brown LF, Rao A, Toker A. The role of NFAT transcription factors in integrin‐mediated carcinoma invasion. Nat Cell Biol. 2002; 4:540-544 [DOI] [PubMed] [Google Scholar]
- 20.O'Connor RS, Mills ST, Jones KA, Ho SN, Pavlath GK. A combinatorial role for NFAT5 in both myoblast migration and differentiation during skeletal muscle myogenesis. J Cell Sci. 2007; 120:149-159 [DOI] [PubMed] [Google Scholar]
- 21.Go WY, Liu X, Roti MA, Liu F, Ho SN. NFAT5/TonEBP mutant mice define osmotic stress as a critical feature of the lymphoid microenvironment. Proc Natl Acad Sci USA. 2004; 101:10673-10678 [DOI] [PMC free article] [PubMed] [Google Scholar]
- 22.Halterman JA, Kwon HM, Wamhoff BR. Tonicity‐independent regulation of the osmosensitive transcription factor TonEBP (NFAT5). Am J Physiol Cell Physiol. 2012; 302:C1-C8 [DOI] [PMC free article] [PubMed] [Google Scholar]
- 23.Conzelmann M, Wagner AH, Hildebrandt A, Rodionova E, Hess M, Zota A, Giese T, Falk CS, Ho AD, Dreger P, Hecker M, Luft T. IFN‐gamma activated JAK1 shifts CD40‐induced cytokine profiles in human antigen‐presenting cells toward high IL‐12p70 and low IL‐10 production. Biochem Pharmacol. 2010; 80:2074-2086 [DOI] [PubMed] [Google Scholar]
- 24.Sandberg R, Larsson O. Improved precision and accuracy for microarrays using updated probe set definitions. BMC Bioinformatics. 2007; 8:48. [DOI] [PMC free article] [PubMed] [Google Scholar]
- 25.Korff T, Augustin HG. Tensional forces in fibrillar extracellular matrices control directional capillary sprouting. J Cell Sci. 1999; 112Pt 19:3249-3258 [DOI] [PubMed] [Google Scholar]
- 26.Eisenhaber B, Sammer M, Lua WH, Benetka W, Liew LL, Yu W, Lee HK, Koranda M, Eisenhaber F, Adhikari S. Nuclear import of a lipid‐modified transcription factor: mobilization of NFAT5 isoform a by osmotic stress. Cell Cycle. 2011; 10:3897-3911 [DOI] [PMC free article] [PubMed] [Google Scholar]
- 27.Golledge J, Clancy P, Maguire J, Lincz L, Koblar S. The role of tenascin C in cardiovascular disease. Cardiovasc Res. 2011; 92:19-28 [DOI] [PubMed] [Google Scholar]
- 28.Cohen ED, Ihida‐Stansbury K, Lu MM, Panettieri RA, Jones PL, Morrisey EE. Wnt signaling regulates smooth muscle precursor development in the mouse lung via a tenascin C/PDGFR pathway. J Clin Invest. 2009; 119:2538-2549 [DOI] [PMC free article] [PubMed] [Google Scholar]
- 29.Albinsson S, Nordstrom I, Hellstrand P. Stretch of the vascular wall induces smooth muscle differentiation by promoting actin polymerization. J Biol Chem. 2004; 279:34849-34855 [DOI] [PubMed] [Google Scholar]
- 30.Busse R, Fleming I. Pulsatile stretch and shear stress: physical stimuli determining the production of endothelium‐derived relaxing factors. J Vasc Res. 1998; 35:73-84 [DOI] [PubMed] [Google Scholar]
- 31.Ward MR, Pasterkamp G, Yeung AC, Borst C. Arterial remodeling. Mechanisms and clinical implications. Circulation. 2000; 102:1186-1191 [DOI] [PubMed] [Google Scholar]
- 32.Intengan HD, Schiffrin EL. Structure and mechanical properties of resistance arteries in hypertension: role of adhesion molecules and extracellular matrix determinants. Hypertension. 2000; 36:312-318 [DOI] [PubMed] [Google Scholar]
- 33.Dahl SC, Handler JS, Kwon HM. Hypertonicity‐induced phosphorylation and nuclear localization of the transcription factor TonEBP. Am J Physiol Cell Physiol. 2001; 280:C248-C253 [DOI] [PubMed] [Google Scholar]
- 34.Lopez‐Rodriguez C, Aramburu J, Rakeman AS, Rao A. NFAT5, a constitutively nuclear NFAT protein that does not cooperate with Fos and Jun. Proc Natl Acad Sci USA. 1999; 96:7214-7219 [DOI] [PMC free article] [PubMed] [Google Scholar]
- 35.Ferraris JD, Williams CK, Persaud P, Zhang Z, Chen Y, Burg MB. Activity of the TonEBP/OREBP transactivation domain varies directly with extracellular NaCl concentration. Proc Natl Acad Sci USA. 2002; 99:739-744 [DOI] [PMC free article] [PubMed] [Google Scholar]
- 36.Lee SD, Colla E, Sheen MR, Na KY, Kwon HM. Multiple domains of TonEBP cooperate to stimulate transcription in response to hypertonicity. J Biol Chem. 2003; 278:47571-47577 [DOI] [PubMed] [Google Scholar]
- 37.Korff T, Ernst E, Nobiling R, Feldner A, Reiss Y, Plate KH, Fiedler U, Augustin HG, Hecker M. Angiopoietin‐1 mediates inhibition of hypertension‐induced release of angiopoietin‐2 from endothelial cells. Cardiovasc Res. 2012; 94:510-518 [DOI] [PubMed] [Google Scholar]
- 38.Trama J, Lu Q, Hawley RG, Ho SN. The NFAT‐related protein NFATL1 (TonEBP/NFAT5) is induced upon T cell activation in a calcineurin‐dependent manner. J Immunol. 2000; 165:4884-4894 [DOI] [PubMed] [Google Scholar]
- 39.Ruff VA, Leach KL. Direct demonstration of NFATp dephosphorylation and nuclear localization in activated HT‐2 cells using a specific NFATp polyclonal antibody. J Biol Chem. 1995; 270:22602-22607 [DOI] [PubMed] [Google Scholar]
- 40.Luo C, Shaw KT, Raghavan A, Aramburu J, Garcia‐Cozar F, Perrino BA, Hogan PG, Rao A. Interaction of calcineurin with a domain of the transcription factor NFAT1 that controls nuclear import. Proc Natl Acad Sci USA. 1996; 93:8907-8912 [DOI] [PMC free article] [PubMed] [Google Scholar]
- 41.Greaves J, Chamberlain LH. Dual role of the cysteine‐string domain in membrane binding and palmitoylation‐dependent sorting of the molecular chaperone cysteine‐string protein. Mol Biol Cell. 2006; 17:4748-4759 [DOI] [PMC free article] [PubMed] [Google Scholar]
- 42.Brady PS, Park EA, Liu JS, Hanson RW, Brady LJ. Isolation and characterization of the promoter for the gene coding for the 68 kDa carnitine palmitoyltransferase from the rat. Biochem J. 1992; 286Pt 3:779-783 [DOI] [PMC free article] [PubMed] [Google Scholar]
- 43.Chen J, Kitchen CM, Streb JW, Miano JM. Myocardin: a component of a molecular switch for smooth muscle differentiation. J Mol Cell Cardiol. 2002; 34:1345-1356 [DOI] [PubMed] [Google Scholar]
- 44.Jones PL, Rabinovitch M. Tenascin‐C is induced with progressive pulmonary vascular disease in rats and is functionally related to increased smooth muscle cell proliferation. Circ Res. 1996; 79:1131-1142 [DOI] [PubMed] [Google Scholar]
- 45.Ishigaki T, Imanaka‐Yoshida K, Shimojo N, Matsushima S, Taki W, Yoshida T. Tenascin‐C enhances crosstalk signaling of integrin alphavbeta3/PDGFR‐beta complex by SRC recruitment promoting PDGF‐induced proliferation and migration in smooth muscle cells. J Cell Physiol. 2011; 226:2617-2624 [DOI] [PubMed] [Google Scholar]
- 46.Wallner K, Shah PK, Sharifi BG. Balloon catheterization induces arterial expression of new tenascin‐C isoform. Atherosclerosis. 2002; 161:75-83 [DOI] [PubMed] [Google Scholar]
- 47.Hong KH, Lee YJ, Lee E, Park SO, Han C, Beppu H, Li E, Raizada MK, Bloch KD, Oh SP. Genetic ablation of the BMPR2 gene in pulmonary endothelium is sufficient to predispose to pulmonary arterial hypertension. Circulation. 2008; 118:722-730 [DOI] [PMC free article] [PubMed] [Google Scholar]
- 48.Ivy DD, McMurtry IF, Colvin K, Imamura M, Oka M, Lee DS, Gebb S, Jones PL. Development of occlusive neointimal lesions in distal pulmonary arteries of endothelin B receptor‐deficient rats: a new model of severe pulmonary arterial hypertension. Circulation. 2005; 111:2988-2996 [DOI] [PMC free article] [PubMed] [Google Scholar]
- 49.Cowan KN, Jones PL, Rabinovitch M. Elastase and matrix metalloproteinase inhibitors induce regression, and tenascin‐C antisense prevents progression, of vascular disease. J Clin Invest. 2000; 105:21-34 [DOI] [PMC free article] [PubMed] [Google Scholar]
- 50.Cowan KN, Heilbut A, Humpl T, Lam C, Ito S, Rabinovitch M. Complete reversal of fatal pulmonary hypertension in rats by a serine elastase inhibitor. Nat Med. 2000; 6:698-702 [DOI] [PubMed] [Google Scholar]