

Abstract
Background
In 2010, the American Heart Association defined ideal cardiovascular health as the simultaneous presence of 4 favorable health behaviors (nonsmoking, ideal body mass index, physical activity at goal, and dietary pattern that promotes cardiovascular health) and 3 favorable health factors (ideal levels of total cholesterol, blood pressure, and fasting glucose). The association between a change in ideal cardiovascular health status and pulse wave velocity, a surrogate marker of cardiovascular disease, has not been reported.
Methods and Results
The study cohort consisted of 1143 white adults from the Cardiovascular Risk in Young Finns Study who were followed for 21 years since baseline (1986). This cohort was divided in 2 subgroups: 803 participants (aged 9 to 18 years at baseline) to study the health status change from childhood to adulthood and 340 participants (aged 21 to 24 years at baseline) to study health status change from young adulthood to middle age. The change in the ideal cardiovascular health index was inversely associated with pulse wave velocity (adjusted for age, sex, and heart rate), every 1‐point increase corresponded to a 0.09‐m/s (P<0.001) decrease in pulse wave velocity in both groups. This association remained significant in subgroups based on the ideal cardiovascular health index at baseline.
Conclusions
The change in ideal cardiovascular health status, both from childhood to adulthood and from young adulthood to middle age, was an independent predictor of adult pulse wave velocity. Our results support the concept of ideal cardiovascular health as a useful tool for primordial prevention of cardiovascular disease.
Keywords: epidemiology, ideal cardiovascular health, pulse wave velocity
Introduction
In January 2010, the American Heart Association (AHA) released its 2020 Impact Goals and changed the focus from primary prevention of cardiovascular disease (CVD) to primordial prevention.(2010) It is no longer effective to only focus efforts on subjects at risk; clinicians must seek to prevent the development of risk factors.(2010) To improve the primordial prevention of CVD, AHA defined the concept of ideal cardiovascular health as the simultaneous presence of 4 ideal health behaviors (nonsmoking, normal body mass index [BMI], being physically active, and a healthy diet) and 3 ideal health factors (normal total cholesterol, blood pressure [BP], and fasting glucose).(2010) This concept has been shown to predict lower CVD risk and mortality of all causes,(2011)–(2012) including among different ethnic groups.(2012) However, the prevalence of ideal cardiovascular health has been extremely low in adolescence(2012)–(2013) and in adulthood.(2011),(2011)–(2012) Moreover, Huffman et al(2012) reported that the changes in health behaviors and factors were far from the AHA 2020 Impact Goals.
Ideal cardiovascular health should be achieved early in life, as atherosclerosis has its origin in childhood(1998) and childhood risk factors predict the occurrence of preclinical carotid atherosclerosis in adulthood.(2001)–(2003) There are 2 ways to reach ideal cardiovascular health in adulthood: to maintain favorable status from childhood or to change the profile from unfavorable to favorable. Because the prevalence of ideal cardiovascular health appears to be low in adolescence and adulthood, as mentioned, a large proportion of individuals would likely benefit from changing their profile toward the ideal.
However, reports concerning the relationship between a change in ideal cardiovascular health and cardiovascular outcomes are sparse. The effect of the change is interesting because all components of ideal cardiovascular health are modifiable, particularly through lifestyle adjustments. We reported previously that a change in the ideal cardiovascular health index was independently associated with subclinical atherosclerosis.(2012) We have also reported that favorable change in risk profile was inversely associated with the progression of carotid artery intima‐media thickness(2010) and arterial stiffness.(2010)
To the best of our knowledge, no data have been published about the associations between the ideal cardiovascular health index and pulse wave velocity (PWV), which is generally accepted as an intermediary cardiovascular outcome and an independent predictor of cardiovascular events and all‐cause mortality.(2010) The aim of the present report was to evaluate the relationship of the ideal cardiovascular health index and PWV—and the change in the index and PWV in particular. We used 2 subgroups: younger subjects (n=803, aged 9 to 18 years at baseline) to study the 21‐year change from childhood to adulthood and older subjects (n=340, aged 21 to 24 years at baseline) to study the 21‐year change from young adulthood to middle age.
Methods
Subjects
The Cardiovascular Risk in Young Finns Study is an ongoing multicenter follow‐up study of atherosclerosis precursors in Finnish children and adolescents. In 1980, a total of 4320 children and adolescents aged 3 to 18 years were randomly selected from the Finnish national population register.(1985) For the present study, we chose the year 1986 as the baseline because it was the first follow‐up at which fasting glucose values were measured. The follow‐up survey was performed in 2007, when 1872 (aged 30 to 45 years) of the original participants attended PWV measurement. The subjects with incomplete risk factor data (n=687), those with type 1 (n=13) or type 2 (n=13) diabetes, and female subjects who were pregnant (n=16) were excluded. The present sample therefore consisted of 1143 participants aged 30 to 45 years for whom complete risk factor data were available from baseline and who had undergone PWV and laboratory measurements during the 2007 survey. The study flow chart is shown in Figure 1. All subjects gave written informed consent, and the study was approved by local ethics committees.
Figure 1.
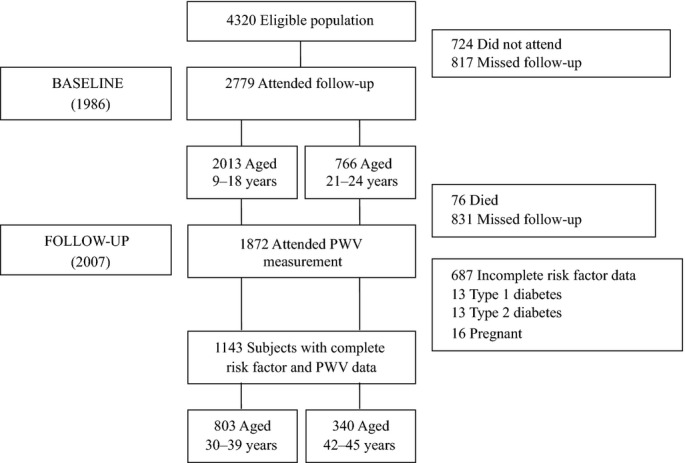
Study flowchart. PWV indicates pulse wave velocity.
Assessment and Definition of Health Behaviors
For all variables, the AHA definition(2010) for health behaviors was followed as closely as possible. In 1986, smoking was assessed in subjects aged ≥12 years. Smoking data were collected in connection with the medical examination in a secluded room where participants could respond confidentially and undisturbed. Subjects aged 12 to 18 years who reported having never smoked a whole cigarette were categorized as having an ideal childhood smoking status and those who had smoked ≥1 cigarettes as having a poor smoking status. Subjects aged <12 years were categorized as having an ideal child smoking status. Subjects aged 21 to 24 years in 1986 and all subjects in 2007 were classified as current smokers (poor), former smokers <12 months (intermediate), and never smokers or as having quit smoking >12 months ago (ideal).
Height and weight were measured and the BMI calculated as kg/m2. BMI was classified according to the AHA criteria.(2010)
Physical activity was assessed with a self‐report questionnaire. Subjects answered the questions themselves, with their parents’ assistance as necessary. The physical activity questionnaire consisted of the following variables: intensity of physical activity, frequency of moderate or vigorous activity, and hours spent on moderate or vigorous activity per week. The ideal physical activity for subjects aged 9 to 18 was approximated as ≥7 hours of moderate or vigorous activity per week; for adults, ≥1 h/week was considered vigorous intensity, ≥2 to 3 h/week as moderate intensity, and ≥2 to 3 h/week as moderate plus vigorous activity. Intermediate physical activity was classified as falling below these limits but exceeding none (poor).
In 1986, information on dietary habits was obtained with a nonquantitative food frequency questionnaire. Subjects answered the questions themselves, assisted by their parents when necessary. To examine the frequency of consumption of fruits, vegetables, fish or fish products, and soft drinks, the subjects were asked to complete a questionnaire on habitual dietary choices for the past month with the following 6 response categories: 1=daily, 2=almost every day, 3=a couple of times per week, 4=about once a week, 5=a couple of times per month, and 6=more seldom. We classified the subjects as having an ideal fruit and vegetable consumption profile if they consumed both fruits and vegetables daily. Subjects who consumed fish or fish products a couple of times per week or more frequently were classified as having ideal fish consumption profile. Subjects who consumed soft drinks a couple of times per week or less frequently were classified as having ideal soft drink consumption profile. Subjects who had 2 or 3 of these 3 ideal diet components were categorized as having an ideal healthy diet score, subjects with 1 component as having an intermediate score, and subjects with 0 components as having a poor healthy diet score in 1986. Although the quantitative amounts of fruits and vegetables, fish, and soft drinks consumed could not be inferred or the AHA‐recommended intakes of sodium and fiber‐rich whole grain measured, the questionnaire provided approximations of a healthy diet score. In 2007, a more detailed quantitative food frequency questionnaire was introduced, providing an estimate of food consumption in grams per day. Intake goals defined by the AHA are expressed for a 2000‐kcal diet,(2010) so we first scaled the intake goals according to the subjects’ total energy intake. We then categorized achievement of the 5 AHA ideal dietary goals: ≥450 g of fruits and vegetables/day, ≥1 oz of fish/day, ≥3 oz of whole grains/day, <1500 mg of sodium/day, and ≤5 oz of sugar‐sweetened beverages/day. Subjects who scored 4 or 5 of these 5 ideal diet components were categorized as having an ideal healthy diet score, subjects who scored 2 or 3 as having an intermediate score, and those with 0 or 1 component as having a poor healthy diet score in 2007.
Assessment and Definition of Health Factors
For the determination of serum lipoprotein levels and plasma glucose concentrations, venous blood samples were drawn after an overnight fast. All determinations were performed with standard methods reported previously.(2010),(2004) BP was measured from the brachial artery with a random zero sphygmomanometer. All measurements were taken from the right arm after the participant had been seated for 5 minutes. Cuff size was chosen according to arm circumference. The average of 3 readings was used in the analysis. The total cholesterol status, the BP status, and the fasting plasma glucose status were classified as ideal, intermediate, and poor according to the AHA criteria.(2010)
Indices of the Ideal Cardiovascular Health
Based on the individual health factors and behaviors, we generated corresponding AHA indices. The ideal cardiovascular health index corresponds to the number of ideal health factors and behaviors present at the baseline survey (Index86) and at the 2007 survey (Index07). In analyses, we used the ideal cardiovascular health indices as continuous variables.
Arterial PWV Studies
We used a whole‐body impedance cardiography device (CircMon; JR Medical Ltd) to determine PWV. CircMon includes a whole‐body impedance cardiography channel, distal impedance plethysmogram channel, and an ECG channel. When the pulse pressure wave enters the aortic arch and the diameter of the aorta changes, the whole‐body impedance decreases. The CircMon software measures the time difference between the onset of the decrease in the whole‐body impedance signal and, subsequently, in the distal plethysmographic signal from a popliteal artery at knee‐joint level. The measurement is triggered by the R wave of the ECG. The PWV can be determined from the distance and the time difference between the 2 recording sites. The repeatability index and the reproducibility index were good (99% and 87%, respectively).(2009) A detailed description of the method,(2010),(2003) the validation study,(2003) and reference values(2007) have been reported previously.
Statistical Methods
The comparisons between study participants and nonparticipants (subjects lost to follow‐up or excluded) were performed with the use of age‐ and sex‐adjusted linear and logistic regression analysis and the t test to examine differences in age. Change in the ideal cardiovascular health index was calculated by subtracting the Index86 from the Index07. The relationship between indices was evaluated by using Spearman correlation, and by using partial correlation adjusted for age and sex. To study the associations between the indices and PWV, and between the change in ideal cardiovascular health index and PWV, we used age‐, sex‐, and heart rate–adjusted linear regression separately in younger and in older participants. Heart rate was added in the analyses because it may be a confounding factor.(2009) These linear regression analyses were repeated in the sensitive analyses after excluding the subjects aged <12 years and after excluding the subjects using antihypertensive or cholesterol‐lowering medication. Linear regression was also used to evaluate relationship between the mini‐index (ie, the number of clinically important 3 key ideal behaviors: smoking, diet, and physical activity) and PWV separately in younger and in older participants and between the Index86 and PWV among the participants with no change. Subjects having negative change in ideal cardiovascular health index (Index86 ≥3 and change ≤−2) were compared with subjects staying unhealthy (Index86 <3 and no change) by using the t test. The statistical analyses were performed with SPSS for Windows (Release 20.0.0, SPSS Inc). Statistical significance was inferred at a 2‐tailed P value <0.05.
Results
The characteristics of the study participants and nonparticipants in 1986 are shown in Table 1. Participants aged 9 to 18 years were more often female and were more likely to have an ideal physical activity profile and ideal smoking status than nonparticipants. The older (aged 21 to 24 years) participants more often had an ideal physical activity status, an ideal healthy diet score, an ideal smoking status, and lower systolic BP than nonparticipants. There was no difference in age, BMI, or glucose and total cholesterol levels between participants and nonparticipants.
Table 1.
Characteristics of Study Participants and Nonparticipants (Subjects Missed Follow‐up or Were Excluded) in 1986
| Variable | Participants | Nonparticipants | P Value |
|---|---|---|---|
| Children 9 to 18 years of age | |||
| No. of subjects | 803 | 1210 | |
| Sex, female, % | 56.4 | 48.0 | 0.0002 |
| Age, y, mean (SD) | 13.6 (3.4) | 13.3 (3.3) | 0.06 |
| BMI, kg/m2, mean (SD) | 19.4 (3.1) | 19.1 (3.4) | 0.43 |
| Ideal physical activity, % | 6.5 | 4.6 | 0.03 |
| Ideal healthy diet score, % | 23.8 | 21.2 | 0.19 |
| Never smoked whole cigarette, %* | 22.8 | 18.3 | 0.01 |
| Systolic blood pressure, mm Hg, mean (SD) | 112 (12) | 111 (12) | 0.22 |
| Diastolic blood pressure, mm Hg, mean (SD) | 63 (9) | 62 (10) | 0.58 |
| Glucose, mmol/L, mean (SD) | 4.7 (0.4) | 4.8 (1.1) | 0.13 |
| Total cholesterol, mmol/L, mean (SD) | 4.9 (0.9) | 5.0 (1.0) | 0.28 |
| Adults 21 to 24 years of age | |||
| No. of subjects | 340 | 426 | |
| Sex, female, % | 56.5 | 51.2 | 0.15 |
| Age, y, mean (SD) | 22.5 (1.5) | 22.4 (1.5) | 0.41 |
| BMI, kg/m2, mean (SD) | 22.3 (2.9) | 22.5 (2.8) | 0.42 |
| Ideal physical activity, % | 49.4 | 31.2 | <0.0001 |
| Ideal healthy diet score, % | 22.9 | 16.4 | 0.03 |
| Ideal smoking status, % | 60.9 | 39.2 | <0.0001 |
| Systolic blood pressure, mm Hg, mean (SD) | 121 (12) | 123 (12) | 0.02 |
| Diastolic blood pressure, mm Hg, mean (SD) | 71 (9) | 71 (11) | 0.27 |
| Glucose, mmol/L, mean (SD) | 4.6 (0.4) | 4.6 (0.5) | 0.88 |
| Total cholesterol, mmol/L, mean (SD) | 5.1 (0.9) | 5.1 (1.0) | 0.99 |
Comparison between participants and nonparticipants were performed using age‐ and sex‐adjusted linear and logistic regression analysis as well as the t test to examine differences in age. BMI indicates body mass index.
Smoking data were gathered on subjects aged 12 to 18 years.
In the 1986 survey, the mean ideal cardiovascular health index of the younger participants was 3.7 (SD 1.0; Table 2) and that of the older participants was 4.3 (SD 1.2; Table 3). Ideal glucose levels (98.4% and 98.8%, respectively) and BMI levels (85.4% and 84.7%, respectively) were the most common. Ideal status in physical activity and smoking (6.5% and 22.8%, respectively) was the most difficult to achieve for younger participants, and none of them scored 0 or a full 7 of 7 ideal health components in Index86. Of the older participants, only 7 individuals (2.1%) scored 7 of 7 ideal health components in 1986, but none scored 0. Ideal status in terms of healthy diet, physical activity, and BP (22.9%, 49.4%, and 49.4%, respectively) were the most difficult to achieve for the older participants. Remarkable changes could be seen in the levels of individual components between 1986 and 2007 in both groups (Tables 2 and 3).
Table 2.
Prevalence of Cardiovascular Health Behaviors and Factors in 1986 and 2007, Participants Aged 9 to 18 Years in 1986 (n=803)
| Variable | 1986 | 2007 |
|---|---|---|
| Smoking status* | ||
| Poor (childhood: smoked ≥1 cigarettes; adulthood: current smoker), % | 77.2 | 24.2 |
| Intermediate (adulthood: former ≤12 months), % | — | 4.9 |
| Ideal (childhood: never tried or never smoked whole cigarette; adulthood: never or quit >12 months ago), % | 22.8 | 71.0 |
| Body mass index* | ||
| Poor (childhood: >95th percentile; adulthood: ≥30 kg/m2), % | 4.8 | 16.3 |
| Intermediate (childhood: 85th to 95th percentile; adulthood: 25 to 29.9 kg/m2), % | 9.8 | 35.5 |
| Ideal (childhood: <85th percentile; adulthood: <25 kg/m2), % | 85.4 | 48.2 |
| Physical activity level | ||
| Poor (none), % | 11.3 | 8.6 |
| Intermediate (childhood: >0 and <7 hours of moderate or vigorous per week; adulthood: >0 and <1 h/week vigorous or <2 to 3 h/week moderate), % | 82.2 | 42.0 |
| Ideal (childhood: ≥7 hours of moderate or vigorous activity per week; adulthood: ≥1 h/week vigorous intensity or ≥2 to 3 h/week moderate intensity or ≥2 to 3 h/week moderate plus vigorous), % | 6.5 | 49.4 |
| Healthy diet score* | ||
| Poor (0 components in 1986; 0 to 1 components in 2007), % | 20.7 | 20.5 |
| Intermediate (1 component in 1986; 2 to 3 components in 2007), % | 55.5 | 66.4 |
| Ideal (2 to 3 components in 1986; 4 to 5 components in 2007), % | 23.8 | 13.1 |
| Total cholesterol | ||
| Poor (childhood: ≥200 mg/dL; adulthood: ≥240 mg/dL), % | 35.3 | 7.0 |
| Intermediate (childhood: 170 to 199 mg/dL; adulthood: 200 to 240 mg/dL or treated to goal), % | 35.4 | 27.7 |
| Ideal (childhood: <170 mg/dL; adulthood: <200 mg/dL), % | 29.3 | 65.3 |
| Blood pressure* | ||
| Poor (childhood: >95th percentile; adulthood: SBP ≥140 or DBP ≥90 mm Hg), % | 8.6 | 14.2 |
| Intermediate (childhood: 90th to 95th percentile; adulthood: SBP 120 to 139 or DBP 80 to 89 mm Hg or treated to goal), % | 9.5 | 35.5 |
| Ideal (childhood: <90th percentile; adulthood: <120/<80 mm Hg), % | 81.9 | 50.3 |
| Fasting plasma glucose | ||
| Poor (≥126 mg/dL), % | — | 0.2 |
| Intermediate (100 to 125 mg/dL or treated to goal in adulthood), % | 1.6 | 18.2 |
| Ideal (<100 mg/dL), % | 98.4 | 81.6 |
| Ideal cardiovascular health index, points, mean (SD)* | 3.7 (1.0) | 3.8 (1.5) |
| Pulse wave velocity, m/s, mean (SD)* | 7.9 (0.6) | |
DBP indicates diastolic blood pressure; SBP, systolic blood pressure.
Smoking only aged 12 years and older in 1986.
All percentile limits are age‐ and sex‐specific.
Healthy diet components in 1986: fruits and vegetables=consumption of both fruits and vegetables daily; fish=consumption of fish or fish products a couple of times per week or more frequently; soft drinks=consumption of soft drinks a couple of times per week or less frequently. Components in 2007: fruits and vegetables ≥450 g/day; fish: ≥1 oz/day; whole grains ≥3 oz/day; sodium <1500 mg/day; sugar‐sweetened beverages ≤5 oz/day.
Corresponds to the number of ideal health factors and behaviors.
Adjusted for sex, age, and heart rate.
Table 3.
Prevalence of Cardiovascular Health Behaviors and Factors in 1986 and 2007, Participants Aged 21 to 24 Years in 1986 (n=340)
| Variable | 1986 | 2007 |
|---|---|---|
| Smoking status | ||
| Poor (current smoker), % | 27.4 | 17.6 |
| Intermediate (former ≤12 months), % | 11.8 | 4.7 |
| Ideal (never or quit >12 months ago), % | 60.9 | 77.6 |
| Body mass index | ||
| Poor (≥30 kg/m2), % | 1.8 | 20.0 |
| Intermediate (25 to 29.9 kg/m2), % | 13.5 | 36.2 |
| Ideal (<25 kg/m2), % | 84.7 | 43.8 |
| Physical activity level | ||
| Poor (none), % | 20.6 | 8.5 |
| Intermediate (>0 and <1 h/week vigorous or <2 to 3 h/week moderate), % | 30.0 | 40.6 |
| Ideal (≥1 h/week vigorous intensity or ≥2 to 3 h/week moderate intensity or ≥2 to 3 h/week moderate plus vigorous), % | 49.4 | 50.9 |
| Healthy diet score* | ||
| Poor (0 components in 1986; 0 to 1 components in 2007), % | 20.3 | 13.5 |
| Intermediate (1 component in 1986; 2 to 3 components in 2007), % | 56.8 | 72.9 |
| Ideal (2 to 3 components in 1986; 4 to 5 components in 2007), % | 22.9 | 13.5 |
| Total cholesterol | ||
| Poor (≥240 mg/dL), % | 11.5 | 11.2 |
| Intermediate (200 to 240 mg/dL or treated to goal), % | 29.1 | 38.2 |
| Ideal (<200 mg/dL), % | 59.4 | 50.6 |
| Blood pressure | ||
| Poor (SBP ≥140 or DBP ≥90 mm Hg), % | 9.1 | 24.4 |
| Intermediate (SBP 120 to 139 or DBP 80 to 89 mm Hg or treated to goal), % | 41.5 | 34.1 |
| Ideal (<120/<80 mm Hg), % | 49.4 | 41.5 |
| Fasting plasma glucose | ||
| Poor (≥126 mg/dL), % | — | 1.2 |
| Intermediate (100 to 125 mg/dL or treated to goal), % | 1.2 | 24.4 |
| Ideal (<100 mg/dL), % | 98.8 | 74.4 |
| Ideal health index, points, mean (SD)* | 4.3 (1.2) | 3.5 (1.5) |
| Pulse wave velocity, m/s, mean (SD)* | 8.7 (0.5) | |
DBP indicates diastolic blood pressure; SBP, systolic blood pressure.
Healthy diet components in 1986: fruits and vegetables=consumption of both fruits and vegetables daily; fish=consumption of fish or fish products a couple of times per week or more frequently; soft drinks=consumption of soft drinks a couple of times per week or less frequently. Components in 2007: fruits and vegetables ≥450 g/day; fish: ≥1 oz/day; whole grains ≥3 oz/day; sodium <1500 mg/day; sugar‐sweetened beverages ≤5 oz/day.
Corresponds to the number of ideal health factors and behaviors.
Adjusted for sex, age, and heart rate.
Index86 was associated with Index07 in both groups (Spearman correlation, r=0.21, P<0.001, for younger and r=0.35, P<0.001, for older participants), and this association remained significant after adjustment for age and sex (partial correlation r=0.22, P<0.001, and r=0.33, P<0.001, respectively). Index86 was inversely related to PWV (adjusted for age, sex, and heart rate) in both groups, but the relationship was significant only for older participants (1‐point increase in index corresponding (β±SE) −0.03±0.02 m/s, P=0.16, and −0.07±0.02 m/s, P=0.004, change in PWV, respectively). Index07 was significantly related to PWV in both groups (1‐point increase in index corresponding (β±SE) −0.12±0.01 m/s, P<0.001, and −0.14±0.02 m/s, P<0.001, change in PWV, respectively), and remained significant (−0.12±0.01 m/s, P<0.001, and −0.14±0.02 m/s, P<0.001, respectively) after adjustment for Index86.
There was wide variation in the change in ideal cardiovascular health index—from −4 to +5 points for the younger and from −5 to +4 points for the older participants. The average change was (mean±SD) 0.1±1.6 and −0.7±1.5, respectively. Female subjects had slightly higher means in both groups (0.6 versus −0.5, P<0.001, and −0.4 versus −1.1, P<0.001, respectively). None of the older subjects could maintain all 7 of 7 ideal scores from baseline to follow‐up. In addition, only 16 (2.0%) younger and 7 (1.5%) older subjects could reach this status in 2007. Changes in the ideal cardiovascular health index according to the Index86 scores are shown in Tables 4 and 5.
Table 4.
Prevalence of Change in the Ideal Cardiovascular Health Index According to the Index in 1986, Participants Aged 9 to 18 Years in 1986 (n=803)
| Change | Ideal Cardiovascular Health Index in 1986, Points | ||||||||
|---|---|---|---|---|---|---|---|---|---|
| All (n=803) | 0 | 1 (n=8) | 2 (n=83) | 3 (n=254) | 4 (n=306) | 5 (n=133) | 6 (n=19) | 7 | |
| ≥2 | 19.4 | — | 37.5 | 49.4 | 28.3 | 11.8 | 3.0 | — | — |
| 1 | 22.2 | — | 37.5 | 18.1 | 21.3 | 28.8 | 12.8 | 5.3 | — |
| 0 | 24.5 | — | 25.0 | 24.1 | 24.8 | 23.2 | 27.1 | 26.3 | — |
| −1 | 17.4 | — | — | 8.4 | 16.5 | 17.3 | 24.1 | 31.6 | — |
| ≤−2 | 16.4 | — | — | — | 9.1 | 19.0 | 33.3 | 36.8 | — |
Table 5.
Prevalence of Change in the Ideal Cardiovascular Health Index According to the Index in 1986, Participants Aged 21 to 24 Years in 1986 (n=340)
| Change | Ideal Cardiovascular Health Index in 1986, Points | ||||||||
|---|---|---|---|---|---|---|---|---|---|
| All (n=340) | 0 | 1 (n=4) | 2 (n=19) | 3 (n=63) | 4 (n=105) | 5 (n=105) | 6 (n=37) | 7 (n=7) | |
| ≥1 | 20.3 | — | 50.0 | 26.3 | 39.7 | 16.2 | 18.1 | 2.7 | — |
| 0 | 25.3 | — | 50.0 | 52.6 | 31.7 | 27.6 | 19.0 | 13.5 | — |
| −1 | 23.5 | — | — | 21.1 | 17.5 | 23.8 | 26.7 | 27.0 | 28.6 |
| −2 | 18.8 | — | — | — | 7.9 | 26.7 | 17.1 | 27.0 | 42.9 |
| ≤−3 | 12.1 | — | — | — | 3.2 | 5.7 | 19.0 | 29.7 | 28.6 |
Every 1‐point increase in the change in ideal cardiovascular health index was inversely related to PWV (adjusted for age, sex, and heart rate) in younger (β±SE −0.09±0.01 m/s, P<0.001) and in older (β±SE −0.09±0.02 m/s, P<0.001) participants (Figure 2). This relationship was also significant in subgroups based on the index at baseline, except for the smallest subgroups (Tables 6 and 7). Negative change in ideal cardiovascular health index (Index86 ≥3 and change ≤−2) was worse than staying unhealthy (Index86 <3 and no change), PWV 8.4 m/s and 8.2 m/s (P=0.02), respectively. Additionally, among the participants with no change, every 1‐point increase in Index86 was inversely associated with PWV in younger (β±SE −0.14±0.04 m/s, P=0.002) and in older (−0.18±0.05 m/s, P<0.001) participants.
Figure 2.
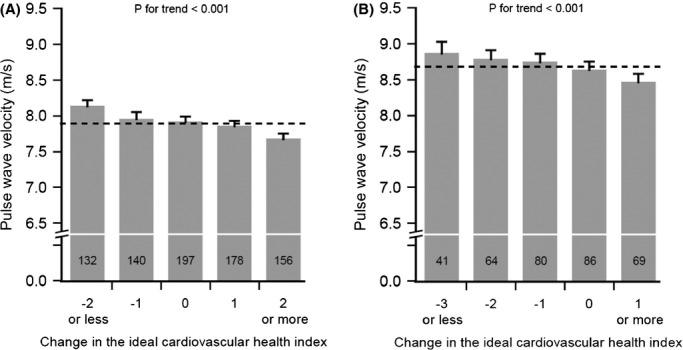
Pulse wave velocity (PWV) in 2007 by the change in the ideal cardiovascular health index for participants aged 30 to 39 years (A) and for participants aged 42 to 45 years (B). Change was calculated by subtracting the ideal cardiovascular health index in 1986 from the index in 2007. Bars represent sex‐, age‐, and heart rate–specific mean plus 95% CI. Dashed line represents population mean, and values inside columns indicate the number of subjects in each group.
Table 6.
The Relationship Between Change in the Ideal Cardiovascular Health Index and PWV According to the Index in 1986, Participants Aged 9 to 18 Years in 1986 (n=803)
| Change in the Index | Ideal Cardiovascular Health Index in 1986, Points | |||||||
|---|---|---|---|---|---|---|---|---|
| 0 | 1 (n=8) | 2 (n=83) | 3 (n=254) | 4 (n=306) | 5 (n=133) | 6 (n=19) | 7 | |
| β (SE) | — | −0.14 (0.14) | −0.16 (0.04) | −0.11 (0.02) | −0.11 (0.02) | −0.12 (0.03) | −0.18 (0.13) | — |
| P value | — | 0.34 | <0.001 | <0.001 | <0.001 | 0.001 | 0.18 | — |
Adjusted for age, sex, and heart rate. β values are regression coefficients (expressed in m/s) for a 1‐point change. PWV indicates pulse wave velocity.
Table 7.
The Relationship Between Change in the Ideal Cardiovascular Health Index and PWV According to the Index in 1986, Participants Aged 21 to 24 Years in 1986 (n=340)
| Change in the Index | Ideal Cardiovascular Health Index in 1986, Points | |||||||
|---|---|---|---|---|---|---|---|---|
| 0 | 1 (n=4) | 2 (n=19) | 3 (n=63) | 4 (n=105) | 5 (n=105) | 6 (n=37) | 7 (n=7) | |
| β (SE) | — | −0.34 (0.26) | −0.23 (0.11) | −0.11 (0.05) | −0.16 (0.04) | −0.13 (0.03) | −0.15 (0.06) | 0.13 (0.15) |
| P value | — | 0.32 | 0.04 | 0.04 | <0.001 | <0.001 | 0.01 | 0.40 |
Adjusted for age, sex, and heart rate. β values are regression coefficients (expressed in m/s) for a 1‐point change. PWV indicates pulse wave velocity.
Sensitivity Analyses
We performed 2 additional analyses. First, because smoking was only evaluated in subjects aged 12 years or older, we repeated all analyses without subjects aged <12 years. Second, we repeated analyses excluding the subjects using antihypertensive or cholesterol‐lowering medication. The results of all these additional analyses were similar to those shown. Third, we analyzed associations of PWV and the mini‐index (ie, the number of clinically important 3 key ideal behaviors: smoking, diet, and physical activity). Every 1‐point increase in the change in the mini‐index was also inversely associated with PWV (adjusted for age, sex, heart rate, and mini‐index in 1986) in both younger (β±SE −0.05±0.03 m/s, P=0.04) and older (−0.14±0.04 m/s, P<0.001) participants.
Discussion
The present study showed that the change in the ideal cardiovascular health index was inversely related to PWV in adulthood. This relationship was significant for the younger (change from childhood to adulthood) and the older (change from young adulthood to middle age) participants, and remained significant in subgroups based on the index at baseline.
To the best of our knowledge, this is the first study to demonstrate the association between the change in the ideal cardiovascular health index and PWV. We and others have previously shown associations between traditional as well as lifestyle risk factors and PWV.(2010),(2004)–(2010) In these studies, however, either fewer components were used or risk factors were used as continuous variables with no specific classification. In the AHA definition for ideal cardiovascular health, the health‐promoting benefits of each of the index components have been well established.(2010) The ideal cardiovascular health index has also been shown to predict lower CVD risk and mortality of all causes.(2011)–(2012) However, the prevalence of ideal cardiovascular health has been reported to be extremely low in adolescence(2012)–(2013) and in adulthood.(2011),(2011)–(2012) To improve the outcomes of the primordial prevention of CVD and to reach the AHA 2020 Impact Goals, there should be a clear change toward ideal cardiovascular health status. At the same time, it should be known how the changes in ideal cardiovascular health status affect cardiovascular outcomes.
We found an inverse linear association between the change in ideal cardiovascular health index and PWV. This association remained significant in subgroups based on the index at baseline, supporting the hypothesis that a change in an individual's ideal cardiovascular health index has an independent favorable effect on the process of arterial stiffening. Our findings also support the previous studies showing tracking of risk factors from childhood to adulthood,(2008)–(2011) as the average change in the index for the younger participants was 0.1 point. Remarkably, the older participants showed an average change in index of −0.7 point, and only 20.3% demonstrated an increase of +1 or more points. None of them were able to maintain the ideal 7 of 7 score from baseline to follow‐up, and only 16 younger and 7 older subjects were able to achieve this status at follow‐up. This corroborates the fact that lifestyle changes toward ideal cardiovascular health are difficult to reach. However, we showed that the change in ideal cardiovascular index was inversely related to PWV in both groups—also after adjustment for the baseline index—suggesting that favorable changes in cardiovascular health could have favorable impact on the stiffening process of arteries.
Arterial stiffness is a surrogate marker for CVD and assessed as PWV, is generally accepted as an independent predictor of cardiovascular events and all‐cause mortality.(2010) The stiffening process of large arteries is complex and aging and exposure to cardiovascular risk factors accelerate it.(2009),(2005)–(2007) This process includes the overproduction of collagen, the degradation and remodeling of normal elastin, enhanced vascular hypertrophy, increased oxidative stress caused by repeated mechanical load, increased local activity of the renin‐angiotensin‐aldosterone system, and inflammation.(2005)–(2007) Structural stiffening may alter the endothelial function, thus increasing vascular smooth muscle cell tone and thereby further worsening the stiffening. BP has been shown to be the most remarkable lifetime risk factor for the stiffening process.(2009)–(2010) Cecelja and Chowienczyk reported the dissociation of aortic PWV with traditional CVD risk factors other than hypertension.(2009) However, few reports concerning physical activity and PWV and none concerning a healthy diet and PWV were included in their systematic review—the review therefore included no reports concerning all 7 ideal cardiovascular health components and PWV.(2009) It is also known that smoking, low physical activity, and an unhealthy diet form an important combination of risk factors when assessing the risk load for CVD.(2010) Our present findings support the hypothesis that arterial stiffness measured by PWV reflects the ongoing multifactor pathological process that could be assessed by means of the ideal cardiovascular health index, with the change in the index in particular.
The strengths of the present study are the well‐phenotyped participants at baseline and follow‐up and the longitudinal study design. However, our study has some limitations. First, even though measurement of major risk factors is well standardized and therefore reasonably generalizable from one study to the next, the measurement of diet and physical activity is not. At baseline, information on dietary habits was obtained with a nonquantitative food frequency questionnaire, which has some limitations. For example, soft drinks included not only sugar‐sweetened beverages but also diet drinks; the category of fruits included fruit juices; and fish was assessed as “fish foods,” which included fish and all fish products. In addition, the intakes of sodium and fiber‐rich whole grain, which the AHA also includes in their estimates, could not be inferred at baseline. In 2007, a more detailed quantitative food frequency questionnaire that provided an estimate of food consumption in grams per day was adopted. Physical activity was assessed with a subjective method at both baseline and follow‐up. Self‐reported data on diet, physical activity, and smoking are subject to known biases. However, as reported previously, validation studies showed significant correlations between the information obtained by the food frequency questionnaire and the 48‐hour recall,(2005) between the physical activity questionnaire and the maximal cycle ergometer test,(2005) and between the self‐reported smoking (a measure similar to that used in our study) and biochemical measurements.(2004) These findings support the validity of the self‐reports. Second, because the present study cohort was racially homogeneous, the generalizability of our results is limited to white European subjects. It is also a limitation that definitions for ideal cardiovascular health were different in childhood and in adulthood, so this may affect the relationship between the change in the index from childhood to adulthood and PWV in adulthood. It is also important to remember that PWV was measured only once in 2007, so it is not possible to analyze changes in PWV and especially age‐related changes. Another potential limitation is the nonparticipation in the follow‐up study. In this study, 41.1% of the original cohort was included in the analyses. Additionally, as shown in Table 1, participants had slightly better characteristics than nonparticipants in 1986, leading to an underestimation of associations. Finally, an observational study cannot establish causality, and the impact of both baseline values and the changes in risk factors during follow‐up may have been underestimated or overestimated due to possible regression dilution bias.
In conclusion, we found that the change in the ideal cardiovascular health index was an independent predictor of PWV for younger (change from childhood to adulthood) and older (change from young adulthood to middle age) participants and remained significant after adjustment for the baseline index. Our findings suggest that it is always worthwhile to change one's lifestyle from unfavorable to favorable. Further, the study indicates that the ideal cardiovascular health index is a useful tool for primordial prevention of CVD.
Sources of Funding
This study was financially supported by the Academy of Finland (grants 77841, 117832, 201888, 121584, and 126925); the Social Insurance Institution of Finland; the Turku University Foundation; the Medical Research Fund of Kuopio University Hospital; the Medical Research Fund of Tampere University Hospital; the Turku University Hospital Medical Fund; the Emil Aaltonen Foundation (Lehtimäki); the Juho Vainio Foundation; the Finnish Foundation of Cardiovascular Research; the Finnish Cultural Foundation; and The Tampere Tuberculosis Foundation.
Disclosures
None.
References
- Lloyd‐Jones DM, Hong Y, Labarthe D, Mozaffarian D, Appel LJ, Van Horn L, Greenlund K, Daniels S, Nichol G, Tomaselli GF, Arnett DK, Fonarow GC, Ho PM, Lauer MS, Masoudi FA, Robertson RM, Roger V, Schwamm LH, Sorlie P, Yancy CW, Rosamond WDAmerican Heart Association Strategic Planning Task Force and Statistics Committee. Defining and setting national goals for cardiovascular health promotion and disease reduction: the American Heart Association's strategic Impact Goal through 2020 and beyond. Circulation. 2010; 121:586-613 [DOI] [PubMed] [Google Scholar]
- Folsom AR, Yatsuya H, Nettleton JA, Lutsey PL, Cushman M, Rosamond WDARIC Study Investigators. Community prevalence of ideal cardiovascular health, by the American Heart Association definition, and relationship with cardiovascular disease incidence. J Am Coll Cardiol. 2011; 57:1690-1696 [DOI] [PMC free article] [PubMed] [Google Scholar]
- Liu K, Daviglus ML, Loria CM, Colangelo LA, Spring B, Moller AC, Lloyd‐Jones DM. Healthy lifestyle through young adulthood and the presence of low cardiovascular disease risk profile in middle age: the Coronary Artery Risk Development in (Young) Adults (CARDIA) study. Circulation. 2012; 125:996-1004 [DOI] [PMC free article] [PubMed] [Google Scholar]
- Ford ES, Greenlund KJ, Hong Y. Ideal cardiovascular health and mortality from all causes and diseases of the circulatory system among adults in the United States. Circulation. 2012; 125:987-995 [DOI] [PMC free article] [PubMed] [Google Scholar]
- Dong C, Rundek T, Wright CB, Anwar Z, Elkind MS, Sacco RL. Ideal cardiovascular health predicts lower risks of myocardial infarction, stroke, and vascular death across whites, blacks, and hispanics: the northern Manhattan study. Circulation. 2012; 125:2975-2984 [DOI] [PMC free article] [PubMed] [Google Scholar]
- Laitinen TT, Pahkala K, Magnussen CG, Viikari JS, Oikonen M, Taittonen L, Mikkilä V, Jokinen E, Hutri‐Kähönen N, Laitinen T, Kähönen M, Lehtimäki T, Raitakari OT, Juonala M. Ideal cardiovascular health in childhood and cardiometabolic outcomes in adulthood: the Cardiovascular Risk in Young Finns Study. Circulation. 2012; 125:1971-1978 [DOI] [PubMed] [Google Scholar]
- Shay CM, Ning H, Daniels SR, Rooks CR, Gidding SS, Lloyd‐Jones DM. Status of cardiovascular health in US adolescents: prevalence estimates from the National Health and Nutrition Examination Surveys (NHANES) 2005–2010. Circulation. 2013; 127:1369-1376 [DOI] [PubMed] [Google Scholar]
- Pahkala K, Hietalampi H, Laitinen TT, Viikari JS, Rönnemaa T, Niinikoski H, Lagström H, Talvia S, Jula A, Heinonen OJ, Juonala M, Simell O, Raitakari OT. Ideal cardiovascular health in adolescence: effect of lifestyle intervention and association with vascular intima‐media thickness and elasticity (the Special Turku Coronary Risk Factor Intervention Project for Children [STRIP] study). Circulation. 2013; 127:2088-2096 [DOI] [PubMed] [Google Scholar]
- Bambs C, Kip KE, Dinga A, Mulukutla SR, Aiyer AN, Reis SE. Low prevalence of “ideal cardiovascular health” in a community‐based population: the heart strategies concentrating on risk evaluation (Heart SCORE) study. Circulation. 2011; 123:850-857 [DOI] [PMC free article] [PubMed] [Google Scholar]
- Shay CM, Ning H, Allen NB, Carnethon MR, Chiuve SE, Greenlund KJ, Daviglus ML, Lloyd‐Jones DM. Status of cardiovascular health in US adults: prevalence estimates from the National Health and Nutrition Examination Surveys (NHANES) 2003–2008. Circulation. 2012; 125:45-56 [DOI] [PMC free article] [PubMed] [Google Scholar]
- Huffman MD, Capewell S, Ning H, Shay CM, Ford ES, Lloyd‐Jones DM. Cardiovascular health behavior and health factor changes (1988–2008) and projections to 2020: results from the National Health and Nutrition Examination Surveys. Circulation. 2012; 125:2595-2602 [DOI] [PMC free article] [PubMed] [Google Scholar]
- Berenson GS, Srinivasan SR, Bao W, Newman WP, III, Tracy RE, Wattigney WA. Association between multiple cardiovascular risk factors and atherosclerosis in children and young adults. The Bogalusa Heart Study. N Engl J Med. 1998; 338:1650-1656 [DOI] [PubMed] [Google Scholar]
- Davis PH, Dawson JD, Riley WA, Lauer RM. Carotid intimal‐medial thickness is related to cardiovascular risk factors measured from childhood through middle age: the Muscatine Study. Circulation. 2001; 104:2815-2819 [DOI] [PubMed] [Google Scholar]
- Li S, Chen W, Srinivasan SR, Bond MG, Tang R, Urbina EM, Berenson GS. Childhood cardiovascular risk factors and carotid vascular changes in adulthood: the Bogalusa Heart Study. JAMA. 2003; 290:2271-2276 [DOI] [PubMed] [Google Scholar]
- Raitakari OT, Juonala M, Kähönen M, Taittonen L, Laitinen T, Mäki‐Torkko N, Järvisalo MJ, Uhari M, Jokinen E, Rönnemaa T, Åkerblom HK, Viikari JS. Cardiovascular risk factors in childhood and carotid artery intima‐media thickness in adulthood: the Cardiovascular Risk in Young Finns Study. JAMA. 2003; 290:2277-2283 [DOI] [PubMed] [Google Scholar]
- Juonala M, Viikari JS, Kähönen M, Taittonen L, Laitinen T, Hutri‐Kähönen N, Lehtimäki T, Jula A, Pietikäinen M, Jokinen E, Telama R, Räsänen L, Mikkilä V, Helenius H, Kivimäki M, Raitakari OT. Life‐time risk factors and progression of carotid atherosclerosis in young adults: the Cardiovascular Risk in Young Finns study. Eur Heart J. 2010; 31:1745-1751 [DOI] [PubMed] [Google Scholar]
- Aatola H, Hutri‐Kähönen N, Juonala M, Viikari JSA, Hulkkonen J, Laitinen T, Taittonen L, Lehtimäki T, Raitakari OT, Kähönen M. Lifetime risk factors and arterial pulse wave velocity in adulthood: the Cardiovascular Risk in Young Finns Study. Hypertension. 2010; 55:806-811 [DOI] [PubMed] [Google Scholar]
- Vlachopoulos C, Aznaouridis K, Stefanadis C. Prediction of cardiovascular events and all‐cause mortality with arterial stiffness: a systematic review and meta‐analysis. J Am Coll Cardiol. 2010; 55:1318-1327 [DOI] [PubMed] [Google Scholar]
- Åkerblom HK, Viikari J, Uhari M, Räsänen L, Byckling T, Louhivuori K, Pesonen E, Suoninen P, Pietikäinen M, Lähde PL, Dahl M, Aromaa A, Sarna S, Pyörälä K. Atherosclerosis precursors in Finnish children and adolescents. I. General description of the cross‐sectional study of 1980, and an account of the children's and families’ state of health. Acta Paediatr Scand Suppl. 1985; 318:49-63 [DOI] [PubMed] [Google Scholar]
- Juonala M, Viikari JS, Hutri‐Kähönen N, Pietikäinen M, Jokinen E, Taittonen L, Marniemi J, Rönnemaa T, Raitakari OT. The 21‐year follow‐up of the Cardiovascular Risk in Young Finns Study: risk factor levels, secular trends and east‐west difference. J Intern Med. 2004; 255:457-468 [DOI] [PubMed] [Google Scholar]
- Tahvanainen A, Koskela J, Tikkakoski A, Lahtela J, Leskinen M, Kähönen M, Nieminen T, Kööbi T, Mustonen J, Pörsti I. Analysis of cardiovascular responses to passive head‐up tilt using continuous pulse wave analysis and impedance cardiography. Scand J Clin Lab Invest. 2009; 69:128-137 [DOI] [PubMed] [Google Scholar]
- Kööbi T, Kähönen M, Iivainen T, Turjanmaa V. Simultaneous non‐invasive assessment of arterial stiffness and haemodynamics—a validation study. Clin Physiol Funct Imaging. 2003; 23:31-36 [DOI] [PubMed] [Google Scholar]
- Koivistoinen T, Kööbi T, Jula A, Hutri‐Kähönen N, Raitakari OT, Majahalme S, Kukkonen‐Harjula K, Lehtimäki T, Reunanen A, Viikari J, Turjanmaa V, Nieminen T, Kähönen M. Pulse wave velocity reference values in healthy adults aged 26‐75 years. Clin Physiol Funct Imaging. 2007; 27:191-196 [DOI] [PubMed] [Google Scholar]
- Cecelja M, Chowienczyk P. Dissociation of aortic pulse wave velocity with risk factors for cardiovascular disease other than hypertension: a systematic review. Hypertension. 2009; 54:1328-1336 [DOI] [PubMed] [Google Scholar]
- Li S, Chen W, Srinivasan SR, Berenson GS. Childhood blood pressure as a predictor of arterial stiffness in young adults: the Bogalusa Heart Study. Hypertension. 2004; 43:541-546 [DOI] [PubMed] [Google Scholar]
- Aatola H, Koivistoinen T, Hutri‐Kähönen N, Juonala M, Mikkilä V, Lehtimäki T, Viikari JS, Raitakari OT, Kähönen M. Lifetime fruit and vegetable consumption and arterial pulse wave velocity in adulthood: the Cardiovascular Risk in Young Finns Study. Circulation. 2010; 122:2521-2528 [DOI] [PubMed] [Google Scholar]
- Chen X, Wang Y. Tracking of blood pressure from childhood to adulthood: a systematic review and meta‐regression analysis. Circulation. 2008; 117:3171-3180 [DOI] [PMC free article] [PubMed] [Google Scholar]
- Juhola J, Magnussen CG, Viikari JS, Kähönen M, Hutri‐Kähönen N, Jula A, Lehtimäki T, Åkerblom HK, Pietikäinen M, Laitinen T, Jokinen E, Taittonen L, Raitakari OT, Juonala M. Tracking of serum lipid levels, blood pressure, and body mass index from childhood to adulthood: the Cardiovascular Risk in Young Finns Study. J Pediatr. 2011; 159:584-590 [DOI] [PubMed] [Google Scholar]
- Zieman SJ, Melenovsky V, Kass DA. Mechanisms, pathophysiology, and therapy of arterial stiffness. Arterioscler Thromb Vasc Biol. 2005; 25:932-943 [DOI] [PubMed] [Google Scholar]
- Greenwald SE. Ageing of the conduit arteries. J Pathol. 2007; 211:157-172 [DOI] [PubMed] [Google Scholar]
- Mikkilä V, Räsänen L, Raitakari OT, Pietinen P, Viikari J. Consistent dietary patterns identified from childhood to adulthood: the Cardiovascular Risk in Young Finns Study. Br J Nutr. 2005; 93:923-931 [DOI] [PubMed] [Google Scholar]
- Telama R, Yang X, Viikari J, Välimäki I, Wanne O, Raitakari O. Physical activity from childhood to adulthood: a 21‐year tracking study. Am J Prev Med. 2005; 28:267-273 [DOI] [PubMed] [Google Scholar]
- Kentala J, Utriainen P, Pahkala K, Mattila K. Verification of adolescent self‐reported smoking. Addict Behav. 2004; 29:405-411 [DOI] [PubMed] [Google Scholar]