

Abstract
Neuroligins are postsynaptic adhesion molecules that interacting with presynaptic neurexins ensure the cross‐talk between pre‐ and postsynaptic specializations. Rare mutations in neurexin–neuroligin genes have been linked to autism spectrum disorders (ASDs). One of these, the R451C mutation of the gene encoding for Neuroligin3 (Nlgn3), has been found in patients with familial forms of ASDs. Animals carrying this mutation (NL3R451C knock‐in mice) exhibit impaired social behaviors, reminiscent of those observed in ASD patients, associated with major alterations in both GABAergic and glutamatergic transmission, which vary among different brain regions and at different developmental stages. Here, pair recordings from parvalbumin‐ (PV) expressing basket cells and spiny neurons were used to study GABAergic synaptic signaling in layer IV barrel cortex of NL3R451C mutant mice. We found that the R451C mutation severely affects the probability of GABA release from PV‐expressing basket cells, responsible for controlling via thalamo‐cortical inputs the feed‐forward inhibition. No changes in excitatory inputs to parvalbumin‐positive basket cells or spiny neurons were detected. These data clearly show that primary targets of the NL3 mutation are PV‐expressing basket cells, independently of the brain region where they are localized. Changes in the inhibitory gate of layer IV somatosensory cortex may alter sensory processing in ASD patients leading to misleading sensory representations with difficulties to combine pieces of information into a unified perceptual whole.
Keywords: Autism spectrum disorders, excitatory/inhibitory balance, Neuroligin3R451C knock‐in mice
Autism spectrum disorders (ASDs) comprise a heterogeneous group of neurodevelopmental abnormalities, characterized by impaired social interactions. Here, using mice carrying the R451C mutation of the Nlgn3 gene (found in few familial cases of ASDs), and exhibiting behavioral deficits reminiscent of those present in ASD patients, we found that, in layer IV barrel cortex microcircuit, parvalbumin‐expressing basket cells display a reduced probability of GABA release into spiny neurons. Alterations of GABAergic signaling in layer IV somatosensory cortex of NL3R451C knock‐in mice may alter sensory processing leading to misleading sensory representations with difficulties to combine pieces of information into a unified perceptual whole.
Introduction
Autism spectrum disorders (ASDs) comprise a heterogeneous group of neurodevelopmental disorders characterized by impaired social interactions, deficits in verbal and nonverbal communication associated with stereotyped and repetitive behavior (American Psychiatric Association 2000).
It has been proposed that a disrupted excitatory/inhibitory (E/I) balance in key neuronal circuits accounts for cognitive deficits associated with neurodevelopmental disorders, including ASDs (Gogolla et al. 2009; LeBlanc and Fagiolini 2011; Pizzarelli and Cherubini 2011; Ramamoorthi and Lin 2011; Lin et al. 2013; Zikopoulos and Barbas 2013). At early developmental stages, such disequilibrium may alter synaptic circuits in a period of high plasticity, leading to permanent modifications in neural activity (Zhang and Sun 2011). Interestingly, in the perinatal period, GABA via its depolarizing and excitatory action plays a crucial role in shaping and refining neuronal circuits (Cherubini et al. 1991; Ben‐Ari et al. 2007, 2012). This occurs via activity‐dependent and ‐independent processes. The latter may involve transmembrane cell adhesion molecules of the neurexin and neuroligin families (Südhof 2008). By bridging the synaptic cleft, these proteins ensure bidirectional signals essential for synapses organization and stabilization (Scheiffele et al. 2000; Varoqueaux et al. 2006; Chubykin et al. 2007; Ko et al. 2009; Poulopoulus et al. 2009).
Several mutations in neurexin–neuroligin genes have been linked to ASDs (Jamain et al. 2003; Laumonnier et al. 2004; Yan et al. 2005; Kim et al. 2008). One of these, the missense mutation R451C of the gene encoding for the postsynaptic adhesion protein Neuroligin3 (Nlgn3), found in two families with children affected by ASDs (Jamain et al. 2003), has been introduced by gene targeting in mice (Tabuchi et al. 2007). These mice exhibit major alterations in both GABAergic and glutamatergic transmission, that vary among different brain regions and at different developmental stages (Tabuchi et al. 2007; Etherton et al. 2011; Pizzarelli and Cherubini 2013; Földy et al. 2013). In addition, mutant mice reveal deficits in social interaction similar to those found in ASD patients (Tabuchi et al. 2007). Furthermore, NL3R451C knock‐in (KI) mice exhibit opposite changes in parallel inhibitory systems (Földy et al. 2013), known to play distinct but complementary roles in network oscillations (Klausberger et al. 2005; Bartos et al. 2007). Hence, pair recordings between basket cells, expressing parvalbumin (PV+) or cholecystokinin (CCK), and CA1 pyramidal cells in the hippocampus unveiled a decrease of synaptic efficacy and a loss of tonic CB1 receptor‐dependent suppression of GABA release in PV+ and CCK+ interneurons, respectively (Földy et al. 2013).
Here, we report that in the somatosensory barrel cortex of juvenile NL3R451C KI mice, the impairment of GABA release from PV+ basket cells severely alters the E/I balance in layer IV neuronal microcircuit. This represents a critical issue, since PV+ cells, which are innervated by the same thalamic afferents to excitatory layer IV spiny neurons (Agmon and Connors 1991, 1992; Porter et al. 2001; Sun et al. 2006), play a pivotal role in sensory information, acting as an inhibitory gate for incoming thalamic inputs via feed‐forward disynaptic inhibition (Welker et al. 1993; Pinto et al. 2003).
Materials and Methods
Ethical approval
All experiments were performed in accordance with the European Community Council Directive of 24 November 1986 (86/609EEC) and were approved by local veterinary authorities and by SISSA ethical committee. All efforts were made to minimize animal suffering and to reduce the number of animal used.
Animals
NL3R451C KI mice (Tabuchi et al. 2007) were purchased from Jackson Laboratories (Bar Harbor, ME). Experiments were performed on off‐spring males derived from heterozygous mating. Some sets of experiments were performed on double KI off‐spring males obtained by mating heterozygous NL3R451C females with transgenic males expressing enhanced green fluorescent protein (EGFP) in a subpopulation of PV‐containing interneurons (Chattopadhyaya et al. 2004, kindly provided by Dr. A. Bacci, Paris). Electrophysiological experiments were performed and analyzed blind before genotyping. This was carried out on tail biopsy DNA by PCR using a standard protocol. At least five mice for each genotype were used in a given experiment. Control experiments were performed on wild‐type (WT) littermate males.
Cortical slices
Cortical slices were obtained from postnatal (P) day P9–P14 animals, using a standard protocol (Schubert et al. 2001). Briefly, after being anesthetized with CO2, animals were decapitated. The brain was quickly removed from the skull and placed in ice‐cold artificial CSF (ACSF) containing (in mmol/L): NaCl 130, glucose 10, KCl 3.5, NaHPO4 1.2, NaHCO3 25, CaCl2 2, MgCl2 1.3, saturated with 95% O2, and 5% CO2, pH = 7.3–7.4. Coronal slices (300 μm thick) were cut with a vibratome and stored at room temperature (22–24°C) in a holding bath containing the same solution as above. After incubation for at least 1 h, an individual slice was transferred to a submerged recording chamber and continuously superfused at 33–34°C with oxygenated ACSF at a rate of 2–3 mL/min.
Electrophysiology
A patch‐clamp amplifier (multiclamp 700b; Axon Instruments, Sunnyvale, CA) was used to record visually identified (with an upright microscope equipped with differential interference contrast optics and infrared video camera) spiny neurons and PV+ basket cells in layer IV of the somatosensory barrel cortex, using the whole‐cell patch‐clamp technique in voltage and current clamp modes. Patch electrodes were pulled from borosilicate glass capillaries (Hingelberg, Malsfeld, Germany); they had a resistance of 5–7 MΩ when filled with an intracellular solution containing (in mmol/L): K‐gluconate 150, HEPES 5, EGTA 1.1, MgCl2 0.5, phosphocreatinine 10. Membrane potential values were corrected for a liquid junction potential of ~16 mV (calculated with the Clampex software; Molecular Devices, Sunnyvale, CA). The stability of the patch was checked by repetitively monitoring the input and series resistance during the experiments. Cells exhibiting >15% changes in either series resistance or holding were excluded from the analysis. The series resistance was <20 MΩ and it was not compensated.
Excitatory postsynaptic currents (EPSCs) and inhibitory postsynaptic currents (IPSCs) were evoked by stimulating afferent fibers through a homemade monopolar silver electrode placed in layer IV or V depending on the experiment. The stimulation frequency was set at 0.1 Hz (stimulus duration 100 μs).
In the experiments in which the integration properties of spiny neurons were measured, inhibitory postsynaptic potentials (IPSPs) were recorded in current clamp mode (after bridge balance correction) using a stimulation intensity as the double respect to the threshold to elicit IPSPs without failures. Artificial (a) excitatory postsynaptic potentials (EPSPs) were simulated by somatic injection of an exponentially rising and falling voltage waveform as:
EPSP‐like waveforms had τon and τoff of 1.5 and 10 ms, respectively (Fricker and Miles 2000).
For pair recordings, the intracellular solution contained (in mmol/L): KCl 140, MgCl2 1, EGTA 0.5, MgATP 2, HEPES 10. Membrane potential values were corrected for a liquid junction potential of ~4 mV.
Data analysis
Data were transferred to a computer hard disk after digitization with an A/D converter (Digidata 1322; Molecular Devices). Data acquisition (digitized at 20 kHz and filtered at 3.3 kHz) was performed with pClamp 9.2 software (Molecular Devices). Input resistance (Rin) and cells capacitance were measured online with the membrane test feature of the pClamp software (Molecular Devices, Sunnyvale, CA). Whole‐cell patch‐clamp recordings in current‐clamp mode were used to identify the firing pattern of neurons, in order to distinguish between excitatory spiny neurons (regular spiking) and fast spiking, PV+ interneurons. The adaptation index (AI, Beierlein et al. 2003) was calculated as the ratio between the frequencies of the last and first two action potentials in a train elicited by injecting, at resting membrane potential (Vrest), a long (1600 ms) depolarizing current pulse (100 pA) in recorded neurons.
In voltage clamp experiments, mean EPSCs and IPSCs values were calculated by averaging at least 10 sweeps. The rise time was estimated as the time needed for 10–90% increase of the peak current response. The decay phase was fitted with an exponential function in the form:
where τi and Ai are the time constants and relative fractions of respective components. Synaptic currents were usually fitted with a single exponential. The success rate of unitary IPSCs was calculated as the percentage of successes over 50 trials. The pair pulse ratio (PPR) was measured as the mean peak amplitude of the synaptic response evoked by the second stimulus over that evoked by the first one (the two stimuli were 50 ms apart).
For statistical analysis, the normality of distributions was tested using the SigmaPlot software (Systat Software, San Jose, CA). If not stated differently, statistical significance was tested using unpaired Student's t‐test (pClamp software). For data that did not follow a Gaussian distribution, Kolmogorov–Smirnov's test was used. A P value < 0.05 was considered statistically significant. Values are given as mean ± SEM.
Drugs
Drugs were applied in the bath via a three‐way tap system, by changing the superfusion solution to one differing only in its content of drug(s). The ratio of flow rate to bath volume ensured complete exchange within 1–2 min. Drugs used were as follows: DL‐AP5, SR 95531 hydrobromide (gabazine), and DNQX purchased from Ascent Scientific (Bristol, UK). Stock solutions were made in distilled water and then aliquoted and frozen at −20°C. DNQX was dissolved in DMSO. The final concentration of DMSO in the bathing solution was 0.1%. At this concentration, DMSO alone did not modify the membrane potential, input resistance, or the firing properties of neurons.
Results
We first measured, in whole‐cell patch‐clamp experiments (in current and voltage clamp mode), the passive and active membrane properties of layer IV spiny neurons in the somatosensory barrel cortex of WT and NL3R451C KI mice. Comparable values of resting membrane potential (Vrest), membrane capacitance (C), and input resistance (Rin) were detected in both genotypes (Vrest: −60 ± 1 and −59 ± 1 mV, P = 0.62; C: 85 ± 3 and 86 ± 4 pF, P = 0.89; Rin: 312 ± 14 and 303 ± 21 MΩ, P = 0.71, in WT, n = 67, and in NL3R451C KI mice, n = 34, respectively). As expected (Feldmeyer et al. 1999), spiny neurons generated trains of adapting spikes in response to long lasting (1600 ms) depolarizing current pulses (100 pA). The firing frequency and the AI were similar in WT and NL3R451C KI mice (the firing frequency was 14 ± 0.7 and 14.4 ± 0.8 Hz, P = 0.73; the AI was 0.51 ± 0.03 and 0.54 ± 0.03, P = 0.47, in WT, n = 67, and in NL3R451C KI mice, n = 34, respectively). Taken together, these data indicate that, in both genotypes, recordings were performed from a homogeneous population of neurons, presumably layer IV spiny neurons, with similar passive and active membrane properties.
Altered E/I balance in layer IV barrel cortex neurons of NL3R451C KI mice
We monitored the amount of excitation and inhibition received by layer IV spiny neurons in response to activation of afferent fibers through a stimulating electrode placed in layer V (see schematic diagram of Fig. 1A). Repetitive stimulation of excitatory inputs at 5–40 Hz produced in both genotypes a robust short‐term depression (STD; Fig. 1B). EPSCs in the train were abolished by the application of DNQX (20 μmol/L), a selective α‐amino‐3‐hydroxy‐5‐methyl‐4‐isoxazolepropionic acid (AMPA) receptor antagonist (Fig. 1C). Afferent fibers undergoing STD were activated by single pulses, using a stimulation intensity 1.5‐fold the minimal necessary to evoked an EPSC followed by an IPSC and it was similar in both WT and NL3R451C KI mice (24 ± 6 V in WT, n = 24, and 25 ± 9 V, in NL3R451C KI mice, n = 13, P >0.88, unpaired t‐test).
Figure 1.
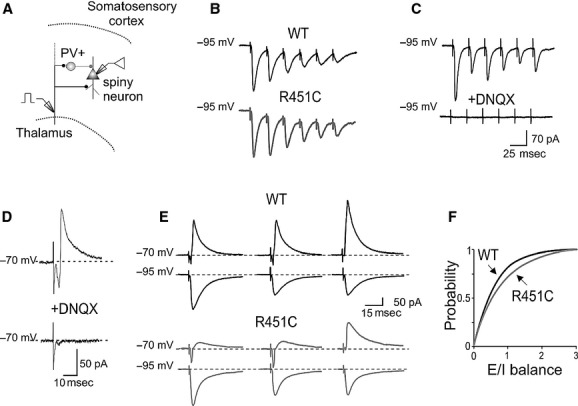
Altered excitatory/inhibitory (E/I) balance in NL3R451C knock‐in (KI) mice. (A) Schematic representation of the microcircuit in layer IV somatosensory cortex showing a PV+ interneuron (circle) and a spiny neuron (triangle). Note that both cells are innervated by the same thalamo‐cortical afferent. Afferent fibers are stimulated through an external electrode placed in layer V, while excitatory postsynaptic current (EPSC) and inhibitory postsynaptic current (IPSC) are recorded from spiny neuron by means of a patch pipette. (B) In both wild‐type (WT; black trace) and NL3 mutant (R451C, grey trace) mice, EPSCs (recorded at −95 mV that corresponds to ECl−) were depressed upon stimulation of afferent fibers at 40 Hz. (C) EPSCs evoked in spiny neurons by repetitive stimulation of afferent fibers were blocked by DNQX (20 μmol/L). (D) The EPSC/IPSC sequence was blocked by DNQX (20 μmol/L), indicating that inhibition was disynaptic. (E) Upper traces (on the left) represent EPSCs‐IPSCs sequences evoked by stimulation of afferent fibers (from a holding potential of −70 mV) in spiny neurons from WT (black) and NL3R451C KI mice (grey). Lower traces (on the left) represent isolated EPSCs evoked from the same cells at −95 mV. On the middle, traces digitally scaled to minimize the different driving forces. On the right, isolated EPSCs and IPSCs. IPSCs were obtained by subtracting scaled EPSCs recorded at −95 mV from the EPSCs‐IPSCs sequences recorded at −70 mV. (F) Cumulative probability curves of the E/I balance calculated for each cell by dividing the EPSC for the IPSC amplitudes in WT (black) and in NL3R451C KI mice (grey). The two curves were significantly different (P =0.0003, Kolmogorov–Smirnov's test).
At −70 mV, between the reversal potential for excitatory and IPSCs (the reversal potential for chloride, ECl−, was −95 mV), stimulation of afferent inputs evoked EPSCs followed with similar delays (2.0 ± 0.2 and 2.2 ± 0.2 ms, in WT, n = 24, and NL3R451C KI mice, n = 13, respectively, P = 0.53) by IPSCs. IPSCs were triggered in a feed‐forward disynaptic manner as demonstrated by the brief delays following EPSCs and by their block with DNQX (20 μmol/L; Fig. 1D). At −95 mV, corresponding to ECl−, EPSCs were recorded in isolation. Isolated IPSCs were measured after electronically subtracting at −70 mV EPSCs (after appropriate amplitude scaling for the different driving force) from the EPSCs/IPSCs sequences (Fig. 1E). After obtaining for each cell the mean EPSC and IPSC amplitudes, the E/I balance was calculated as the ratio between the peak amplitude of EPSCs and IPSCs. On average, this value was similar in WT and NL3R451C KI mice (0.70 ± 0.11 and 0.98 ± 0.22, in WT and NL3R451C KI mice, respectively). However, it is worth mentioning that in both genotypes the E/I ratios could not be distributed with a Gaussian function. Therefore, cumulative probability curves for this parameter were constructed. With respect to WT animals, in NL3R451C KI mice, the cumulative probability curve was shifted to the right and the difference was statistically significant (Fig. 1F; P =0.0003, Kolmogorov–Smirnov's test). These experiments clearly show that the NL3R451C mutation affects the E/I balance in layer IV somatosensory cortex microcircuit.
Reduced GABAA‐mediated feed‐forward inhibition in NL3R451C KI mice
The shift to the right of the cumulative probability curve for the E/I ratio observed in NL3R451C KI mice may be caused either by an enhanced excitation or by a reduced inhibition. Since in both WT and NL3R451C KI mice the direct excitatory drive to spiny neurons was not affected (similar EPSCs peak amplitude and latency values were found in both genotypes; EPSCs: 55 ± 13 and 67 ± 19 pA; latencies 2.3 ± 0.3 ms and 2.5 ± 0.3 in WT, n = 24, and in NL3R451C KI mice, n = 13, respectively; P =0.6 and P = 0.5, Student's t‐test, for differences in amplitudes and latencies; Fig. 1B), we hypothesized that the E/I unbalance results from a depressed GABAA‐mediated feed‐forward inhibition. Therefore, we analyzed pharmacologically isolated IPSCs (with DL‐AP5 20 μmol/L and DNQX 20 μmol/L, to block NMDA and AMPA/kainate receptors, respectively) evoked in principal cells by stimulation of afferents fibers in layer IV–V (Fig. 2A). The stimulation intensity was set as the minimal voltage necessary to evoke postsynaptic responses without failures. As shown in the representative samples of Figure 2B, in comparison with WT animals, IPSCs from NL3R451C KI mice were smaller in amplitude, in the absence of any clear change in their kinetics (see normalized overlapping traces on the right). Overall, the mean peak amplitudes of IPSCs were 54 ± 6 and 31 ± 3 pA in WT (n = 46) and NL3R451C KI mice (n = 26), respectively (Fig. 2C). This effect was associated with a reduced charge transfer (the areas underlying IPSCs were 976 ± 137 and 568 ± 93 pA*ms in WT and NL3R451C KI mice, respectively (Fig. 2B and D). These values were significantly different (P =0.008 for amplitude and P = 0.04 for area, Student's t‐test).
Figure 2.
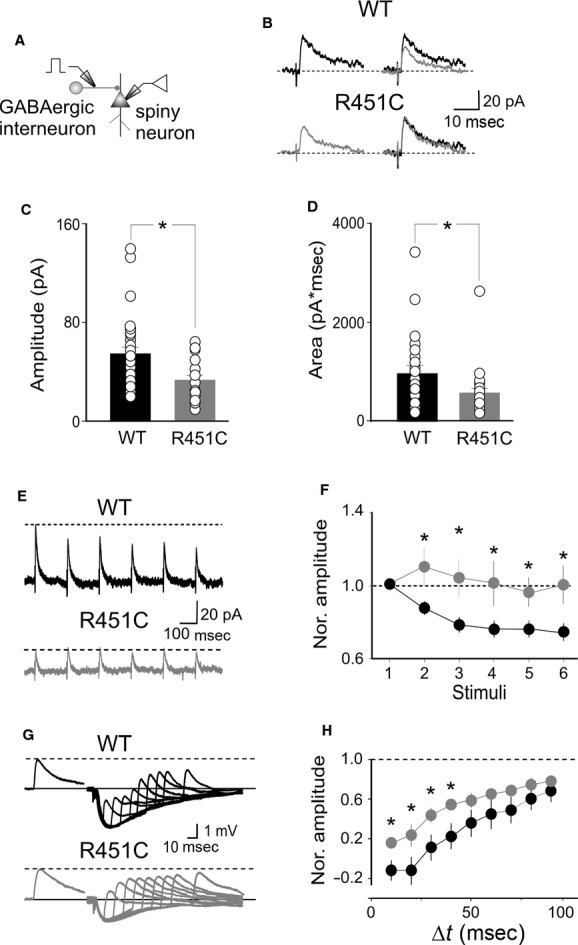
Reduced GABAA‐mediated feed‐forward inhibition in NL3R451C knock‐in (KI) mice. (A) Schematic representation of the experimental setting (see text). (B) On the left, representative traces (average of 10) of pharmacologically isolated inhibitory postsynaptic currents (IPSCs) evoked in spiny neurons by stimulation of GABAergic inputs in wild‐type (WT; black) and in NL3R451C KI mice (grey). On the right, IPSCs from the two genotypes are superimposed (upper traces) and normalized (lower traces). (C, D) Each column represents the mean amplitude (C) and area (D) of IPSCs obtained in individual cells (small circles) in WT (black) and NL3R451C KI mice (grey). (E) Sample traces of IPSCs evoked in spiny cells by stimulation of GABAergic inputs at 5 Hz in WT (black) and in NL3R451C KI mice (grey). Note the lack of synaptic depression in NL3R451C KI mice. (F) The amplitudes of consecutive IPSCs normalized to the first ones in WT (black) and in NL3R451C KI mice (grey). (G) Representative traces of a‐excitatory postsynaptic potentials (control traces on the left) injected in the soma of patched neurons at different time after the onset of IPSCs are superimposed in WT (black) and in NL3R451C KI mice (grey). (H) Plot of normalized mean a‐excitatory postsynaptic currents amplitude versus different times (Δt) in WT (black) and in NL3R451C KI mice (grey). In this and in the following Figures vertical bars refer to SEM. *P <0.05.
Inhibitory postsynaptic currents from WT animals were depressed upon repetitive stimulation of afferent fibers with short trains (six pulses) delivered at 5 Hz (black traces of Fig. 2E and F).
On average (n = 46), the amplitudes of consecutive IPSCs, normalized to those of the first ones, were as follows: 0.87 ± 0.03, 0.78 ± 0.03, 0.76 ± 0.04, 0.76 ± 0.04, and 0.74 ± 0.04. In contrast, in NL3R451C KI mice (n = 22), IPSCs remained stable during trains (mean values for consecutive normalized IPSCs evoked at 5 Hz frequency were as follows: 1.09 ± 0.10, 1.02 ± 0.11, 1.01 ± 0.12, 0.96 ± 0.07, 1.00 ± 0.10; gray traces of Fig. 2E and F). Differences between WT and KI mice were statistically significant (for the consecutive pulses: P =0.02; P = 0.008; P = 0.03; P = 0.015; P = 0.01, Student's t‐test).
The inability of GABAergic interneurons from NL3R451C KI mice to undergo frequency‐dependent STD as in littermate controls suggests that a presynaptic dysfunction likely dependent on a reduced probability of GABA release.
To verify how a reduced inhibition integrates incoming excitatory synaptic signals, artificial a‐EPSPs similar in shape to EPSPs evoked by afferent stimulation (~2 mV amplitude) were injected in both WT (n = 20) and NL3R451C KI mice (n = 22) through the somatic recording electrode at different times (Δt) after the onset of evoked IPSPs (Fig. 2G). Peak amplitudes of a‐EPSPs were measured with respect to IPSPs baseline at different Δt and normalized for the amplitude of a‐EPSPs obtained before IPSP stimulation (Fig. 2H). As shown in the Figure, the amplitudes of a‐EPSPs were larger in NL3R451C KI mice as compared to controls, and a statistically significant difference in the integration window was found between the two genotypes in the interval between 0 and 40 ms from the IPSPs onset (at 40 ms Δt, normalized a‐EPSPs amplitude was 0.22 ± 0.12 ms and 0.55 ± 0.07 in WT and NL3R451C KI mice, respectively, P =0.027 Student's t‐test, Fig. 2H). These data indicate that changes in the amount of shunting inhibition during IPSPs account for different integration properties of spiny neurons from NL3R451C KI mice with respect to controls.
The NL3R451C mutation does not affect the excitatory drive to PV+ interneurons
The reduced feed‐forward inhibition observed in spiny neurons following activation of PV+ cells can be attributed to a decreased excitatory input to PV+ interneurons or to a weaker synaptic transmission between PV+ interneurons and principal cells. To distinguish between these two possibilities, recordings were performed from WT and NL3R451C KI mice expressing EGFP in PV+ cells (lower panel of Fig. 3A). These cells exhibited all characteristics of fast spiking interneurons. Their passive membrane properties were comparable in both genotypes (Vrest −72 ± 2 and −69 ± 2 mV, P = 0.36, C: 85 ± 7 and 78 ± 7 pF, P = 0.5 and Rin: 248 ± 46 and 335 ± 66 MΩ, P = 0.28) in WT (n = 16) and NL3R451C KI mice (n = 12), respectively. In addition, in both genotypes, PV+ cells fired with similar frequency in response to long (1600 ms) 100 pA depolarizing current pulses (32 ± 3 and 31 ± 5 Hz in WT and in NL3R451C KI mice, respectively, P = 0.79; Figure 3B (see also Beierlein et al. 2003)).
Figure 3.
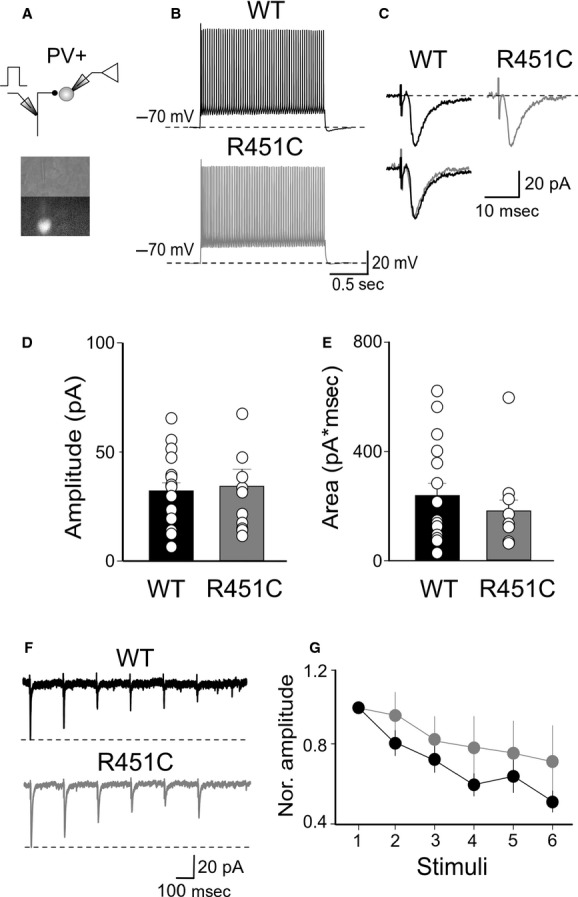
The NL3 R451C mutation does not affect the excitatory drive to PV+ cells. (A) Schematic representation of experimental setting; below, bright field and fluorescent images of the recorded PV+ interneuron. (B) Action potentials firing in response to depolarizing current pulses (100 pA for 1600 ms) in both wild‐type (WT; upper trace) and NL3R451C knock‐in (KI) mice (lower trace). (C) Excitatory postsynaptic current (EPSCs; average of 10, upper traces) evoked in enhanced green fluorescent protein‐positive PV‐expressing basket cells by stimulation of excitatory inputs in WT (black) and NL3R451C KI mice (grey). Below, the two traces are superimposed. (D, E) Each column represents the mean amplitude (D) and area (E) of EPSCs obtained in individual cells (small circles) in WT (black) and NL3R451C KI mice (grey). (F) Sample traces of EPSCs evoked in PV+ cells by stimulation of excitatory inputs at 5 Hz in WT (black) and in NL3R451C KI mice (grey). (G) The amplitudes of consecutive EPSCs normalized to the first ones in WT (black) and in NL3R451C KI mice (grey).
In the presence of DL‐AP5 (20 μmol/L) and gabazine (10 μmol/L) to block synaptic currents mediated by NMDA and GABAA receptors, respectively, stimulation of afferent fibers in layer V barrel cortex (Fig. 3A) evoked in EGFP‐labeled cells monosynaptic AMPA‐mediated EPSCs with similar characteristics. EPSCs did not show any statistically significant difference in terms of amplitude, charges transfer, and kinetics (amplitude: 31 ± 4 and 34 ± 8 pA, P = 0.77; area underlying EPSCs: 238 ± 46 and 185 ± 40 pA*ms, P = 0.41; rise time: 1.2 ± 0.2 and 1.5 ± 0.2 ms, P = 0.27; decay time: 11.3 ± 2.0 and 8.7 ± 1.1 ms, P = 0.28; in WT, n = 18, and NL3R451C KI mice, n = 15, respectively, Student's t‐test; Fig. 3C–E).
In addition, these synapses were highly reliable with almost no failures and exhibited STD (in response to six pulses stimulation delivered at 5 Hz) of comparable amplitude in both genotypes. On average, the normalized amplitude of sixth EPSC over the first one was 0.45 ± 0.07 and 0.68 ± 0.22 in WT (n = 18) and in NL3R451C KI mice (n = 15), respectively. These values were not statistically significant (P =0.22, Student's t‐test; Fig. 3E and F). These data allow excluding that in NL3R451C KI mice the reduced GABAergic signaling to spiny neurons is related to a decreased excitatory drive to PV+ interneurons.
Reduced probability of GABA release from PV+ cells into spiny neurons in NL3R451C KI mice
To verify whether changes in GABA release from PV+ cells into spiny neurons account for the observed depression of feed‐forward inhibition in NL3R451C KI mice, pair recordings from connected EGFP‐labeled, PV+ interneurons, and spiny neurons were performed (Fig. 4A). Pre‐ and postsynaptic cells were identified on the basis of their respective firing properties. Unitary IPSCs were triggered in spiny neurons by individual spikes, with low failure rate (Beierlein et al. 2003). On average, their peak amplitude was 195 ± 52 and 62 ± 13 pA in WT (n = 14) and in NL3R451C KI mice (n = 16), respectively, (their respective charges transfers were 2712 ± 652 and 1000 ±259 pA*ms, in WT and NL3R451C KI mice, respectively; Fig. 4B and C). Differences in IPSCs amplitudes and charge transfers were statistically significant (P = 0.017 and P =0.018, unpaired t‐test). In both the genotypes, IPSCs were completely abolished by the application of 10 μmol/L gabazine (n = 3).
Figure 4.
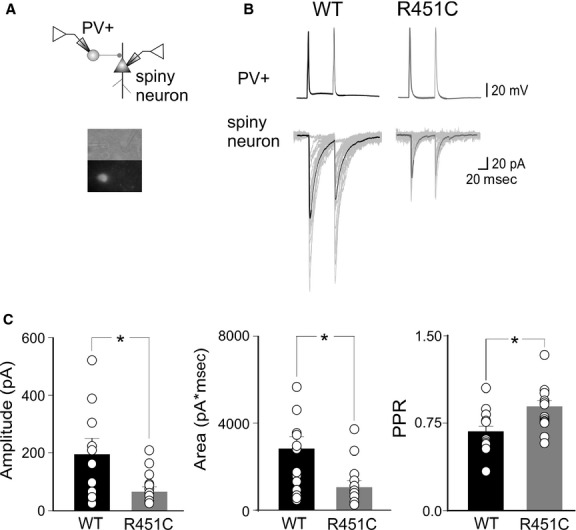
Reduced probability of GABA releases from PV+ cells into spiny neurons. (A) Schematic diagram showing pair recordings from a PV+ cell and a spiny neuron; below, bright field and fluorescent images of the recorded neurons. (B) Representative traces of unitary inhibitory postsynaptic currents (IPSCs) pairs plus failures (the average of 50 individual traces are superimposed) evoked in spiny cells by two action potentials in presynaptic neurons in wild‐type (WT; left) and in NL3R451C knock‐in (KI) mice (right). (C) Each graph represents the mean amplitude (left), area (middle), and pair pulse ratio (right) of unitary IPSCs obtained in individual cells (small circles) in WT (black) and NL3R451C KI mice (grey). *P <0.05.
Kinetics analysis of unitary IPSCs did not reveal changes between the two different genotypes (for WT, rise time 1.0 ± 0.1 ms and decay time 31.9 ± 1.9 ms; for NL3R451C KI mice, rise time 1.0 ± 0.1 ms and decay time 30.1 ± 2.3; P =0.77 and P = 0.55, unpaired t‐test). In addition, when unitary IPSCs were triggered by two spikes (50 ms apart), a significantly different PPR was observed between the WT and NL3R451C KI mice (0.66 ± 0.05 and 0.87 ± 0.05, in WT and NL3R451C KI mice, respectively; P =0.011, unpaired t‐test). This effect was associated with a slightly reduction, although not statistically significant (P =0.17, unpaired t‐test), of success rate (89 ± 4% and 79 ± 5%, in WT and in NL3R451C KI mice, respectively), and in the inversed squared of coefficient of variation (5.4 ± 1.7 and 3.6 ± 1.7 in WT and in NL3R451C KI mice, respectively, P = 0.3, unpaired t‐test). These results strongly suggest that the impairment of feed‐forward inhibition in NL3R451C KI mice involves a reduced probability of GABA release from PV+ cells into spiny neurons.
Discussion
The present data unveil an enhanced E/I balance in the microcircuit of layer IV somatosensory barrel cortex of NL3R451C KI mice dependent on the reduced feed‐forward GABAA‐mediated inhibition. This controls the temporal window for integrating excitatory inputs thus mimicking in a simple model what could happen in vivo during sensory information processing.
According to Földy et al. (2013), NL3R451C KI mice exhibit “different synaptic phenotypes in distinct brain regions”. Thus, conflicting results have been reported in layer II‐III somatosensory cortex (Tabuchi et al. 2007) and in the hippocampus (Földy et al. 2013; Pizzarelli and Cherubini 2013). In agreement with the results of Földy et al. (2013) obtained from the hippocampus, the present data from the barrel cortex clearly show that a dysfunction of the microcircuit between PV+ interneurons and principal cells may be the unifying event of this particular phenotype, regardless the brain region where it occurs.
Layer V stimulation can orthodromically activate thalamo‐cortical fibers (coming mainly from the ventro‐basal nucleus of the thalamus), fibers coming from layer V pyramidal neuron, and antidromically intracortical branches of cortico‐thalamic fibers (Ferster and Lindström 1985).
We assume that, in our experimental conditions (coronal section of barrel cortex), both EPSCs and IPSCs recorded from spiny neurons in response to the stimulation of afferent fibers in layer V were mainly thalamic in origin since EPSCs experienced a robust frequency‐dependent depression typical of thalamo‐cortical but not cortico‐thalamic inputs (Beierlein et al. 2003). In addition, the contribution of excitatory inputs from layer V to layer IV can be neglected since the connectivity between these two layers has been calculated to be <1% (Lefort et al. 2009). Moreover, it should be mentioned that IPSCs had a disynaptic origin since they were readily blocked by DNQX. The temporal delay of ~2 ms between EPSCs and IPSCs is compatible with a feed‐forward form of inhibition (Agmon and Connors 1992).
We can exclude the involvement of the feed‐back inhibition since the rather low stimulation intensity used (1.5‐fold the minimal necessary to evoke an EPSC/IPSC sequence) was far for reaching the threshold for action potential generation in spiny neurons.
Feed‐forward inhibition is mediated by PV+ cells (Staiger et al. 2009). The R451C mutation of NL3 severely affected the probability of GABA release from PV‐expressing cells. Thus, the reduced amplitude of pharmacologically isolated IPSCs in the absence of any modification of their kinetics, the lack of use‐dependent depression (thought to be the predominant form of short‐term dynamics in many CNS structures, including somatosensory cortex, Tsodyks and Markram 1997), the reduced amplitude of unitary IPSCs triggered in spiny cells by action potentials in EGFP‐positive cells containing PV, an effect associated with increase in PPR, reduction in successes rate and in the inversed square of the coefficient of variation favor a presynaptic type of action. Interestingly, in accord with the present data, a reduced probability of GABA release was detected also at synapses formed by PV+ basket cells onto CA1 pyramidal neurons in the hippocampus (Földy et al. 2013), indicating, as already mentioned, that the primary targets of the NL3 mutation are PV‐expressing basket cells, independently of the brain region where they are localized (see also Gogolla et al. 2009).
How can the NL3 mutation affect synaptic strength at PV+ basket‐principal cell synapses? NL3 is highly expressed in the brain where, unlike other postsynaptic adhesion molecules of the NLs family, is located at both glutamatergic and GABAergic synapses (Budreck and Scheiffele 2007; Levinson et al. 2010; Baudouin et al. 2012). Although the functional role of this adhesion molecule is still poorly understood, the R451C mutation leads to almost 90% retention of the protein in the endoplasmatic reticulum (Tabuchi et al. 2007), a condition that reduces the binding activity of the remaining molecules to β‐neurexin 1 (Kleijer et al. 2014). This may modify the transynaptic signaling of these molecules whose interaction with other partners remains largely unknown. Compatible with the multitude of effects of the R451C mutation on neurotransmission, as suggested by Földy et al. (2013), NLs may participate in the balance array of diverse functions possible via their interactions with multiple ligands.
In cortical neurons, precisely time‐locked responses are triggered by somatosensory stimuli (Phillips et al. 1988; Arabzadeh et al. 2005). Such temporal accuracy is essential for sensory representation and it is under the control of thalamo‐cortical feed‐forward inhibition (Gabernet et al. 2005). Therefore, alteration of the inhibitory gate in layer IV somatosensory cortex of NL3R451C KI mice may affect sensory processing in ASD patients leading to altered sensory representations with difficulties to combine pieces of information into a unified perceptual whole (Jasmin et al. 2009; Orekhova et al. 2012; Paton et al. 2012; Stevenson et al. 2014). In addition, the enhanced cortical excitability, resulting from the reduced feed‐forward inhibition, may profoundly impact on cortical states known to regulate many aspects of behavior (Poulet et al. 2012).
Whatever is the mechanism, the shift in the E/I balance observed here may destabilize synaptic circuits and may alter the generation of gamma rhythms (Brunel and Wang 2003; Mann and Mody 2008; Wright 2009), believed to be the neural correlates of high cognitive functions (Basar et al. 1999; Wang 2010). Rhythmic oscillations at gamma frequency strongly rely on the activity of fast‐spiking parvalbumin‐positive cells that have been proposed to represent reference signals for temporal coding and sensory binding in large neuronal ensembles (Bartos et al. 2007; Cardin et al. 2009; Sohal et al. 2009). Disruption of gamma rhythms may account for cognitive deficits found in ASD patients (Orekhova et al. 2007; Gross et al. 2012; Richard et al. 2013; Snijders et al. 2013).
Acknowledgment
We are grateful to Majid Moshtagh‐Khorasani for technical assistance in designing the a‐EPSP.
Conflict of Interest
None.
Footnotes
Funding Information
This study was partially supported by grants from Ministero dell'Istruzione, dell'Universita' e della Ricerca (PRIN 2011) and Telethon (GGP11043) to EC.
References
- Agmon A., Connors B. W. 1991. Thalamocortical responses of mouse somatosensory (barrel) cortex in vitro. Neuroscience; 41:365-379. [DOI] [PubMed] [Google Scholar]
- Agmon A., Connors B. W. 1992. Correlation between intrinsic firing patterns and thalamocortical synaptic responses of neurons in mouse barrel cortex. J. Neurosci.; 12:319-329. [DOI] [PMC free article] [PubMed] [Google Scholar]
- American Psychiatric Association. 2000Diagnostic and statistical manual of mental disorders Arlington, VA: American Psychiatric Association [Google Scholar]
- Arabzadeh E., Zorzin E., Diamond M. E. 2005. Neuronal encoding of texture in the whisker sensory pathway. PLoS Biol.; 3:e17. [DOI] [PMC free article] [PubMed] [Google Scholar]
- Bartos M., Vida I., Jonas P. 2007. Synaptic mechanisms of synchronized gamma oscillations in inhibitory interneuron networks. Nat. Rev. Neurosci.; 8:45-56. [DOI] [PubMed] [Google Scholar]
- Basar E., Basar‐Eroglu C., Karakas S., Schürmann M. 1999. Oscillatory brain theory: a new trend in neuroscience. IEEE Eng. Med. Biol. Mag.; 18:56-66. [DOI] [PubMed] [Google Scholar]
- Baudouin S. J., Gaudias J., Gerharz S., Hatstatt L., Zhou K., Punnakkal P. 2012. Shared synaptic pathophysiology in syndromic and nonsyndromic rodent models of autism. Science; 338:128-132. [DOI] [PubMed] [Google Scholar]
- Beierlein M., Gibson J. R., Connors B. W. 2003. Two dynamically distinct inhibitory networks in layer 4 of the neocortex. J. Neurophysiol.; 90:2987-3000. [DOI] [PubMed] [Google Scholar]
- Ben‐Ari Y., Gaiarsa J. L., Tyzio R., Khazipov R. 2007. GABA: a pioneer transmitter that excites immature neurons and generates primitive oscillations. Physiol. Rev.; 87:1215-1284. [DOI] [PubMed] [Google Scholar]
- Ben‐Ari Y., Khalilov I., Kahle K. T., Cherubini E. 2012. The GABA excitatory/inhibitory shift in brain maturation and neurological disorders. Neuroscientist; 18:467-486. [DOI] [PubMed] [Google Scholar]
- Brunel N., Wang X. J. 2003. What determines the frequency of fast network oscillations with irregular neural discharges? I. Synaptic dynamics and excitation‐inhibition balance. J. Neurophysiol.; 90:415-430. [DOI] [PubMed] [Google Scholar]
- Budreck E. C., Scheiffele P. 2007. Neuroligin‐3 is a neuronal adhesion protein at GABAergic and glutamatergic synapses. Eur. J. Neurosci.; 26:1738-1748. [DOI] [PubMed] [Google Scholar]
- Cardin J. A., Carlén M., Meletis K., Knoblich U., Zhang F., Deisseroth K. 2009. Driving fast‐spiking cells induces gamma rhythm and controls sensory responses. Nature; 459:663-667. [DOI] [PMC free article] [PubMed] [Google Scholar]
- Chattopadhyaya B., Di Cristo G., Higashiyama H., Knott G. W., Kuhlman S. J., Welker E. 2004. Experience and activity‐dependent maturation of perisomatic GABAergic innervation in primary visual cortex during a postnatal critical period. J. Neurosci.; 24:9598-9611. [DOI] [PMC free article] [PubMed] [Google Scholar]
- Cherubini E., Gaiarsa J. L., Ben‐Ari Y. 1991. GABA: an excitatory transmitter in early postnatal life. Trends Neurosci.; 14:515-519. [DOI] [PubMed] [Google Scholar]
- Chubykin A. A., Atasoy D., Etherton M. R., Brose N., Kavalali E., Gibson J. R. 2007. Activity‐dependent validation of excitatory versus inhibitory synapses by neuroligin‐1 versus neuroligin‐2. Neuron; 54:919-931. [DOI] [PMC free article] [PubMed] [Google Scholar]
- Etherton M., Földy C., Sharma M., Tabuchi K., Liu X., Shamloo M. 2011. Autism‐linked neuroligin‐3 R451C mutation differentially alters hippocampal and cortical synaptic function. Proc. Natl Acad. Sci. USA; 108:13764-13769. [DOI] [PMC free article] [PubMed] [Google Scholar]
- Feldmeyer D., Egger V., Lubke J., Sakmann B. 1999. Reliable synaptic connections between pairs of excitatory layer 4 neurones within a single ‘barrel’ of developing rat somatosensory cortex. J. Physiol.; 521:169-190. [DOI] [PMC free article] [PubMed] [Google Scholar]
- Ferster D., Lindström S. 1985. Augmenting responses evoked in area 17 of the cat by intracortical axon collaterals of cortico‐geniculate cells. J. Physiol.; 367:217-232. [DOI] [PMC free article] [PubMed] [Google Scholar]
- Földy C., Malenka R. C., Südhof T. C. 2013. Autism‐associated neuroligin‐3 mutations commonly disrupt tonic endocannabinoid signaling. Neuron; 78:498-509. [DOI] [PMC free article] [PubMed] [Google Scholar]
- Fricker D., Miles R. 2000. EPSP amplification and the precision of spike timing in hippocampal neurons. Neuron; 28:559-569. [DOI] [PubMed] [Google Scholar]
- Gabernet L., Jadhav S. P., Feldman D. E., Carandini M., Scanziani M. 2005. Somatosensory integration controlled by dynamic thalamocortical feed‐forward inhibition. Neuron; 48:315-327. [DOI] [PubMed] [Google Scholar]
- Gogolla N., Leblanc J. J., Quast K. B., Südhof T. C., Fagiolini M., Hensch T. K. 2009. Common circuit defect of excitatory‐inhibitory balance in mouse models of autism. J. Neurodev. Disord.; 1:172-181. [DOI] [PMC free article] [PubMed] [Google Scholar]
- Gross E., El‐Baz A. S., Sokhadze G. E., Sears L., Casanova M. F., Sokhadze E. M. 2012. Induced EEG gamma oscillation alignment improves differentiation between autism and ADHD group responses in a facial categorization task. J. Neurother.; 16:78-91. [DOI] [PMC free article] [PubMed] [Google Scholar]
- Jamain S., Quach H., Betancur C., Rastam M., Colineaux C., Gillberg I. C. 2003. Mutations of the x‐linked genes encoding neuroligins NLGN3 and NLGN4 are associated with autism. Nat. Genet.; 34:27-29. [DOI] [PMC free article] [PubMed] [Google Scholar]
- Jasmin E., Couture M., McKinley P., Reid G., Fombonne E., Gisel E. 2009. Sensori‐motor and daily living skills of preschool children with autism spectrum disorders. J. Autism Dev. Disord.; 39:231-241. [DOI] [PubMed] [Google Scholar]
- Kim H. G., Kishikawa S., Higgins A. W., Seong I. S., Donovan D. J., Shen Y. 2008. Disruption of neurexin 1 associated with autism spectrum disorder. Am. J. Hum. Genet.; 82:199-207. [DOI] [PMC free article] [PubMed] [Google Scholar]
- Klausberger T., Marton L. F., O'Neill J., Huck J. H., Dalezios Y., Fuentealba P. 2005. Complementary roles of cholecystokinin‐ and parvalbumin‐expressing GABAergic neurons in hippocampal network oscillations. J. Neurosci.; 25:9782-9793. [DOI] [PMC free article] [PubMed] [Google Scholar]
- Kleijer K. T., Schmeisser M. J., Krueger D. D., Boeckers T. M., Scheiffele P., Bourgeron T. 2014. Neurobiology of autism gene products: towards pathogenesis and drug targets. Psychopharmacology; 231:1037-1062. [DOI] [PubMed] [Google Scholar]
- Ko J., Zhang C., Arac D., Boucard A. A., Brunger A. T., Sudhof T. C. 2009. Neuroligin‐1 performs neurexin‐dependent and neurexin‐indipendent functions in synapses validation. EMBO J.; 28:3244-3255. [DOI] [PMC free article] [PubMed] [Google Scholar]
- Laumonnier F., Bonnet‐Brilhault F., Gomot M., Blanc R., David A., Moizard M. P. 2004. X‐linked mental retardation and autism are associated with a mutation in the NLGN4 gene, a member of the neuroligin family. Am. J. Hum. Genet.; 74:552-557. [DOI] [PMC free article] [PubMed] [Google Scholar]
- LeBlanc J. J., Fagiolini M. 2011. Autism: a “critical period” disorder? Neural. Plast.; 2011:921680. [DOI] [PMC free article] [PubMed] [Google Scholar]
- Lefort S., Tomm C., Floyd Sarria J. C., Petersen C. C. 2009. The excitatory neuronal network of the C2 barrel column in mouse primary somatosensory cortex. Neuron; 61:301-316. [DOI] [PubMed] [Google Scholar]
- Levinson J. N., Li R., Kang R., Moukhles H., El‐Husseini A., Bamji S. X. 2010. Postsynaptic scaffolding molecules modulate the localization of neuroligins. Neuroscience; 165:782-793. [DOI] [PubMed] [Google Scholar]
- Lin H. C., Gean P. W., Wang C. C., Chan Y. H., Chen P. S. 2013. The amygdala excitatory/inhibitory balance in a valproate‐induced rat autism model. PLoS One; 8:e55248. [DOI] [PMC free article] [PubMed] [Google Scholar]
- Mann E. O., Mody I. 2008. The multifaceted role of inhibition in epilepsy: seizure‐genesis through excessive GABAergic inhibition in autosomal dominant nocturnal frontal lobe epilepsy. Curr. Opin. Neurol.; 21:155-160. [DOI] [PubMed] [Google Scholar]
- Orekhova E. V., Stroganova T. A., Nygren G., Tsetlin M. M., Posikera I. N., Gillberg C. 2007. Excess of high frequency electroencephalogram oscillations in boys with autism. Biol. Psychiatry; 62:1022-1029. [DOI] [PubMed] [Google Scholar]
- Orekhova E. V., Tsetlin M. M., Butorina A. V., Novikova S. I., Gratchev V. V., Sokolov P. A. 2012. Auditory cortex responses to clicks and sensory modulation difficulties in children with autism spectrum disorders (ASD). PLoS One; 7:e39906. [DOI] [PMC free article] [PubMed] [Google Scholar]
- Paton B., Hohwy J., Enticott P. G. 2012. The rubber hand illusion reveals proprioceptive and sensorimotor differences in autism spectrum disorders. J. Autism Dev. Disord.; 42:1870-1883. [DOI] [PubMed] [Google Scholar]
- Phillips J. R., Johnson K. O., Hsiao S. S. 1988. Spatial pattern representation and transformation in monkey somatosensory cortex. Proc. Natl Acad. Sci. USA; 85:1317-1321. [DOI] [PMC free article] [PubMed] [Google Scholar]
- Pinto D. J., Hartings J. A., Brumberg J. C., Simons D. J. 2003. Cortical damping: analysis of thalamocortical response transformations in rodent barrel cortex. Cereb. Cortex; 13:33-44. [DOI] [PubMed] [Google Scholar]
- Pizzarelli R., Cherubini E. 2011. Alterations of GABAergic signaling in Autism Spectrum Disorders. Neural. Plast.; 2011:297153. [DOI] [PMC free article] [PubMed] [Google Scholar]
- Pizzarelli R., Cherubini E. 2013. Developmental regulation of GABAergic signalling in the hippocampus of neuroligin 3 R451C knock‐in mice: an animal model of Autism. Front. Cell. Neurosci.; 7:85. [DOI] [PMC free article] [PubMed] [Google Scholar]
- Porter J. T., Johnson C. K., Agmon A. 2001. Diverse types of interneurons generate thalamus‐evoked feedforward inhibition in the mouse barrel cortex. J. Neurosci.; 21:2699-26710. [DOI] [PMC free article] [PubMed] [Google Scholar]
- Poulet J. F., Fernandez L. M., Crochet S., Petersen C. C. 2012. Thalamic control of cortical states. Nat. Neurosci.; 15:370-372. [DOI] [PubMed] [Google Scholar]
- Poulopoulus A., Aramuni G., Meyer G., Soykan T., Hoon M., Papadopoulos T. 2009. Neuroligin2 drives postsynaptic assembly at perisomatic inhibitory synapses through gephyrin and collybistin. Neuron; 63:628-642. [DOI] [PubMed] [Google Scholar]
- Ramamoorthi K., Lin Y. 2011. The contribution of GABAergic dysfunction to neurodevelopmental disorders. Trends Mol. Med.; 17:452-462. [DOI] [PMC free article] [PubMed] [Google Scholar]
- Richard A. E., Lajiness‐O'Neill R. R., Bowyer S. M. 2013. Impaired prefrontal gamma band synchrony in autism spectrum disorders during gaze cueing. NeuroReport; 24:894-897. [DOI] [PubMed] [Google Scholar]
- Scheiffele P., Fan J., Choih J., Fetter R., Serafini T. 2000. Neuroligin expressed in nonneuronal cells triggers presynaptic development in contacting axons. Cell; 101:657-669. [DOI] [PubMed] [Google Scholar]
- Schubert D., Staiger J. F., Cho N., Kötter R., Zilles K., Luhmann H. J. 2001. Layer‐specific intracolumnar and transcolumnar functional connectivity of layer V pyramidal cells in rat barrel cortex. J. Neurosci.; 21:3580-3592. [DOI] [PMC free article] [PubMed] [Google Scholar]
- Snijders T. M., Milivojevic B., Kemner C. 2013. Atypical excitation‐inhibition balance in autism captured by the gamma response to contextual modulation. Neuroimage Clin.; 3:65-72. [DOI] [PMC free article] [PubMed] [Google Scholar]
- Sohal V. S., Zhang F., Yizhar O., Deisseroth K. 2009. Parvalbumin neurons and gamma rhythms enhance cortical circuit performance. Nature; 459:698-702. [DOI] [PMC free article] [PubMed] [Google Scholar]
- Staiger J. F., Zuschratter W., Luhmann H. J., Schubert D. 2009. Local circuits targeting parvalbumin‐containing interneurons in layer IV of rat barrel cortex. Brain Struct. Funct.; 214:1-13. [DOI] [PMC free article] [PubMed] [Google Scholar]
- Stevenson R. A., Siemann J. K., Schneider B. C., Eberly H. E., Woynaroski T. G., Camarata S. M. 2014. Multisensory temporal integration in autism spectrum disorders. J. Neurosci.; 34:691-697. [DOI] [PMC free article] [PubMed] [Google Scholar]
- Südhof T. C. 2008. Neuroligins and neurexins link synaptic function to cognitive disease. Nature; 455:903-911. [DOI] [PMC free article] [PubMed] [Google Scholar]
- Sun Q. Q., Huguenard J. R., Prince D. A. 2006. Barrel cortex microcircuits: thalamocortical feedforward inhibition in spiny stellate cells is mediated by a small number of fast‐spiking interneurons. J. Neurosci.; 26:1219-1230. [DOI] [PMC free article] [PubMed] [Google Scholar]
- Tabuchi K., Blundell J., Etherton M. R., Hammer R. E., Liu X., Powell C. M. 2007. A neuroligin‐3 mutation implicated in autism increases inhibitory synaptic transmission in mice. Science; 318:71-76. [DOI] [PMC free article] [PubMed] [Google Scholar]
- Tsodyks M. V., Markram H. 1997. The neural code between neocortical pyramidal neurons depends on neurotransmitter release probability. Proc. Natl Acad. Sci. USA; 94:719-723. [DOI] [PMC free article] [PubMed] [Google Scholar]
- Varoqueaux F., Aramuni G., Rawson R. L., Mohrmann R., Missler M., Gottmann K. 2006. Neuroligins determines synapses maturation and function. Neuron; 51:741-754. [DOI] [PubMed] [Google Scholar]
- Wang X. J. 2010. Neurophysiological and computational principles of cortical rhythms in cognition. Physiol. Rev.; 90:1195-1268. [DOI] [PMC free article] [PubMed] [Google Scholar]
- Welker E., Armstrong‐James M., Van der Loos H., Kraftsik R. 1993. The mode of activation of a barrel column: response properties of single units in the somatosensory cortex of the mouse upon whisker deflection. Eur. J. Neurosci.; 5:691-712. [DOI] [PubMed] [Google Scholar]
- Wright J. J. 2009. Generation and control of cortical gamma: findings from simulation at two scales. Neural. Netw.; 22:373-384. [DOI] [PubMed] [Google Scholar]
- Yan J., Oliveira G., Coutinho A., Yang C., Feng J., Katz C. 2005. Analysis of the neuroligin 3 and 4 genes in autism and other neuropsychiatric patients. Mol. Psychiatry; 10:329-332. [DOI] [PubMed] [Google Scholar]
- Zhang Z., Sun Q. Q. 2011. The balance between excitation and inhibition and functional sensory processing in the somatosensory cortex. Int. Rev. Neurobiol.; 97:305-333. [DOI] [PubMed] [Google Scholar]
- Zikopoulos B., Barbas H. 2013. Altered neural connectivity in excitatory and inhibitory cortical circuits in autism. Front. Hum. Neurosci.; 7:609. [DOI] [PMC free article] [PubMed] [Google Scholar]