

Abstract
Noble gas pulmonary magnetic resonance imaging (MRI) is transitioning away from 3He to 129Xe gas, but the physiological/clinical relevance of 129Xe apparent diffusion coefficient (ADC) parenchyma measurements is not well understood. Therefore, our objective was to generate 129Xe MRI ADC for comparison with 3He ADC and with well‐established measurements of alveolar structure and function in older never‐smokers and ex‐smokers with chronic obstructive pulmonary disease (COPD). In four never‐smokers and 10 COPD ex‐smokers, 3He (b = 1.6 sec/cm2) and 129Xe (b = 12, 20, and 30 sec/cm2) ADC, computed tomography (CT) density‐threshold measurements, and the diffusing capacity for carbon monoxide (DLCO) were measured. To understand regional differences, the anterior–posterior (APG) and superior–inferior (∆SI) ADC differences were evaluated. Compared to never‐smokers, COPD ex‐smokers showed greater 3He ADC (P = 0.006), 129Xe ADCb12 (P = 0.006), and ADCb20 (P = 0.006), but not for ADCb30 (P > 0.05). Never‐smokers and COPD ex‐smokers had significantly different APG for 3He ADC (P = 0.02), 129Xe ADCb12 (P = 0.006), and ADCb20 (P = 0.01), but not for ADCb30 (P > 0.05). ∆SI for never‐ and ex‐smokers was significantly different for 3He ADC (P = 0.046), but not for 129Xe ADC (P > 0.05). There were strong correlations for DLCO with 3He ADC and 129Xe ADCb12 (both r = −0.95, P < 0.05); in a multivariate model 129Xe ADCb12 was the only significant predictor of DLCO (P = 0.049). For COPD ex‐smokers, CT relative area <−950 HU (RA950) correlated with 3He ADC (r = 0.90, P = 0.008) and 129Xe ADCb12 (r = 0.85, P = 0.03). In conclusion, while 129Xe ADCb30 may be appropriate for evaluating subclinical or mild emphysema, in this small group of never‐smokers and ex‐smokers with moderate‐to‐severe emphysema, 129Xe ADCb12 provided a physiologically appropriate estimate of gas exchange abnormalities and alveolar microstructure.
Keywords: Apparent diffusion coefficient, COPD, emphysema, hyperpolarized 3He MRI, hyperpolarized 129Xe MRI
We aimed to better understand how 129Xe MRI measurements might explain well‐established measurements of emphysema, and explored different 129Xe MRI apparent diffusion coefficients (ADCs) in a small group of older never‐smokers and ex‐smokers with chronic obstructive pulmonary disease (COPD). In the same visit, 3He ADC, the diffusing capacity of carbon monoxide and computed tomography (CT) emphysema measurements were acquired. In this small group of older never‐smokers and ex‐smokers with COPD, 129Xe ADCb12 provided a physiologically appropriate estimate of gas exchange abnormalities and alveolar microstructure.
Introduction
Magnetic resonance imaging (MRI) using hyperpolarized noble gases 3He and 129Xe provides high spatial and temporal resolution images of pulmonary gas distribution (Kauczor et al. 1997; de Lange et al. 1999; Moller et al. 2002). Parenchymal microstructure can also be probed using diffusion‐weighted (DW) imaging. DW imaging takes advantage of the gases rapid molecular diffusion to generate 3He and 129Xe apparent diffusion coefficients (ADCs; Saam et al. 2000; Salerno et al. 2002). Although the first demonstrations of inhaled hyperpolarized gas MRI used 129Xe gas (Albert et al. 1994; Mugler et al. 1997), until recently, most examinations in subjects with chronic obstructive pulmonary disease (COPD) used 3He gas mainly due to the nearly threefold higher gyromagnetic ratio and higher polarizations – both of which independently contribute to greater image quality for 3He MRI. These previous studies showed that 3He ADC values are reproducible in emphysematous subjects (Morbach et al. 2005; Diaz et al. 2008; Mathew et al. 2008), sensitive to lung microstructure and airspace size (Saam et al. 2000; Salerno et al. 2002), and correlate with spirometry (Salerno et al. 2002; Diaz et al. 2009), diffusing capacity of carbon monoxide (DLCO; Fain et al. 2006), and x‐ray computed tomography (CT) measurements of emphysema (Diaz et al. 2009). Importantly, 3He MRI ADC measurements were directly compared with stereological measurements of fixed lung tissue and this showed the high sensitivity of 3He MRI ADC to lung surface area abnormalities in emphysematous tissue (Woods et al. 2006). Despite these important findings, 3He MRI is unlikely to be used clinically because of its relatively high cost and low abundance (Fain et al. 2010). On the other hand, 129Xe gas is substantially more abundant, relatively inexpensive, and clinical quantities may be polarized in 30–60 min (Mugler et al. 1997, 2004). Because of this, there is considerable interest in transitioning to 129Xe MRI.
Although 129Xe gas is capable of transmembrane diffusion (Cleveland et al. 2010) this leads to adverse systemic effects when used in high concentrations; Xe has been widely and safely used in pulmonary CT (Chae et al. 2008; Honda et al. 2012), cerebral blood flow imaging (Carlson et al. 2011), and lung scintigraphy (Suga 2002). Recent 129Xe MRI safety studies demonstrated that the gas concentrations compatible with MRI are well tolerated in healthy subjects and those with respiratory disease (Driehuys et al. 2012; Shukla et al. 2012). Previous work showed that 129Xe ADC (b = 12 sec/cm2; Kaushik et al. 2011) and 129Xe ADC morphometry measurements (Ouriadov et al. 2013) provide a way to distinguish between age‐matched subjects with and without COPD. Moreover, although strong and significant correlations for 3He ADC with 129Xe ADC (b = 12 sec/cm2) were reported (Kirby et al. 2012d), significantly lower 129Xe as compared to 3He MRI ventilation was observed in COPD ex‐smokers (Kirby et al. 2013) and asthmatics (Svenningsen et al. 2013). Regions of diminished 129Xe as compared to 3He ventilation are spatially related to emphysematous regions (Kirby et al. 2013) in COPD subjects.
It is important to consider the different self‐diffusion coefficients of 3He and 129Xe gases. For example, 129Xe gas has a much lower diffusion coefficient than 3He and, therefore, in order to achieve sufficient diffusion weighting for 129Xe MRI to derive meaningful lung microstructural information, appropriately large b values and diffusion times must be applied (Sukstanskii and Yablonskiy 2012). However, increasing the diffusion weighting is coupled with a reduction in image signal‐to‐noise ratio (SNR); therefore it is important to experimentally demonstrate the 129Xe ADC b value that provides the optimal balance between sensitivity to the lung microstructural abnormalities and feasibility with respect to image SNR. It is also essential to investigate the different 129Xe MRI ADC b values and their associations with other emphysema measurements in order to better understand how imaging estimates are related to physiological measurements in COPD patients. Previous studies have focused on 129Xe ADC generated with a b value of 12 sec/cm2 (Kaushik et al. 2011; Kirby et al. 2012d), and therefore here we aimed to (i) determine whether 129Xe ADC generated using b values of 12, 20, and 30 sec/cm2 and contemporaneously acquired 3He ADC (Kirby et al. 2013), distinguishes older never‐smokers from ex‐smokers with COPD, (ii) compare 3He and 129Xe ADC in the superior–inferior (SI) and anterior–posterior (AP) lung regions to better understand potential dependencies for b value with regional ADC, and (iii) determine the significant associations of 129Xe ADC with b values of 12, 20, and 30 sec/cm2 with DLCO and CT measurements of emphysema, similar to those recently used in the COPDGene (Regan et al. 2010), CanCOLD (Bourbeau and Saad 2013), ECLIPSE (Vestbo and Anderson 2008), and SPIROMICS (Couper et al. 2014) studies.
Materials and Methods
Subjects
All subjects provided written informed consent to the study protocol that was approved by the local research ethics board and Health Canada. COPD subjects were ex‐smokers with a smoking history of at least 10 pack‐years between 50 and 85 years of age and categorized according to the Global Initiative for Chronic Lung Disease (2013) (GOLD) spirometry criteria. Healthy older never‐smokers (<1 pack‐year over their lifetime and no smoking in last 20 years) were enrolled who had no history of previous chronic or current respiratory disease.
Pulmonary function tests
A body plethysmograph (MedGraphics Corporation, Saint Paul, MN) with the attached gas analyzer was used to measure airflow, lung volumes, and DLCO according to ATS/ERS guidelines (Macintyre et al. 2005; Miller et al. 2005; Wanger et al. 2005).
Image acquisition
Magnetic resonance imaging was performed on a whole body 3.0 Tesla Discovery 750MR (General Electric Health Care, Milwaukee, WI) MRI system with broadband imaging capability. Subjects were instructed to inhale a gas mixture from a 1.0L Tedlar® bag (Jensen Inert Products, Coral Springs, FL) from functional residual capacity (FRC) and image acquisition was performed under breath‐hold conditions (Parraga et al. 2007).
Hyperpolarized 3He MRI was enabled using a linear bird‐cage transmit/receive chest coil (RAPID Biomedical GmbH, Wuerzburg, Germany; Farag et al. 2012). A turn‐key system (HeliSpin™, Polarean Inc, Durham, NC) was used to polarize 3He gas to 30–40% and doses (5 mL/kg body weight) diluted with N2 were administered in 1.0L Tedlar® bags. Hyperpolarized 3He MRI diffusion‐weighted imaging was performed using a 2D multislice fast gradient‐recalled echo sequence (FGRE; 14 sec total data acquisition, repetition time [TR]/echo time [TE]/flip angle = 7.6 msec/3.7 msec/8°, field of view [FOV] = 40 × 40 cm, matrix 128 × 128, seven slices, 30 mm slice thickness, 0 gap) during breath hold (Parraga et al. 2007) for acquisition of two interleaved images with and without additional diffusion sensitization with b = 1.6 sec/cm2 (maximum gradient amplitude [G] = 1.94 G/cm, rise and fall time = 0.5 msec, gradient duration = 0.46 msec, diffusion time = 1.46 msec).
Hyperpolarized 129Xe MRI was enabled using a custom‐made, quadrature‐asymmetric bird‐cage coil model tuned to 35.34 MHz, as described previously (Farag et al. 2012). The XeBox‐E10 polarizer system (XeBox‐E10; Xemed LLC, Durham, NH) was used to polarize the 129Xe gas (86% enriched) to 10–60%. In contrast to the 3He gas doses which were determined according to the subjects’ body weight, for 129Xe MRI a 50/50 mixture of 129Xe and 4He gas was obtained by dispensing 129Xe directly into 1.0L Tedlar® bags prefilled with 4He. Polarization of the diluted dose was quantified with use of a Polarimeter (Polarean, Durham, NC). 129Xe MRI DW images were obtained using a 2D multislice FGRE sequence; two interleaved images (16 sec total data acquisition, TE/TR/flip angle = 9.8 msec/11.0 msec/5°, bandwidth = 31.25 kHz, FOV = 40 × 40 cm, matrix 128 × 80, seven slices, 30 mm slice thickness, 0 gap) with and without additional diffusion sensitization with b = 12 sec/cm2 (G = 2.90 G/cm, rise and fall time = 0.5 msec, gradient separation = 2.0 msec, gradient duration = 2.0 msec, diffusion time = 5 msec), b = 20 sec/cm2 (G = 3.75 G/cm, rise and fall time = 0.5 msec, gradient separation = 2.0 msec, gradient duration = 2.0 msec, diffusion time = 5 msec), and b = 30 sec/cm2 (G = 4.60 G/cm, rise and fall time = 0.5 msec, gradient separation = 2 msec, gradient duration = 2.0 msec, diffusion time = 5 msec) were acquired in separate image acquisitions, as described previously (Kirby et al. 2012d; Boudreau et al. 2013).
Computed tomography was performed on a 64‐slice Lightspeed VCT scanner (GEHC, Milwaukee, WI). A single spiral acquisition of the entire lung was acquired from apex to base with subjects in breath‐hold condition after inhalation of N2 from a 1.0L Tedlar® bag (detector configuration of 64 × 0.625 mm, 120 kVp, 100 effective mA, tube rotation time of 500 msec, and a pitch of 1.0). Reconstruction of the data was performed using a standard convolution kernel and a slice thickness of 1.25 mm.
Image analysis
3He ADC and 129Xe ADC with b values of 12 sec/cm2 (ADCb12), 20 sec/cm2 (ADCb20), and 30 sec/cm2 (ADCb30) were generated as described previously (Kirby et al. 2012b). Briefly, we first segmented the 3He MRI non‐DW images using k‐means cluster algorithm as described previously for 3He MRI segmentation (Kirby et al. 2012a). The segmented binary mask for the non‐DW images was applied to the DW images. The ADC maps were generated on a voxel‐by‐voxel basis according to equation 1:
where b = 1.6 sec/cm2, S0 = the segmented non‐DW image, and S = the diffusion‐weighted image. The regional differences in ADC were evaluated for all AP coronal slices and for each coronal slice in three SI regions of interest (ROIs). The AP gradient (APG) was defined as the slope of the line of best fit that described the change in ADC as a function of distance in centimeters for all slices in the anterior to posterior direction. The three SI ROI were generated by dividing the center coronal slice into three equivalent ROIs from apex to base and applying those boundaries to all slices. ∆SI was the mean change in ADC in the superior and inferior ROI. To compare 3He and 129Xe ADC ∆SI and APG to better understand any dependency on b value for regional ADC differences in the respective gases, we compared the older never‐smokers to the COPD subjects, as well as to only the COPD ex‐smokers with emphysema. COPD subjects without emphysema are unlikely to show an increased 3He or 129Xe ADC ∆SI and APG difference compared to the older never‐smokers. The SNR for 3He and 129Xe DW images and nondiffusion‐weighted (NDW) images were determined by calculating the mean voxel value within a 5 × 5 voxel ROI for four representative ROI within the lung parenchyma, and dividing by the standard deviation of the mean voxel values for four representative 5 × 5 voxel ROI within the image background where there was no lung structure, for each slice. SNR was determined for each slice and then averaged to obtain a single SNR value for each subject image.
Quantitative CT measurements were performed using the Pulmonary Workstation 2.0 (VIDA Diagnostics, Inc., Coralville, IA); the relative area with attenuation values below −950 Hounsfield Units (HU; RA950), −910 HU (RA910), and −856 HU (RA856) were generated (Gevenois et al. 1996) as well as the CT HU value at which 15% of the voxels in the frequency distribution histogram have a lower density (HU15%). A CT density threshold for emphysema of RA950 > 6.8% was adopted based on a previous study that reported RA950 = 6.8% as the upper 95% limit of predicted normal values (Gevenois et al. 1996).
Qualitative visual scoring was also performed by an expert chest radiologist (R. E.‐R.) using a method adapted from Bankier et al. (1996). Emphysema scores were based on the percentage of low attenuation, tissue destruction, and vascular disruption.
Statistical methods
A Mann–Whitney unpaired two‐tailed t‐test was performed for statistical comparison of all pulmonary function measurements, 3He and 129Xe ADC, 3He and 129Xe ADC APG, and 3He and 129Xe ADC SI using GraphPad Prism version 4.00 (GraphPad Software Inc., San Diego, CA). A one‐way analysis of variance (ANOVA) was used for statistical comparison of the mean SNR values for ADC DW images for 3He and 129Xe with all three b values using IBM SPSS Statistics 20.0 (SPSS Inc., Chicago, IL). Linear regression (r2) and Pearson correlation coefficients (r) were used to determine the relationships between imaging and other measurements using GraphPad. A Holm–Bonferroni correction (Van Bell et al. 2004) was used to correct for multiple tests. Multivariate linear regression modeling was used to evaluate the relationship between DLCO and 3He ADC, 129Xe ADCb12, 129Xe ADCb20, and 129Xe ADCb30 as well as between CT density measurements and 3He ADC, 129Xe ADCb12, 129Xe ADCb20, and 129Xe ADCb30 using PROC REG in SAS ® 9.2 Software (SAS Institute Inc., Cary, NC). In all statistical analyses, results were considered significant when the probability of making a Type I error was <5% (P < 0.05).
Results
Study subjects and pulmonary function
Table 1 shows all demographic and pulmonary function measurements for four older never‐smokers and 10 COPD ex‐smokers (GOLD Class I: n = 1; GOLD Class II: n = 6; GOLD Class III: n = 2; GOLD Class IV: n = 1). Although there were no significant differences in age, sex, or BMI, the never‐smokers and COPD ex‐smokers were significantly different with respect to FEV1 (P = 0.01), FEV1/FVC (P = 0.002), TLC (P = 0.02), RV (P = 0.02), FRC (P = 0.01), and DLCO (P = 0.006).
Table 1.
Subject demographics and pulmonary function measurements
| Older never‐smokers (n = 4) | All COPD (n = 10) | COPD with emphysema (n = 7) | |
|---|---|---|---|
| Age years (±SD) | 67 (13) | 74 (4) | 74 (4) |
| Female sex | 2 | 2 | 2 |
| Weight kg (±SD) | 72 (11) | 77 (22) | 68 (18) |
| BMI kg/m2 (±SD) | 26.4 (2.8) | 25.4 (5.0) | 23.6 (4.6) |
| FEV1%pred (±SD) | 103 (6) | 57 (24)* | 52 (27)* |
| FVC%pred (±SD) | 102 (8) | 91 (19) | 92 (22) |
| FEV1/FVC (±SD) | 0.76 (0.02) | 0.46 (0.14)* | 0.40 (0.13)* |
| TLC%pred (±SD) | 102 (8) | 115 (8)* | 118 (7)* |
| RV%pred (±SD) | 102 (9) | 159 (46)* | 167 (54) |
| RV/TLC (±SD) | 0.39 (0.09) | 0.53 (0.14) | 0.55 (0.16) |
| IC%pred (±SD) | 113 (16) | 85 (31) | 77 (32) |
| FRC%pred (±SD) | 93 (15) | 141 (35)* | 154 (34)* |
| DLCO%pred (±SD) | 104 (12) | 41 (17)* | 36 (13)* |
SD, standard deviation; BMI, body mass index; FEV1, forced expiratory volume in 1 sec; %pred, percent predicted; FVC, forced vital capacity; TLC, total lung capacity; RV, reserve volume; IC, inspiratory capacity; FRC, functional residual capacity; DLCO, carbon monoxide diffusion capacity of the lung.
Significant difference (P < 0.05) between older never‐smokers and chronic obstructive pulmonary disease (COPD) subjects.
CT measurements of emphysema
Table 2 shows mean CT density thresholds (RA950, RA910, RA856, HU15%) and CT emphysema scores for the COPD ex‐smokers, by subject. For all COPD ex‐smokers, mean RA950, RA910, RA856, HU15%, and emphysema score were 18.8 ± 14.1%, 39.6 ± 20.6%, 65.0 ± 16.0%, −948 ± 30 HU, and 1.1 ± 0.7, respectively, consistent with mild emphysema. Subjects 2 (RA950 = 5.3%), 4 (RA950 = 1.5%), and 9 (RA950 = 2.1%) did not have CT evidence of emphysema (RA950 < 6.8%). For only the COPD ex‐smokers with emphysema, mean RA950, RA910, RA856, HU15%, and visual CT scoring measurements were 25.5 ± 10.9%, 48.9 ± 15.8%, 71.1 ± 12.4%, −964 ± 16 HU, and 1.4 ± 0.6, respectively.
Table 2.
Subject listing of 3He and 129Xe magnetic resonance imaging ADC and computed tomography (CT) measurements
| Subject | ADC measurements | CT measurements | |||||||
|---|---|---|---|---|---|---|---|---|---|
| 3He ADCb = 1.6 (cm2/sec) | 129Xe ADCb = 12 (cm2/sec) | 129Xe ADCb = 20 (cm2/sec) | 129Xe ADCb = 30 (cm2/sec) | RA950 (HU) | RA910 (HU) | RA856 (HU) | HU15% (HU) | Visual score | |
| Older never‐smokers | |||||||||
| 1 | 0.247 | 0.048 | 0.048 | 0.040 | – | – | – | – | – |
| 2 | 0.230 | 0.049 | 0.049 | 0.035 | – | – | – | – | – |
| 3 | 0.215 | 0.049 | 0.049 | 0.036 | – | – | – | – | – |
| 4 | 0.242 | 0.053 | 0.053 | 0.042 | – | – | – | – | – |
| All (±SD) | 0.223 (0.014) | 0.050 (0.002) | 0.044 (0.002) | 0.038 (0.003) | – | – | – | – | – |
| Chronic obstructive pulmonary disease Ex‐Smokers | |||||||||
| 1 | 0.611 | 0.096 | 0.081 | – | 33.33 | 49.35 | 67.78 | −981 | 2.35 |
| 2 | 0.305 | 0.057 | 0.057 | – | 5.26 | 30.43 | 67.90 | −930 | 0.16 |
| 3 | 0.531 | 0.087 | 0.078 | – | 32.07 | 65.81 | 85.86 | −972 | 1.55 |
| 4 | 0.320 | 0.058 | 0.050 | – | 1.53 | 9.13 | 36.68 | −895 | 0.43 |
| 5 | 0.591 | 0.095 | 0.088 | – | 36.83 | 66.19 | 84.28 | −975 | 0.89 |
| 6 | 0.617 | 0.095 | 0.070 | – | 34.25 | 60.48 | 79.03 | −977 | – |
| 7 | 0.504 | 0.085 | 0.079 | 0.064 | 12.12 | 31.56 | 60.64 | −943 | 0.83 |
| 8 | 0.474 | 0.083 | 0.072 | 0.055 | 16.77 | 40.14 | 66.75 | −954 | 1.40 |
| 9 | 0.283 | 0.056 | 0.046 | – | 2.12 | 13.38 | 47.61 | −907 | 0.34 |
| 10 | 0.526 | 0.092 | 0.076 | 0.052 | 13.22 | 29.00 | 53.02 | −945 | 1.49 |
| All (±SD) | 0.476 (0.128) | 0.080 (0.017) | 0.070 (0.014) | 0.057 (0.006) | 18.75 (14.11) | 39.55 (20.56) | 64.95 (15.95) | −948 (30) | 1.05 (0.71) |
ADC, apparent diffusion coefficient; SNR, signal‐to‐noise ratio; RA950, relative area with attenuation values below −950 HU; RA910, relative area with attenuation values below −910 HU; RA856, relative area with attenuation values below −856 HU; HU15%, the hounsfield unit value at which 15% of the voxels in the frequency distribution histogram have a lower density.
Hyperpolarized MRI ADC
Figure 1 shows the central coronal 3He ADC, 129Xe ADCb12, 129Xe ADCb20, and 129Xe ADCb30 maps for an older never‐smoker and two COPD ex‐smokers. ADC maps appear brighter and more heterogeneous for the COPD ex‐smokers in comparison with the healthy never‐smoker for 3He MRI as well as for 129Xe MRI for all b values. As shown in Figure 2, there were statistically significantly greater ADC values for all COPD ex‐smokers as well as only those COPD ex‐smokers with emphysema in comparison to the older never‐smokers for 3He ADC (all COPD: P = 0.002; COPD with emphysema: P = 0.006), 129Xe ADCb12 (all COPD: P = 0.002; COPD with emphysema: P = 0.006), and 129Xe ADCb20 (all COPD: P = 0.04; COPD with emphysema: P = 0.006), but not for 129Xe ADCb30 (P = 0.06).
Figure 1.

Hyperpolarized 3He apparent diffusion coefficient (ADC) and 129Xe ADC maps for a representative older never‐smoker and two chronic obstructive pulmonary disease (COPD) ex‐smokers. 3He ADC and 129Xe ADC maps with b value of 12 sec/cm2 (ADCb = 12), 20 sec/cm2 (ADCb = 20), and 30 sec/cm2 (ADCb = 30) of the coronal center slice for an older never‐smoker (79‐year‐old male, FEV1 = 96%pred, FEV1/FVC = 74%) and two COPD ex‐smokers (top: 71‐year‐old male, FEV1 = 107%pred, FEV1/FVC = 58%; bottom: 76‐year‐old male, FEV1 = 35%pred, FEV1/FVC = 31%).
Figure 2.
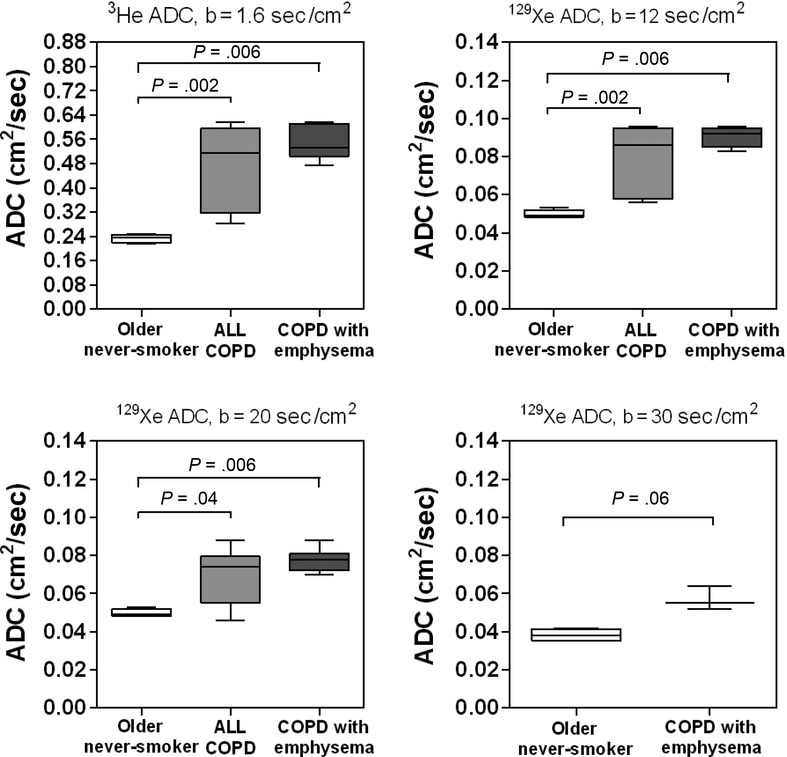
3He and 129Xe magnetic resonance imaging apparent diffusion coefficient (ADC) measurements for older never‐smokers, all chronic obstructive pulmonary disease (COPD) ex‐smokers, and COPD ex‐smokers with emphysema. Box‐and‐Whisker plot where box extends from the 25th to 75th percentiles of ADC values, the line within the box is the median ADC value and error bars are the minimum and maximum ADC values. Significance of difference (P < 0.05) determined using a Mann–Whitney unpaired two‐tailed t‐test.
For all subjects, mean SNR was statistically significantly greater for 3He DW images (3He DW SNR = 34 ± 19) in comparison with 129Xe DW images with b value = 12 sec/cm2 (129Xe DW SNR = 12 ± 7, P < 0.0001), b value = 20 sec/cm2 (129Xe DW SNR = 10 ± 7, P < 0.0001), and b value = 30 sec/cm2 (129Xe DW SNR = 4 ± 1, P < 0.0001), however, there was no significant difference between mean 129Xe DW SNR for all b values (P > 0.05). Importantly, for all subjects there was no significant correlation between SNR and ADC for 3He (r = 0.32, P = 0.27), 129Xe ADCb12 (r = 0.47, P = 0.09), and 129Xe ADCb20 (r = 0.50, P = 0.07), however, there was a significant correlation between SNR and 129Xe ADCb30 (r = 0.84, P = 0.02). For all subjects, mean SNR was statistically significantly greater for 3He NDW, or b =0, images (3He NDW SNR = 65 ± 39) than for 129Xe NDW images with b value = 12 sec/cm2 (129Xe NDW SNR = 29 ± 21, P = 0.008), b value = 20 sec/cm2 (129Xe NDW SNR = 33 ± 26, P = 0.02), and b value = 30 sec/cm2 (129Xe NDW SNR = 18 ± 11, P = 0.003), however, there was no significant difference between mean 129Xe NDW SNR for all b values (P > 0.05).
ADC regional differences
Figure 3 shows the 3He and 129Xe MRI ADC anterior–posterior gradients (APG) for older never‐smokers as well as all COPD ex‐smokers and only the COPD ex‐smokers with emphysema. There were statistically significantly greater APG for the COPD ex‐smokers than the older never‐smokers for 129Xe ADCb12 (P = 0.04) and 129Xe ADCb20 (P = 0.04), but not for 3He ADC (P > 0.05) or 129Xe ADCb30 (P > 0.05); there were also statistically significantly greater APG for the COPD ex‐smokers with emphysema than the older never‐smokers for 3He ADC (P = 0.02), 129Xe ADCb12 (P = 0.006), and 129Xe ADCb20 (P = 0.01), but not for 129Xe ADCb30 (P > 0.05).
Figure 3.

3He and 129Xe magnetic resonance imaging apparent diffusion coefficient (ADC) anterior–posterior gradients (APG) for older never‐smokers, all chronic obstructive pulmonary disease (COPD) ex‐smokers, and COPD ex‐smokers with emphysema. Box‐and‐Whisker plot where box extends from the 25th to 75th percentiles of ADC values, the line within the box is the median ADC APG value and error bars are the minimum and maximum ADC APG values. Significance of difference (P < 0.05) determined using a Mann–Whitney unpaired two‐tailed t‐test.
Figure 4 shows the ADC in the superior and inferior ROI for the older never‐smokers, all COPD ex‐smokers and only the COPD ex‐smokers with emphysema. For the COPD ex‐smokers with emphysema, mean 3He ADC was statistically significantly greater in the superior ROI than the inferior ROI (P = 0.04), however, there were no other significant SI ADC differences in 3He or 129Xe MRI.
Figure 4.
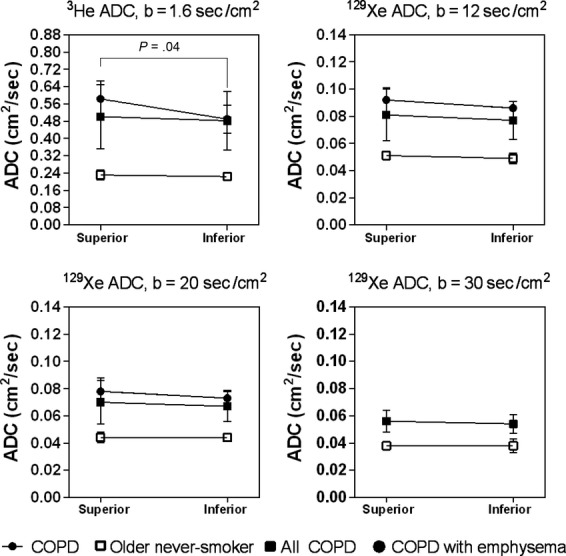
3He and 129Xe magnetic resonance imaging (MRI) apparent diffusion coefficient (ADC) for superior and inferior regions of interest in older never‐smokers, all chronic obstructive pulmonary disease (COPD) ex‐smokers, and COPD ex‐smokers with emphysema. There was a significant difference in mean ADC in the superior to inferior lung regions between the older never‐smokers and the COPD ex‐smokers with emphysema for 3He MRI ADC (P = 0.04), but there were no other significant differences. Significance of difference (P < 0.05) determined using a Mann–Whitney unpaired two‐tailed t‐test.
ADC relationships with pulmonary function and CT
Figure 5 shows Pearson correlations for DLCO with 3He ADC, 129Xe ADCb12, 129Xe ADCb20, and 129Xe ADCb30 for all subjects. There were significant correlations for DLCO with 3He ADC (r = −0.95, P = 0.003), 129Xe ADCb12 (r = −0.95, P = 0.002), and 129Xe ADCb20 (r = −0.87, P = 0.01), however, the correlation for DLCO with 129Xe ADCb30 (r = −0.89, P = 0.008 uncorrected, P = 0.10 corrected) was no longer significant following Holm–Bonferroni correction.
Figure 5.

Correlations for 3He and 129Xe apparent diffusion coefficient (ADC) with DLCO in all subjects. DLCO was significantly correlated with 3He ADC (r = −0.95, r2 = 0.90, P < 0.0001, Holm–Bonferroni corrected P = 0.003, y = −0.0044x + 0.69), 129Xe ADCb = 12 (r = −0.95, r2 = 0.90, P < 0.0001, Holm–Bonferroni corrected P = 0.002, y = −0.00056x + 0.11), 129Xe ADCb = 20 (r = −0.87, r2 = 0.76, P = 0.0005, Holm–Bonferroni corrected P = 0.01, y = −0.00042x + 0.088), and 129Xe ADCb = 30 (r = −0.89, r2 = 0.78, P = 0.008, Holm–Bonferroni corrected P = 0.10, y = −0.00029x + 0.069). Dotted lines indicate the 95% limits of agreement.
The Pearson correlation coefficients between CT lung density thresholds (RA950, RA910, RA856, HU15%) and visual CT emphysema scores are shown in Table 3. Following Holm–Bonferroni correction, 3He ADC was significantly correlated with RA950 (r = 0.90, P = 0.008) and HU15% (r = −0.92, P = 0.004); 129Xe ADCb12 was significantly correlated with RA950 (r = 0.85, P = 0.03) and HU15% (r = −0.90, P = 0.008); 129Xe ADCb20 was significantly correlated with HU15% (r = −0.86, P = 0.02); 129Xe ADCb30 was not significantly correlated with any CT emphysema measurements.
Table 3.
Correlations for 3He and 129Xe apparent diffusion coefficient (ADC) with computed tomography emphysema measurements for chronic obstructive pulmonary disease ex‐smokers
| Pearson correlation coefficients r (p/p1) | ||||
|---|---|---|---|---|
| 3He ADC (cm2/sec) | 129Xe ADCb12 (cm2/sec) | 129Xe ADCb20 (cm2/sec) | 129Xe ADCb30 (cm2/sec) | |
| RA950 (HU) | 0.90 (0.0004/0.008) | 0.85 (0.002/0.03) | 0.79 (0.006/0.09) | −0.49 (0.68/1.00) |
| RA910 (HU) | 0.82 (0.004/0.06) | 0.77 (0.009/0.11) | 0.78 (0.008/0.11) | −0.06 (0.96/0.96) |
| RA856 (HU) | 0.67 (0.04/0.32) | 0.63 (0.05/0.35) | 0.69 (0.03/0.27) | 0.30 (0.81/1.00) |
| HU15% (HU) | −0.92 (0.0002/0.004) | −0.90 (0.0004/0.008) | −0.86 (0.001/0.02) | 0.44 (0.71/1.00) |
| Visual Score | 0.79 (0.01/0.11) | 0.76 (0.02/0.20) | 0.66 (0.05/0.30) | −0.38 (0.75/1.00) |
Holm–Bonferroni adjusted significance values.
Table 4 shows the results of multiple linear regression models with 3He ADC, 129Xe ADCb12, 129Xe ADCb20, and 129Xe ADCb30 as the predictor variables. In the multivariate regression model for DLCO with 3He and all 129Xe ADC values included, 129Xe ADCb12 (P = 0.049) was the only significant predictor. In the multivariate regression model for RA950 with 3He and all 129Xe ADC values included, the only significant predictor was 3He ADC (P = 0.03). We also evaluated the multivariate regression model for HU15%, and although the overall model was statistically significant (P < 0.05), 3He ADC, 129Xe ADCb12, or 129Xe ADCb20 were not significant predictors.
Table 4.
Multivariate linear regression model for DLCO and computed tomography RA950 with 3He and 129Xe apparent diffusion coefficient (ADC)
| Variable | Parameter estimate | Standard error | Fold change | P‐value |
|---|---|---|---|---|
| Model 1: DLCO | ||||
| 3He ADCb1.6 | 663.85 | 218.63 | 3.04 | 0.09 |
| 129Xe ADCb12 | −4974.20 | 1153.94 | −4.31 | 0.049 |
| 129Xe ADCb20 | −1165.39 | 795.22 | −1.47 | 0.28 |
| 129Xe ADCb30 | −935.27 | 539.89 | −1.73 | 0.23 |
| Model 2: RA950 | ||||
| 3He ADCb1.6 | 306.93 | 107.64 | 2.85 | 0.03 |
| 129Xe ADCb12 | −1821.20 | 929.23 | −1.96 | 0.10 |
| 129Xe ADCb20 | 292.72 | 370.07 | 0.79 | 0.46 |
| 129Xe ADCb30 | – | – | – | – |
Statistically significant P‐values (P < 0.05) are presented in bold.
Discussion
The low and variable polarization levels and low diffusivity of 129Xe gas results in technical challenges for extracting physiologically meaningful pulmonary microstructural information based on 129Xe MRI. Moreover, although previous studies (Kaushik et al. 2011; Kirby et al. 2013, 2012d) reported 129Xe ADC based on a b value of 12 sec/cm2, it is still unclear how to provide the optimal balance between sensitivity to the lung microstructural abnormalities in emphysematous patients and feasibility with respect to image quality. Moreover, 129Xe MRI ADC generated using different b values may access different regions of the lung and likely probe different lung microstructure length scales thereby providing somewhat different spatial information relative to 3He ADC. For a better understanding of these measurements, we investigated the different 129Xe MRI ADC b values and their associations with anatomical and physiological measurements of COPD in a small but well‐characterized group of older never‐smokers and COPD ex‐smokers.
We observed (i) significantly greater ADC values for COPD ex‐smokers compared to older never‐smokers for 3He ADC, 129Xe ADCb12, and ADCb20, but not for 129Xe ADCb30, (ii) significantly greater anterior–posterior ADC differences in COPD ex‐smokers with emphysema compared to older never‐smokers for 3He ADC, 129Xe ADCb12, and ADCb20, but not for 129Xe ADCb30, (iii) significantly different mean ADC in the superior as compared to inferior lung regions between older never‐smokers and COPD ex‐smokers for 3He ADC, but not for 129Xe ADC, and finally, (iv) strong and significant correlations for 3He and 129Xe ADC with DLCO and CT measurements of emphysema, but in a multivariate model, 129Xe ADCb12 was the only significant predictor of DLCO and 3He ADC was the only significant predictor of CT measured RA950.
As expected, we observed significantly greater (worse) ADC for COPD ex‐smokers than for older never‐smokers for 3He, and as well for 129Xe ADCb12 and ADCb20, but not for 129Xe ADCb30. There was a large difference in mean ADC between subject subgroups for both 3He and 129Xe MRI, and this important finding suggested that both 129Xe MRI generated using b values of 12 and 20 sec/cm2 provide adequate sensitivity to lung microstructural abnormalities. These data are also in agreement with previous findings (Kaushik et al. 2011) that 129Xe ADCb12 can be used to distinguish between older never‐smokers and COPD subjects with emphysema. However, we must point out that 129Xe ADCb30 was not significantly different between subject subgroups and this may have been due to the low sample size as well as low SNR. For ADCb30, we demonstrated that the diffusion attenuation curves deviate from single exponential behavior after b = 20 sec/cm2, suggesting greater diffusion anisotropy (Ouriadov et al. 2013) compared to ADCb12 and ADCb20, and this greatly influences image quality, which was poor for ADCb30 images here. It is important to note that while SNR was not significantly different for 129Xe MRI acquired at all three b values, there was a significant correlation between image SNR and ADC for 129Xe ADCb30 only, suggesting that there may have been inadequate image quality to derive reliable ADC measurements. Clearly these are important considerations when optimizing and selecting pulse sequence parameters since image signal is expected to be reduced when the gradient amplitude is increased.
Second, there were statistically significantly greater APG for the COPD ex‐smokers with emphysema than the older never‐smokers for 3He ADC, 129Xe ADCb12, and ADCb20, but not for 129Xe ADCb30. DW MRI is sensitive to changes in the lung microstructure (Saam et al. 2000; Salerno et al. 2002) and is therefore an indirect measure of airspace size. Since the DW images were acquired in breath‐hold condition in the supine position, the measurement of the ADC on a slice‐by‐slice basis can be exploited to measure compression of the dependent lung due to gravity. Several studies have reported lower ADC values in the dependent (or posterior) lung slices relative to the nondependent anterior lung slices for 3He MRI (Fichele et al. 2004; Evans et al. 2007; Diaz et al. 2008) and 129Xe MRI with b = 12 sec/cm2 (Kaushik et al. 2011), which is expected due to compression of the lung parenchyma in healthy never‐smokers. However, in subjects with emphysema, the gradient in alveolar expansion in the gravity‐dependent direction is reduced, in part, because of gas trapping (Evans et al. 2007; Diaz et al. 2008). The finding that 129Xe ADCb12 anterior–posterior gradients were also reduced in the COPD ex‐smokers with emphysema in comparison to healthy never‐smokers is in agreement with these previous studies (Evans et al. 2007; Diaz et al. 2008; Kaushik et al. 2011). Furthermore, the finding that 129Xe ADCb20 anterior–posterior gradients were also reduced in the COPD ex‐smokers with emphysema in comparison to healthy never‐smokers suggests that 129Xe MRI with b =20 sec/cm2 also provides a way to evaluate microstructural abnormalities.
Third, there was a significant difference in mean ADC in the superior as compared to inferior lung regions between the older never‐smokers and the COPD ex‐smokers with emphysema for 3He ADC, but not for any 129Xe ADC. It is important to note that in contrast with the results reported here, previous studies evaluating the 129Xe ADC SI gradients in older never‐smokers demonstrated elevated ADC values in the inferior lung regions (Sindile et al. 2007) or elevated ADC values the superior lung regions (Kaushik et al. 2011). It is clear that because of the lower diffusion coefficient of pure 129Xe gas, more heterogeneous gas mixing within the lung is likely to occur during image acquisition and this may, in part, explain the discrepancies in these previous reports. However, the 129Xe/4He gas mixture used in this study may have allowed more homogeneous mixing within the lung resulting in the lower SI gradient seen in the older never‐smokers, which is to be expected in healthy volunteers without emphysema. Although it is unclear why elevated ADC was demonstrated in the superior lung regions in comparison to the inferior lung regions for 3He MRI, but not for 129Xe MRI in the COPD ex‐smokers with emphysema, these differences may be explained by the different lung regions accessed by the gases, as shown in Figure 1, due to the different densities and viscosities of the gas mixtures. In this regard, we previously demonstrated significantly greater ventilation abnormalities for 129Xe MRI than 3He MRI in the same COPD ex‐smokers (Kirby et al. 2012d). In a regional evaluation of 3He and 129Xe ADC, we showed that mean ADC in lung regions accessed by 3He gas only were significantly greater than in the remaining lung (Kirby et al. 2013), suggesting that the more emphysematous lung regions filled more readily with 3He as compared to 129Xe gas. By extension therefore, if here the 3He gas more readily filled the centrilobular emphysematous regions within the upper lobe, this may explain the greater SI differences for 3He MRI. However, it is important to note that based on the estimated self‐diffusion coefficients for the 3He and 129Xe gas mixtures (0.211 and 0.826 cm2/sec for 129Xe/4He and 3He/N2, respectively; Kirby et al. 2012d), 129Xe gas is a better estimate of room air, which has an estimated self‐diffusion coefficient of 0.218 cm2/sec, as compared to the 3He gas mixture. Taken together this suggests that due to the different physical properties of 129Xe, the distribution of the 129Xe gas mixture that is imaged during a breath‐hold condition may more accurately reflect the regional distribution of oxygen gas mixed in room air as compared to 3He gas mixtures used during imaging.
Finally, we demonstrated strong and significant correlations for 3He ADC, 129Xe ADCb12, and ADCb20 with DLCO and CT measurements of emphysema. DW gradients and diffusion time influence the measured ADC, and more importantly, they influence the spatial scale that the gas is probing (Woods et al. 2005). Therefore, 3He ADC and 129Xe ADC with different b‐values may provide different sensitivities to different lung microstructural environments and abnormalities. We investigated this by evaluating the relationship for DLCO and CT lung density thresholds with 3He and 129Xe ADC. We observed strong correlations for 3He ADC, 129Xe ADCb12, and ADCb20, further suggesting that 129Xe DW imaging is sensitive to the same lung microstructural abnormalities as 3He ADC with b value 1.6 cm2/sec. However, we must also note that although strong and significant univariate correlations were observed for 3He and 129Xe ADC with DLCO, in the multivariate regression model 129Xe ADCb12 was the only significant predictor of DLCO. In contrast, 3He ADC was the only significant predictor of RA950. Although CT density‐threshold measurements correlate with pathology measurements of emphysema on resected lung specimens (Avni et al. 1996), it has been suggested that CT is not sensitive to subclinical or more mild emphysema (Muller et al. 1988; Miller et al. 1989). DLCO, on the other hand, despite low reproducibility, has been shown to be a very sensitive measure of early or mild subclinical emphysematous abnormalities. A recent study demonstrated elevated levels of endothelial microparticles in smokers with abnormally low DLCO but normal spirometry (Gordon et al. 2011). Furthermore, in ex‐smokers without COPD, elevated 3He ADC, worse symptoms and exercise capacity were reported in subjects with abnormal as compared to normal DLCO (Kirby et al. 2013). Since 129Xe gas has a lower diffusivity than 3He, we hypothesized that 129Xe MRI with greater diffusion weighting may be more sensitive to early or mild emphysema. The finding that 129Xe MRI was the only significant predictor of DLCO lends support to this notion.
The diffusion time of 5 msec was selected for 129Xe MRI (Sukstanskii and Yablonskiy 2012; Boudreau et al. 2013) in order to probe a similar spatial length scale as 3He, and using this diffusion time, the characteristic diffusion lengths were approximately 0.49 and 0.46 mm for 3He and 129Xe, respectively. For these diffusion lengths, it is likely that both 3He and 129Xe gas atoms diffused beyond a single alveolus (diameter ~0.20 mm; Ochs et al. 2004) to a distal respiratory bronchiole (diameter ~0.40 mm; Horsfield and Cumming 1968). Although the majority of the COPD subjects evaluated in this study had moderate‐to‐severe emphysema, future studies, perhaps with improved polarization levels, should investigate the sensitivity of different 129Xe MRI imaging parameters, including different diffusion weighting and diffusion times, for evaluating emphysematous changes in subjects with more mild disease. Importantly, in our previous investigations we have demonstrated 129Xe MRI gas distribution measurements were more sensitive to airway wall abnormalities in asthmatics (Svenningsen et al. 2013) and to emphysematous bullae in COPD (Kirby et al. 2013). These findings suggest that due to the different physical properties of 129Xe gas compared to 3He gas, 129Xe may be more sensitive for the detection of airway obstruction and may therefore also be more sensitive for the detection of airway obstruction in patients with early or subclinical disease. However, this will need to be confirmed in future 129Xe MRI investigations.
We also believe that 129Xe MRI DW imaging may provide increased sensitivity for evaluating emphysematous changes in subjects with more mild disease. In this regard, we must acknowledge that 129Xe ADCb30 may not provide an appropriate estimate of emphysema in subjects with moderate‐to‐severe disease. In regions of the lung with significant emphysema, the 129Xe gas diffusion coefficient is likely strong enough to destroy the MRI signal in that region due to the greater 129Xe diffusion weighting, and the only signal remaining in the lung will be from the nonemphysematous lung microstructure. Therefore, the measured ADC values will reflect the healthier lung parenchyma, and not the emphysematous regions. However, in very early or mild subclinical disease, this may in fact be advantageous, as any small increase in airspace size will result in a reduction in signal intensity in the DW images. 129Xe ADCb30, due to the greater diffusion weighting may therefore provide greater sensitivity to mild microstructural changes than 3He ADC or 129Xe ADCb12, although this cannot be ascertained by the current study.
We recognize that this work was limited by several factors. First, the small number of subjects evaluated and in particular the small number of subjects in the 129Xe ADCb30 group, certainly limits the generalizability of these results. Another important limitation for both 3He and 129Xe ADC measurements is that these cannot be reported for the regions of the lung that are poorly or not ventilated. Such unventilated or poorly ventilated lung regions may be due to small airway occlusion, mucous plugs, airway wall thickening and inflammation, severe emphysema, or bullous disease. Previous studies (Kaushik et al. 2011; Kirby et al. 2012a) comparing 3He and 129Xe in COPD suggest that 129Xe gas distribution is sensitive to emphysematous bullae, and this is another consideration when performing 129Xe DW imaging in COPD subjects.
In summary, we evaluated 129Xe ADC b values of 12, 20, and 30 sec/cm2 in the same older never‐smokers and COPD ex‐smokers and compared these with 3He ADC, DLCO, and CT measurements of emphysema. We showed that 3He ADC and 129Xe ADCb12 or ADCb20 distinguished subjects with and without COPD. Although strong correlations for both 3He and 129Xe ADC were observed with DLCO and CT measurements of emphysema, in a multivariate analysis 129Xe ADCb12 was the only significant predictor of DLCO. However, 129Xe ADCb30 may be appropriate for evaluating subclinical or mild emphysema, in this small group of older never‐smokers and ex‐smokers with moderate‐to‐severe emphysema, 129Xe ADCb12 provided a physiologically appropriate estimate of gas exchange abnormalities and alveolar microstructure, providing good evidence to support future 129Xe MRI studies of emphysema.
Acknowledgments
We thank S. McKay and S. Blamires for subject recruitment, clinical coordination, and clinical database management; A. Wheatley for production and dispensing of 3He gas; and T. Szekeres for MRI of research volunteers.
Footnotes
Funding Information
This study was funded by the Canadian Institutes of Health Research. M. Kirby gratefully acknowledges Ph.D. scholarship support from the Natural Sciences and Engineering Research Council (NSERC, Canada) and G. Parraga gratefully acknowledges support from a Canadian Institutes of Health Research (CIHR) New Investigator Award. Ongoing research funding from CIHR Team Grant CIF# 97687 (Thoracic Imaging Network of Canada, TinCAN) is also gratefully acknowledged.
References
- Albert M. S., Cates G. D., Driehuys B., Happer W., Saam B., Springer C. S., Jr 1994. Biological magnetic resonance imaging using laser‐polarized 129Xe. Nature; 370:199-201. [DOI] [PubMed] [Google Scholar]
- Avni E. F., Cassart M., de Maertelaer V., Rypens F., Vermeylen D., Gevenois P. A. 1996. Sonographic prediction of chronic lung disease in the premature undergoing mechanical ventilation. Pediatr. Radiol.; 26:463-469. [DOI] [PubMed] [Google Scholar]
- Bankier A. A., De Maertelaer V., Keyzer C., Gevenois P. A. 1999. Pulmonary emphysema: subjective visual grading versus objective quantification with macroscopic morphometry and thin‐section CT densitometry. Radiology; 211:851-858. [DOI] [PubMed] [Google Scholar]
- Boudreau M., Xu X., Santyr G. E. 2013. Measurement of (129) Xe gas apparent diffusion coefficient anisotropy in an elastase‐instilled rat model of emphysema. Magn. Reson. Med.; 69:211-220. [DOI] [PubMed] [Google Scholar]
- Bourbeau J., Saad N. 2013. COPD: success needs implementing a participative care model and early treatment? Rev. Mal. Respir.; 30:93-94. [DOI] [PubMed] [Google Scholar]
- Carlson A. P., Brown A. M., Zager E., Uchino K., Marks M. P., Robertson C. 2011. Xenon‐enhanced cerebral blood flow at 28% xenon provides uniquely safe access to quantitative, clinically useful cerebral blood flow information: a multicenter study. AJNR Am. J. Neuroradiol.; 32:1315-1320. [DOI] [PMC free article] [PubMed] [Google Scholar]
- Chae E. J., Song J. W., Seo J. B., Krauss B., Jang Y. M., Song K. S. 2008. Clinical utility of dual‐energy CT in the evaluation of solitary pulmonary nodules: initial experience. Radiology; 249:671-681. [DOI] [PubMed] [Google Scholar]
- Cleveland Z. I., Cofer G. P., Metz G., Beaver D., Nouls J., Kaushik S. S. 2010. Hyperpolarized Xe MR imaging of alveolar gas uptake in humans. PLoS One; 5:e12192. [DOI] [PMC free article] [PubMed] [Google Scholar]
- Couper D., Lavange L. M., Han M., Barr R. G., Bleecker E., Hoffman E. A.SRG. 2014. Design of the subpopulations and intermediate outcomes in COPD Study (SPIROMICS). Thorax; 69:491-494. [DOI] [PMC free article] [PubMed] [Google Scholar]
- Diaz S., Casselbrant I., Piitulainen E., Pettersson G., Magnusson P., Peterson B. 2008. Hyperpolarized 3He apparent diffusion coefficient MRI of the lung: reproducibility and volume dependency in healthy volunteers and patients with emphysema. J. Magn. Reson. Imaging; 27:763-770. [DOI] [PubMed] [Google Scholar]
- Diaz S., Casselbrant I., Piitulainen E., Magnusson P., Peterson B., Wollmer P. 2009. Validity of apparent diffusion coefficient hyperpolarized 3He‐MRI using MSCT and pulmonary function tests as references. Eur. J. Radiol.; 71:257-263. [DOI] [PubMed] [Google Scholar]
- Driehuys B., Martinez‐Jimenez S., Cleveland Z. I., Metz G. M., Beaver D. M., Nouls J. C. 2012. Chronic obstructive pulmonary disease: safety and tolerability of hyperpolarized 129Xe MR imaging in healthy volunteers and patients. Radiology; 262:279-289. [DOI] [PMC free article] [PubMed] [Google Scholar]
- Evans A., McCormack D., Ouriadov A., Etemad‐Rezai R., Santyr G., Parraga G. 2007. Anatomical distribution of 3He apparent diffusion coefficients in severe chronic obstructive pulmonary disease. J. Magn. Reson. Imaging; 26:1537-1547. [DOI] [PubMed] [Google Scholar]
- Fain S. B., Panth S. R., Evans M. D., Wentland A. L., Holmes J. H., Korosec F. R. 2006. Early emphysematous changes in asymptomatic smokers: detection with 3He MR imaging. Radiology; 239:875-883. [DOI] [PubMed] [Google Scholar]
- Fain S., Schiebler M. L., McCormack D. G., Parraga G. 2010. Imaging of lung function using hyperpolarized helium‐3 magnetic resonance imaging: review of current and emerging translational methods and applications. J. Magn. Reson. Imaging; 32:1398-1408. [DOI] [PMC free article] [PubMed] [Google Scholar]
- Farag A., Wang J., Ouriadov A., Parraga G., and Santyr G.. 2012. Unshielded and asymmetric RF transmit coil for hyperpolarized 129Xe human lung imaging at 3.0T. Proceedings of the 20th Annual Meeting of ISMRM, Melbourne, Australia. Posterx00231233,.
- Fichele S., Woodhouse N., Swift A. J., Said Z., Paley M. N., Kasuboski L. 2004. MRI of helium‐3 gas in healthy lungs: posture related variations of alveolar size. J. Magn. Reson. Imaging; 20:331-335. [DOI] [PubMed] [Google Scholar]
- Gevenois P. A., De Vuyst P., de Maertelaer V., Zanen J., Jacobovitz D., Cosio M. G. 1996. Comparison of computed density and microscopic morphometry in pulmonary emphysema. Am. J. Respir. Crit. Care Med.; 154:187-192. [DOI] [PubMed] [Google Scholar]
- Global Initiative for Chronic Lung Disease. Global strategy for the diagnosis, management, and prevention of chronic obstructive pulmonary disease (Updated 2013). 2013.
- Gordon C., Gudi K., Krause A., Sackrowitz R., Harvey B. G., Strulovici‐Barel Y. 2011. Circulating endothelial microparticles as a measure of early lung destruction in cigarette smokers. Am. J. Respir. Crit. Care Med.; 184:224-232. [DOI] [PMC free article] [PubMed] [Google Scholar]
- Honda N., Osada H., Watanabe W., Nakayama M., Nishimura K., Krauss B. 2012. Imaging of ventilation with dual‐energy CT during breath hold after single vital‐capacity inspiration of stable xenon. Radiology; 262:262-268. [DOI] [PubMed] [Google Scholar]
- Horsfield K., Cumming G. 1968. Morphology of the bronchial tree in man. J. Appl. Physiol.; 24:373-383. [DOI] [PubMed] [Google Scholar]
- Kauczor H. U., Ebert M., Kreitner K. F., Nilgens H., Surkau R., Heil W. 1997. Imaging of the lungs using 3He MRI: preliminary clinical experience in 18 patients with and without lung disease. J. Magn. Reson. Imaging; 7:538-543. [DOI] [PubMed] [Google Scholar]
- Kaushik S. S., Cleveland Z. I., Cofer G. P., Metz G., Beaver D., Nouls J. 2011. Diffusion‐weighted hyperpolarized 129Xe MRI in healthy volunteers and subjects with chronic obstructive pulmonary disease. Magn. Reson. Med.; 65:1154-1165. [DOI] [PMC free article] [PubMed] [Google Scholar]
- Kirby M., Svenningsen S., Kanhere N., Owrangi A., Wheatley A., Coxson H. O. 2013. Pulmonary ventilation visualized using hyperpolarized helium‐3 and xenon‐129 magnetic resonance imaging: differences in COPD and relationship to emphysema. J. Appl. Physiol. (1985); 114:707-715. [DOI] [PubMed] [Google Scholar]
- Kirby M., Heydarian M., Svenningsen S., Wheatley A., McCormack D. G., Etemad‐Rezai R. 2012a. Hyperpolarized 3He magnetic resonance functional imaging semiautomated segmentation. Acad. Radiol.; 19:141-152. [DOI] [PubMed] [Google Scholar]
- Kirby M., Heydarian M., Wheatley A., McCormack D. G., Parraga G. 2012b. Evaluating bronchodilator effects in chronic obstructive pulmonary disease using diffusion‐weighted hyperpolarized helium‐3 magnetic resonance imaging. J. Appl. Physiol.; 112:651-657. [DOI] [PubMed] [Google Scholar]
- Kirby M., Svenningsen S., Owrangi A., Wheatley A., Farag A., Ouriadov A. 2012d. Hyperpolarized 3He and 129Xe MR imaging in healthy volunteers and patients with chronic obstructive pulmonary disease. Radiology; 265:600-610. [DOI] [PubMed] [Google Scholar]
- Kirby M., Owrangi A., Svenningsen S., Wheatley A., Coxson H. O., Paterson N. A. 2013. On the role of abnormal DL(CO) in ex‐smokers without airflow limitation: symptoms, exercise capacity and hyperpolarised helium‐3 MRI. Thorax; 68:752-759. [DOI] [PubMed] [Google Scholar]
- de Lange E. E., Mugler J. P., III, Brookeman J. R., Knight‐Scott J., Truwit J. D., Teates C. D. 1999. Lung air spaces: MR imaging evaluation with hyperpolarized 3He gas. Radiology; 210:851-857. [DOI] [PubMed] [Google Scholar]
- Macintyre N., Crapo R. O., Viegi G., Johnson D. C., van der Grinten C. P., Brusasco V. 2005. Standardisation of the single‐breath determination of carbon monoxide uptake in the lung. Eur. Respir. J.; 26:720-735. [DOI] [PubMed] [Google Scholar]
- Mathew L., Evans A., Ouriadov A., Etemad‐Rezai R., Fogel R., Santyr G. 2008. Hyperpolarized 3He magnetic resonance imaging of chronic obstructive pulmonary disease: reproducibility at 3.0 Tesla. Acad. Radiol.; 15:1298-1311. [DOI] [PubMed] [Google Scholar]
- Miller R. R., Muller N. L., Vedal S., Morrison N. J., Staples C. A. 1989. Limitations of computed tomography in the assessment of emphysema. Am. Rev. Respir. Dis.; 139:980-983. [DOI] [PubMed] [Google Scholar]
- Miller M. R., Hankinson J., Brusasco V., Burgos F., Casaburi R., Coates A. 2005. Standardisation of spirometry. Eur. Respir. J.; 26:319-338. [DOI] [PubMed] [Google Scholar]
- Moller H. E., Chen X. J., Saam B., Hagspiel K. D., Johnson G. A., Altes T. A. 2002. MRI of the lungs using hyperpolarized noble gases. Magn. Reson. Med.; 47:1029-1051. [DOI] [PubMed] [Google Scholar]
- Morbach A. E., Gast K. K., Schmiedeskamp J., Dahmen A., Herweling A., Heussel C. P. 2005. Diffusion‐weighted MRI of the lung with hyperpolarized helium‐3: a study of reproducibility. J. Magn. Reson. Imaging; 21:765-774. [DOI] [PubMed] [Google Scholar]
- Mugler J. P., III, Driehuys B., Brookeman J. R., Cates G. D., Berr S. S., Bryant R. G. 1997. MR imaging and spectroscopy using hyperpolarized 129Xe gas: preliminary human results. Magn. Reson. Med.; 37:809-815. [DOI] [PubMed] [Google Scholar]
- Mugler J. P. III, Mata J. F., Wang H. T. J., Tobias W. A., Cates G. D., Christopher J. M., et al. 2004. The apparent diffusion coefficient of 129‐Xe in the lung: preliminary human results. Proceedings of the 12th Annual Meeting of ISMRM, Kyoto, Japan. Pp. 769.
- Muller N. L., Staples C. A., Miller R. R., Abboud R. T. 1988. “Density mask”. An objective method to quantitate emphysema using computed tomography. Chest; 94:782-787. [DOI] [PubMed] [Google Scholar]
- Ochs M., Nyengaard J. R., Jung A., Knudsen L., Voigt M., Wahlers T. 2004. The number of alveoli in the human lung. Am. J. Respir. Crit. Care Med.; 169:120-124. [DOI] [PubMed] [Google Scholar]
- Ouriadov A., Farag A., Kirby M., McCormack D. G., Parraga G., Santyr G. E. 2013. Lung morphometry using hyperpolarized (129) Xe apparent diffusion coefficient anisotropy in chronic obstructive pulmonary disease. Magn. Reson. Med.; 70:1699-1706. [DOI] [PubMed] [Google Scholar]
- Parraga G., Ouriadov A., Evans A., McKay S., Lam W. W., Fenster A. 2007. Hyperpolarized 3He ventilation defects and apparent diffusion coefficients in chronic obstructive pulmonary disease: preliminary results at 3.0 Tesla. Invest. Radiol.; 42:384-391. [DOI] [PubMed] [Google Scholar]
- Regan E. A., Hokanson J. E., Murphy J. R., Make B., Lynch D. A., Beaty T. H. 2010. Genetic epidemiology of COPD (COPDGene) study design. COPD; 7:32-43. [DOI] [PMC free article] [PubMed] [Google Scholar]
- Saam B. T., Yablonskiy D. A., Kodibagkar V. D., Leawoods J. C., Gierada D. S., Cooper J. D. 2000. MR imaging of diffusion of (3)He gas in healthy and diseased lungs. Magn. Reson. Med.; 44:174-179. [DOI] [PubMed] [Google Scholar]
- Salerno M., de Lange E. E., Altes T. A., Truwit J. D., Brookeman J. R., Mugler J. P., III 2002. Emphysema: hyperpolarized helium 3 diffusion MR imaging of the lungs compared with spirometric indexes–initial experience. Radiology; 222:252-260. [DOI] [PubMed] [Google Scholar]
- Shukla Y., Wheatley A., Kirby M., Svenningsen S., Farag A., Santyr G. E. 2012. Hyperpolarized 129Xe magnetic resonance imaging: tolerability in healthy volunteers and subjects with pulmonary disease. Acad. Radiol.; 19:941-951. [DOI] [PubMed] [Google Scholar]
- Sindile A.Muradian I., Hrovat M., Johnson D. C., Hersman F. W., and Patz S.. 2007. Human pulmonary diffusion weighted imaging at 0.2T with hyperpolarizd 129Xe. Proceedings of the 15th Annual Meeting of ISMRM, Berlin, Germany. Pp. 1290.
- Suga K. 2002. Technical and analytical advances in pulmonary ventilation SPECT with xenon‐133 gas and Tc‐99m‐Technegas. Ann. Nucl. Med.; 16:303-310. [DOI] [PubMed] [Google Scholar]
- Sukstanskii A. L., Yablonskiy D. A. 2012. Lung morphometry with hyperpolarized 129Xe: theoretical background. Magn. Reson. Med.; 67:856-866. [DOI] [PMC free article] [PubMed] [Google Scholar]
- Svenningsen S., Kirby M., Starr D., Leary D., Wheatley A., Maksym G. N. 2013. Hyperpolarized (3) He and (129) Xe MRI: differences in asthma before bronchodilation. J. Magn. Reson. Imaging; 38:1521-1530. [DOI] [PubMed] [Google Scholar]
- Van Bell G., Fisher L., Heagerty P., Lumley T. Multiple comparisons in biostatistics: a methodology for the health sciences. Seattle, WA: Wiley‐Interscience; 2004. [Google Scholar]
- Vestbo J., Anderson W., Coxson H. O., Crim C., Dawber F., Edwards L., Hagan G., Knobil K., Lomas D. A., MacNee W., Silverman E. K., Tal‐Singer R.ECLIPSE investigators. 2008. Evaluation of COPD Longitudinally to Identify Predictive Surrogate End‐points (ECLIPSE). Eur. Respir. J.; 31:869-873. [DOI] [PubMed] [Google Scholar]
- Wanger J., Clausen J. L., Coates A., Pedersen O. F., Brusasco V., Burgos F. 2005. Standardisation of the measurement of lung volumes. Eur. Respir. J.; 26:511-522. [DOI] [PubMed] [Google Scholar]
- Woods J. C., Yablonskiy D. A., Choong C. K., Chino K., Pierce J. A., Hogg J. C. 2005. Long‐range diffusion of hyperpolarized 3He in explanted normal and emphysematous human lungs via magnetization tagging. J. Appl. Physiol.; 99:1992-1997. [DOI] [PMC free article] [PubMed] [Google Scholar]
- Woods J. C., Choong C. K., Yablonskiy D. A., Bentley J., Wong J., Pierce J. A. 2006. Hyperpolarized 3He diffusion MRI and histology in pulmonary emphysema. Magn. Reson. Med.; 56:1293-1300. [DOI] [PMC free article] [PubMed] [Google Scholar]