

Abstract
Cardiolipin (CL) is an anionic phospholipid with a characteristically large curvature and is of growing interest for two primary reasons: (i) it binds to and regulates many peripheral membrane proteins in bacteria and mitochondria, and (ii) it is distributed asymmetrically in rod-shaped cells and is concentrated at the poles and division septum. Despite the growing number of studies of CL, its function in bacteria remains unknown. 10-N-Nonyl acridine orange (NAO) is widely used to image CL in bacteria and mitochondria, as its interaction with CL is reported to produce a characteristic red-shifted fluorescence emission. Using a suite of biophysical techniques, we quantitatively studied the interaction of NAO with anionic phospholipids under physiologically relevant conditions. We found that NAO is promiscuous in its binding and has photophysical properties that are largely insensitive to the structure of diverse anionic phospholipids to which it binds. Being unable to rely solely on NAO to characterize the localization of CL in Escherichia coli cells, we instead used quantitative fluorescence microscopy, mass spectrometry, and mutants deficient in specific classes of anionic phospholipids. We found CL and phosphatidylglycerol (PG) concentrated in the polar regions of E. coli cell membranes; depletion of CL by genetic approaches increased the concentration of PG at the poles. Previous studies suggested that some CL-binding proteins also have a high affinity for PG and display a pattern of cellular localization that is not influenced by depletion of CL. Framed within the context of these previous experiments, our results suggest that PG may play an essential role in bacterial physiology by maintaining the anionic character of polar membranes.
INTRODUCTION
Genome-wide studies of Bacillus subtilis, Escherichia coli, and Caulobacter crescentus have revealed a large number of proteins that display a distinct pattern of subcellular organization (1–4). Remarkably, >10% of proteins in C. crescentus cells have a nonuniform subcellular distribution along the long axis of the cell (1), and localization studies of E. coli and B. subtilis suggest that these model bacteria may also display a similar subcellular diversity (2–4).
Several mechanisms for organizing bacterial proteins in vivo have been hypothesized, including nucleoid occlusion (5, 6), diffusion-and-capture stochastic self-assembly (7–9), and direct sensing of membrane curvature (10–13). A hypothesis that has received a growing amount of attention is the influence of the heterogeneity of the membrane on the localization of proteins. Experimental evidence suggests that phospholipids (PLs) form microdomains, compartmentalize proteins in bacteria, and may be functionally similar to lipid rafts in eukaryotes. For rod-shaped bacteria, a growing body of data supports the localization of these PL microdomains at the poles and/or division septum and their colocalization to proteins involved in cell division and osmosensing (14–20).
Introduction to cardiolipin.
E. coli membranes consist of ∼80% phosphatidylethanolamine (PE), ∼15% phosphatidylglycerol (PG), and ∼5% cardiolipin (CL) (17). The localization of CL at the poles and division septa of many rod-shaped bacteria is the best-studied example of a PL that is organized in the bacterial membrane (14–18, 21–25). Figure 1 depicts structures of both major anionic components of the membrane, CL and PG. Although the structures in Fig. 1 depict phospholipid analogs that are available commercially, bacteria synthesize a spectrum of PLs that vary in the number of acyl chains, the acyl chain lengths, the number and position of unsaturated bonds, and the presence of cyclopropyl groups. A striking feature of CL is the small cross section of its head group relative to the cross section of its four large tail groups. This feature results in a molecule with a large intrinsic curvature. Divalent cations can bind across the glycerol-linked phosphate groups in CL and produce a molecule with a curvature that is ∼1.3 nm−1 (26, 27). A theoretical framework (28) has been developed for curvature-mediated microphase separation of CL in bacterial membranes that supports previously reported experimental data for its spatial localization in cells (14).
FIG 1.

Chemical structures of the major phospholipids in E. coli and NAO. For simplicity, phospholipids are shown with unsaturated 18-carbon tails, corresponding to the synthetic species used for in vitro measurements. Phospholipid head groups are bolded and highlighted in red.
Although CL destabilizes planar bilayer membranes, its biosynthetic machinery is widely conserved among bacteria (29) and is redundant in E. coli (30), which suggests that it plays an important function in cell physiology. Several groups have hypothesized that the localization of CL may be critical for controlling the position and function of peripheral bacterial proteins, many of which have an affinity for CL in vitro (18, 19, 24, 31–33). Despite a number of studies of protein interactions with CL, the physiological role of this PL in bacteria is unclear. E. coli mutants devoid of CL do not have an altered cell physiology consistent with the disruption of the function of CL-binding proteins (23, 34), and the localization of CL-binding proteins often appears unchanged (18, 24, 35). These observations suggest that either CL is not critical for the function and localization of essential proteins or there are mechanisms of redundancy to override the depletion of CL.
Study of anionic phospholipids in cells using NAO.
Two experimental methods are commonly cited for the observed concentration of CL at the cell poles and septum in rod-shaped bacteria: (i) the localization pattern of the fluorophore 10-N-nonyl acridine orange (NAO) and (ii) the enrichment of CL in minicells (21). NAO has been reported to bind to anionic PLs and display a unique Stokes shift when bound to CL (λex,max of 492 nm and λem,max of 524 nm for unbound NAO versus λex,max of 456 to 472 nm and λem,max of 620 to 650 nm for CL-bound NAO). This spectroscopic signature, or “red shift,” arises due to proximity-driven excimer formation between two NAO molecules that are positioned in close proximity as a result of the electrostatic interactions between the positive charge on the acridine ring of NAO and two negative phosphate groups of CL (see Fig. 1 for the structures of CL and NAO). Several detailed studies have investigated the spectroscopic signature of NAO bound to CL. However, the majority of this research has focused on labeling mitochondria with NAO and quantifying the CL concentration in mitochondrial extracts (36–40). Studies of the interaction of NAO with CL in mitochondrial membranes have not been particularly relevant to E. coli, since CL is the major anionic PL in mitochondria, whereas PG is the most abundant anionic PL in E. coli; the interaction of PG with NAO under physiological conditions remains unstudied. Several research groups have noted discrepancies with the use of NAO, primarily in its lack of specificity in both mitochondria (39, 41–43) and archaea (44).
Here, we quantitatively study the organization of anionic PLs in E. coli cells using a combination of biophysical, microscopic, and mass spectrometric techniques. This research was motivated by our surprising observation of red-shifted NAO fluorescence at the poles of an E. coli strain that was engineered to produce PG but not CL. To better understand the organization of the bacterial membrane in cells lacking CL, we addressed several unanswered questions regarding the binding of NAO to CL and other anionic PLs, including the quantitative determination of the affinity of NAO for anionic PLs and the spectroscopic changes that accompany these interactions. The results of these experiments complemented the results of our in vivo studies of CL localization using NAO and suggested the accumulation of other classes of anionic PLs at the E. coli cell poles. To establish which anionic PLs are enhanced at the poles, we isolated membrane extracts of minicell-producing E. coli mutants lacking different classes of anionic PLs and quantified them by using liquid chromatography-mass spectrometry (LC-MS); we used thin-layer chromatography (TLC) analysis to complement the LC-MS results. The results of these experiments support our conclusion that CL and PG are concentrated in the polar regions of wild-type E. coli membranes and that the abundance of PG is enhanced at the poles of mutants that do not produce CL. Our discovery that PG is at the poles of E. coli membranes independently of CL contrasts with data from previous reports. The results of these studies provide a framework for understanding the spatial organization of bacterial membranes and may provide insight into the organization of biomolecules at the poles of bacterial cells.
MATERIALS AND METHODS
Preparation of liposomes.
Table 1 lists all lipids used in this study. Lipids were purchased from Avanti Polar Lipids (Alabaster, AL) and were used without further purification. Liposomes were prepared by a method of freeze-thawing and extrusion. Briefly, stock solutions of lipids dissolved in chloroform were dried under argon in a cryotube and placed under a vacuum overnight. The next day, lipids were resuspended in 10 mM Tris-HCl (pH 8.0) to a concentration of 3 mM by a series of four freeze-thaw cycles using liquid nitrogen and a bath sonicator. Unilamellar liposomes were prepared by extrusion through a 100-nm-diameter membrane 21 times (Mini-Extruder; Avanti, Alabaster, AL). Prior to use, the concentrations of the liposome solutions were confirmed by phosphorus analysis (45). The concentration of CL determined by phosphate analysis was corrected for 2 phosphates per molecule. Liposomes were stored at 4°C and used within 1 week of preparation.
TABLE 1.
Lipids used in this study
| Abbreviation | Chain length and saturation | Chemical name |
|---|---|---|
| TOCL | 18:1 cardiolipin | 1′,3′-Bis[1,2-dioleoyl-sn-glycero-3-phospho]-sn-glycerol |
| DOPG | 18:1 phosphatidylglycerol | 1,2-Dioleoyl-sn-glycero-3-phospho-(1′-rac-glycerol) |
| DOPA | 18:1 phosphatidic acid | 1,2-Dioleoyl-sn-glycero-3-phosphate |
| DOPE | 18:1 phosphatidylethanolamine | 1,2-Dioleoyl-sn-glycero-3-phosphoethanolamine |
| DOPS | 18:1 phosphatidylserine | 1,2-Dioleoyl-sn-glycero-3-phospho-l-serine |
| TMCL | 14:0 cardiolipin | 1′,3′-Bis[1,2-dimyristoyl-sn-glycero-3-phospho]-sn-glycerol |
| DMPG | 14:0 phosphatidylglycerol | 1,2-Dimyristoyl-sn-glycero-3-phospho-(1′-rac-glycerol) |
| DMPE | 14:0 phosphatidylethanolamine | 1,2-Dimyristoyl-sn-glycero-3-phosphoethanolamine |
| DMPA | 14:0 phosphatidic acid | 1,2-Dimyristoyl-sn-glycero-3-phosphate |
Measurement of binding affinities of PLs for NAO by ITC.
Isothermal titration calorimetry (ITC) was performed on a MicroCal VP-ITC calorimeter with an offset of 10 μcal/s, a cell temperature of 25°C, and a jacket temperature of 24°C. A solution of NAO (80 μM in 10 mM Tris-HCl [pH 8.0] containing 1.6% dimethyl sulfoxide [DMSO]) was injected into solutions of TOCL (1′,3′-bis[1,2-dioleoyl-sn-glycero-3-phospho]-sn-glycerol) and DOPG [1,2-dioleoyl-sn-glycero-3-phospho-(1′-rac-glycerol)] (3 and 6 μM, respectively, in the same buffer containing 1.6% DMSO). The DMSO was required to maintain the solubility of NAO and was carefully maintained for all samples (including controls) to minimize systematic error. Each injection volume was 10 μl, with a 20-s duration and a 2-s filter time. We performed buffer-into-buffer, buffer-into-lipid, and NAO-into-buffer controls and subtracted these values from the heats of binding for each injection. The data were fit to a one-site binding model by using VP-ITC software.
Fluorimetry of NAO-labeled liposomes.
Solutions of liposomes and NAO were pipetted into 96-well plates (Corning 96-well black plates with a clear bottom) to a final volume of 200 μl in 10 mM Tris-HCl (pH 8.0). The final concentration of NAO in each well was kept constant at 5 μM. The lipid concentrations varied between 250 nM and 680 μM on a logarithmic scale spread over 18 wells (including a well with no lipid). Each concentration series was run in triplicate. The plate was analyzed with a Tecan plate reader (Infinite M1000) nominally at 26°C, without a cover. The program included an initial 10-s shaking step followed by excitation at 456 nm for each well, with either a spectral intensity scan or a selection of specific wavelengths (i.e., 524 nm, 652 nm, and 700 nm). The gain was set manually at 160. The program performed emission measurements in triplicate and determined average values.
Bacterial strains used in this study.
Table 2 lists the E. coli K-12 strains and mutants used in this study. The triple CL synthase knockout strain MG1655 BKT12 was constructed similarly to W3110 BKT12 (30). Strain PO10 was constructed by removing the kanamycin cassette (located in place of the clsC gene) from MG1655 BKT12 using an FLP recombinase procedure (46). Removal the minCDE genes using a λ red recombinase procedure (47) resulted in a minicell-producing mutant of PO10 (POM10). UEM53 was constructed by transferring the ΔminCDE::kan cassette from WM1032 to UE53 using P1 phage transduction (48). UE53 was used in this study to ensure that the mutations required to make a viable pgsA knockout (UE54) did not affect the localization of phospholipids.
TABLE 2.
Strains of E. coli used in this study
| Strain | Genotypea | Source or reference(s) |
|---|---|---|
| MG1655 | Wild-type parent strain | Laboratory stock |
| MG1655 BKT12 | MG1655 ΔclsABC::FRT-kan-FRT | Raetz laboratory |
| UE53 | MG1655 lpp-2 Δara714 rcsF::mini-Tn10 cam | 35, 52 |
| UEM53 | UE53 ΔminCDE::kan | This study |
| UE54 | UE53 ΔpgsA::kan | 35, 52 |
| UEM543 | UE54 ΔminCDE::kan | 35 |
| WM1032 | MG1655 ΔlacU169 ΔminCDE::kan | 66 |
| PO10 | MG1655 ΔclsABC::FRT | This study |
| POM10 | PO10 ΔminCDE::kan | This study |
FRT, FLP recombination target.
Microscopy of E. coli cells labeled with NAO and FM4-64.
We determined optimal and reproducible conditions for visualizing NAO fluorescence at the E. coli cell poles empirically. Optimization was based on conditions that produced polar enhancement of the red fluorescence signal of NAO. Although several other groups have successfully used submicromolar concentrations of NAO for labeling studies, we found polar enhancement of the fluorophore to be unreliable at concentrations below 2 μM (see Fig. S2 in the supplemental material for a comparison of polar localizations using different concentrations of NAO for labeling experiments). Briefly, cells were grown overnight at 37°C and diluted in lysogeny broth (LB) medium to an optical density (OD) of 0.1 (λ = 600 nm). NAO was added to the bacterial cell culture to a final concentration of 2 μM (from a 1 mM stock solution of NAO dissolved in DMSO). Cultures were grown with appropriate antibiotics at 30°C until an OD of ∼0.55 (λ = 600 nm) was reached (2 to 4 h). The observation of polar localization was unreliable when cells were grown to an OD of <0.55 (data not shown). All cultures were grown at 30°C to avoid any perturbation of mutant strain UE54 at higher temperatures (35). Five hundred microliters of each culture was centrifuged at 1,400 × g for 5 min, and 450 μl of the supernatant was removed. The cells were resuspended by vortexing. Ten microliters of each culture was pipetted onto a thin glass coverslip (24 by 60 mm) and covered with an LB agarose pad (3%). Fluorescence and phase-contrast imaging were performed on a Zeiss Axiovert 100 inverted microscope with a 100× objective using an electron-multiplying charge-coupled-device (EMCCD) camera (Andor iXon 3; Andor Technology). A mercury lamp (Exfo; Life Sciences) was used at maximum power with 100- to 200-ms exposures, with minimal gain for fluorescence. To observe the “green” emission of NAO, we used a 470-nm (20-nm-bandwidth [BW]) excitation filter and a 518-nm (25-nm-BW) emission filter. The “red” NAO emission was captured by using 480-nm (60-nm-BW) excitation and 685-nm (40-nm-BW) emission filters.
Wild-type E. coli (MG1655) was also labeled with FM4-64 as a control membrane fluorophore (see Fig. 4B). Briefly, a culture of MG1655 grown overnight was diluted 1:100 in LB broth and grown for 3 h at 30°C. One microliter of 1 μM FM4-64 (catalog number T-13320; Life Technologies) was added to 500 μl of cells and vortexed gently. The cells were imaged as described above by using the same filter set as that used for the red emission of NAO.
FIG 4.
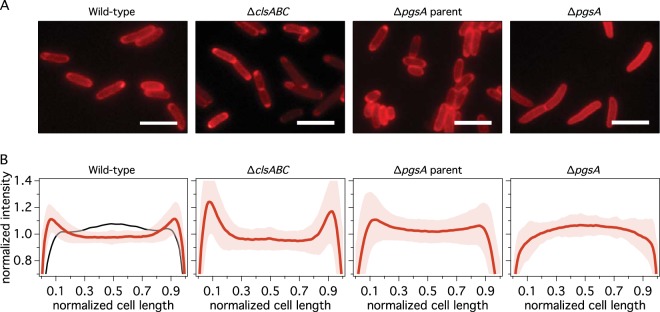
(A) Representative red fluorescence microscopy images of wild-type (MG1655), ΔclsABC (MG1655 BKT12), ΔpgsA parent (UE53), and ΔpgsA (UE54) E. coli cells labeled with NAO (2 μM) and cultured at 30°C to an OD of 0.55 (λ = 600 nm) (see Materials and Methods for details). Bar, 5 μm. (B) Averaged red intensity profiles of cells labeled with NAO versus normalized cell length. The intensities along the long axis of each cell were normalized to an area of 1 and averaged (n = 190 to 358). The average value is depicted as a red line for each strain. The shaded space surrounding the NAO fluorescence intensity profiles designates the standard error of the intensity at each point. The black line in the leftmost panel shows the normalized intensity profile for wild-type MG1655 stained with the general membrane dye FM4-64. We intentionally excluded septating cells from the analysis.
Fluorescence and phase-contrast images were used to obtain the individual cell intensity profiles for green and red emissions by using MicrobeTracker (49). The sample size ranged from 190 to 358 cells. After we exported the cell profiles from MATLAB (The MathWorks, Inc.), we wrote a script in Igor Pro (Wavemetrics, Inc.) to search for cells that displayed polarly localized fluorescence of NAO. Briefly, the script calculates the average fluorescence intensity of the body of the cell (normalized cell length of between 0.25 and 0.75) and compares it to the maximum fluorescence intensities at the poles (normalized cell lengths of 0 to 0.25 and 0.75 to 1). If either of the two cell poles have a fluorescence intensity that is >20% of the average intensity of the body, the cell is marked as “polarly localized.” Percentages of cells that were polarly localized were calculated (see Table 3). All scripts used for the analysis of fluorescence intensity profiles are available on our website (http://www.biochem.wisc.edu/faculty/weibel/lab/publications).
TABLE 3.
Polar localization of red and green fluorescence emitted by NAOa
| Strain | Genotype | Mean % red poles (±SE) | Mean % green poles (±SE) | Total no. of cells |
|---|---|---|---|---|
| MG1655 | Wild type | 71.1 (±3.3) | 15.9 (±2.7) | 190 |
| MG1655 BKT12 | ΔclsABC | 93.9 (±1.4) | 82.3 (±2.3) | 284 |
| UE53 | Pseudo-wild type | 56.7 (±2.6) | 26.3 (±2.3) | 358 |
| UE54 | ΔpgsA | 15.0 (±2.3) | 7.1 (±1.6) | 247 |
Percentages represent the total numbers of cells with a characteristic fluorescence emission peak (either red or green) at either of the poles. Standard errors are given based on sample proportion.
Separation of minCDE knockout minicells from vegetative cells.
Briefly, cultures grown overnight were used to inoculate two 1-liter flasks of LB containing appropriate antibiotics, one for each of the strains, to an OD of 0.05 (λ = 600 nm). Cultures were grown for 2 to 4 h at 30°C to an OD of between 0.7 and 0.9 (mid-exponential phase) (λ = 600 nm). The cultures were centrifuged in 1-liter tubes at 2,500 × g (4°C) for 10 min. The supernatant (containing minicells) was placed into new 1-liter tubes. The pellet (containing whole cells) was washed three times in phosphate-buffered saline (PBS) by centrifugation (2,000 × g for 10 min at 4°C), resuspended in PBS to an OD of 7.5 (λ = 600 nm), and frozen at −80°C. This process yielded >10 ml of a suspension of whole cells with an OD of 7.5 (λ = 600 nm).
The minicells were pelleted at 12,000 × g (4°C) for 25 min, and the supernatant was discarded. The pellet was resuspended in 25 ml LB containing 60 μg/ml cephalexin (to filament any surviving vegetative cells) and placed into and incubator at 37°C with shaking for 1.5 h. The flask was sonicated in a bath sonicator for 10 min to break up cell aggregates. The solution was centrifuged twice at 2,000 × g (4°C) for 10 min, and the pellet was discarded after each step. Minicells were pelleted at 15,000 × g (4°C) for 20 min and resuspended in 2 ml of PBS. Minicells were washed again with PBS twice at 15,000 × g in a minicentrifuge for 15 min, resuspended to an OD of 1.0 (λ = 600 nm) in PBS, and frozen at −80°C. This process yielded >1 ml of a suspension of minicells with an OD of 1.0 (λ = 600 nm).
Lipid extraction.
Whole-lipid extracts of E. coli mutants lacking the minCDE genes were prepared by using a procedure modified from the original Bligh-Dyer method (50). We performed four replicates for each sample. Briefly, 5 ml of vegetative cells (or 333 μl of minicells) was added to separate 50-ml glass tubes (with Teflon-lined caps). An additional 666 μl of diH2O was added to the tubes containing minicell samples. A standard solution containing 100 μM TMCL (1′,3′-bis[1,2-dimyristoyl-sn-glycero-3-phospho]-sn-glycerol), 200 μM DMPE (1,2-dimyristoyl-sn-glycero-3-phosphoethanolamine), 20 μM DMPG [1,2-dimyristoyl-sn-glycero-3-phospho-(1′-rac-glycerol)], and 500 μM DMPA (1,2-dimyristoyl-sn-glycero-3-phosphate) was prepared in a chloroform-methanol-water mixture (65:35:8). One hundred microliters of the standard solution, 6.25 ml of chloroform, and 12.5 ml of methanol were added to each vegetative suspension. Ten microliters of the standard, 1.25 ml of chloroform, and 2.5 ml of methanol were added to each minicell suspension. Solutions were shaken at 200 rpm for 1 h at 25°C. Two phases were created for the vegetative extract by adding 6.25 ml of chloroform and 6.25 ml of 0.1 N HCl. For the minicell extracts, 1.25 ml of chloroform and 1.25 ml of 0.1 N HCl were added. Tubes were centrifuged at 1,000 × g (4°C) for 10 min. We discarded most of the top (aqueous) phase. The bottom phase was extracted by using a glass Pasteur pipette and dried under nitrogen in a small glass vial. Approximately 10 mg of lipid extract was recovered from the vegetative cells, and 1 to 2 mg was recovered from the minicells. Samples were stored at −80°C before analysis by LC-MS or TLC.
TLC and phosphorus analysis.
We also prepared lipid extracts of E. coli cells specifically for analysis of PLs by TLC. These samples were dissolved in 100 μl of a chloroform-methanol-water mixture (65:35:8). Forty microliters of lipid extracts from vegetative cells (and 100 μl of lipids extracts from minicells) was spotted and dried on separate 10- by 20-cm TLC plates (TLC silica gel 60, catalog number HX259108; EMD Millipore) as a band approximately 1 cm above the bottom edge of the plate. We separated lipids along one dimension using a solvent mixture consisting of chloroform-methanol-ammonia (60:35:2); the concentration of ammonia was 28 to 30%, by weight. Plates were developed in a vapor of iodine until the bands became visible. Each lipid was identified based on Rf values of lipid standards that we determined. Only PE, PG, and CL were easily identifiable; we did not analyze phosphatidic acid (PA). After residual iodine was evaporated from the plate, the silica gel corresponding to each band was scraped from the plate into 10- by 80-mm glass tubes.
Phosphorus analysis of PLs extracted from the silica gel was performed in a manner similar to a technique reported previously (51), with minor modifications. Briefly, a phosphorus standard was prepared from a 100-mg/ml stock of KH2PO4 in DI-H2O and further diluted to 0.1 mg/ml in DI-H2O (0.735 mM phosphate). A set of standards with concentrations ranging between 1 μl and 600 μl of 0.1 mg/ml KH2PO4 were prepared in glass tubes. The samples of silica gel removed from TLC plates and PL standards were mixed with 225 μl of 8.9 N H2SO4. The tubes were incubated in a heat block at 215°C until the aqueous component evaporated completely (30 min to 1 h).
After the tubes were cooled, 75 μl of hydrogen peroxide (30%, wt/wt) was added, and the tubes were heated at 215°C for 30 min. After cooling, 1.95 ml of water, 0.25 ml of ammonium molybdate (2.5%, wt/vol), and 0.25 ml ascorbic acid (10%, wt/vol) were added, with vortex mixing after each step. The tubes were heated for 10 min at 65°C in a water bath and centrifuged at ∼1,000 × g for 10 min in order to pellet the scrapings. The absorbance of 300 μl of the samples was measured at 820 nm in a 96-well plate by using a plate reader (Infinite M1000; Tecan Instruments). Relative abundances of lipids are reported in Fig. S4D and E in the supplemental material. The abundance of CL determined by phosphate analysis was corrected for 2 phosphates per molecule.
LC-MS of lipid extracts.
LC-MS analysis was performed on an Agilent 6220 LC-electrospray ionization (ESI)-time of flight (TOF) instrument, and data were acquired in both positive and negative ionization modes. For negative-mode MS experiments, a Gemini C18 column (5 μm; 4.6 mm by 50 mm) (Phenomenex) was used with a precolumn (C18) (3.5 μm; 2 mm by 20 mm). For these experiments, solvent A contained a 95:5 dilution of water-methanol with 0.1% ammonium hydroxide, and solvent B contained a 60:35:5 dilution of isopropanol-methanol-water with 0.1% ammonium hydroxide. For the positive mode, a Luna C5 column (5 μm; 4.6 mm by 50 mm) (Phenomenex) was used with a precolumn (C18) (3.5 μm; 2 mm by 20 mm). For these experiments, solvent A contained a 95:5 dilution of water-methanol with 0.1% formic acid and 5 mM ammonium formate, and solvent B contained a 60:35:5 dilution of isopropanol-methanol-water with 0.1% formic acid and 5 mM ammonium formate. The same gradient was employed for both ionization modes. The gradient was held at 0% solvent B between 0 and 5 min, changed to 20% solvent B at 5.1 min, increased linearly from 20% solvent B to 100% solvent B between 5.1 min and 45 min, held at 100% solvent B between 45.1 min and 53 min, returned to 0% solvent B at 53.1 min, and held at 0% solvent B between 53.1 min and 60 min to allow column reequilibration. The flow rate was maintained at 0.1 ml/min between 0 min and 5 min to counter the pressure increase due to the chloroform injection. The flow rates were 0.4 ml/min between 5.1 min and 45 min and 0.5 ml/min between 45.1 min and 60 min. The injection volume was 30 μl. Samples were introduced via an ESI source. The capillary voltage was set at 3.5 kV, and the fragmentor voltage was set at 100 V. The drying gas temperature was 350°C, the drying gas flow rate was 10 liters min−1, and the nebulizer pressure was 45 lb/in2. All data were collected in both profile and centroid modes by using a mass range of 100 to 1,500 Da.
Data were analyzed by using two separate approaches: a targeted approach that quantifies known lipids and an untargeted approach that identifies changes in unknown metabolites. For the targeted approach, extracted ion chromatographs (EICs) corresponding to the exact mass-to-charge (m/z) ratios of known metabolites were manually integrated into Agilent Quantitative Analysis software. Statistical significance was determined by using Student's t test. For the untargeted approach, LC-MS raw data were converted from .d into .mzXML format by using Trapper; wild-type and knockout samples were sorted into two groups and analyzed by using the XCMS algorithm. XCMS identifies metabolites common to all data files through retention time alignment and compares the statistical abundances of common metabolites in the wild-type group to those in the knockout groups. Following filtering of XCMS output files by statistical significance, fold change, and reproducibility across independent data sets, the remaining metabolite changes were further confirmed by manual integration into Qualitative Analysis software and by Student's t test.
Relative abundances of the four major PLs in E. coli (PE, PG, CL, and PA) were calculated by first dividing the signal of each lipid species by the signal of its respective standard. For example, the signal of each of the PE species was divided by the signal of the PE standard DMPE (Table 1). The corrected signal from each lipid was multiplied by the mole ratio of the standard in solution. For example, since the mole ratios of the standards added were 20:2:10:50 DMPE/DMPG/TMCL/DMPA, the signals from the PE species were multiplied by 20, the PG signals were multiplied by 2, and so forth (Table 1). The relative abundance of each lipid species was calculated by dividing its corrected signal by the sum of the corrected signals for all the detected PE, PG, CL, and PA lipid species. The data are presented as a percentage of the whole (see Table 4 and Fig. 5; see also Fig. S4 and S5 in the supplemental material). This analysis assumes that the lipids PE, PG, CL, and PA are by far the highest-concentration PLs in the E. coli membrane. We acknowledge that other trace PLs may be present, but they are expected to be minor contributors and are not quantified here.
TABLE 4.
Percent abundances of PE, PG, CL, and PA determined by LC-MS of minicell-producing mutants of wild-type (WM1032), ΔclsABC (POM10), and ΔpgsA (UEM543) E. coli strains
| Genotype of strain | Mean % abundance (SD) |
|||||||
|---|---|---|---|---|---|---|---|---|
| PE |
PG |
CL |
PA |
|||||
| Whole cells | Poles | Whole cells | Poles | Whole cells | Poles | Whole cells | Poles | |
| Wild type | 93.4 (±0.6) | 72 (±7) | 4.4 (±0.5) | 12.0 (±0.4) | 2.0 (±0.2) | 16 (±8) | 0.14 (±0.07) | 0.4 (±0.4) |
| ΔclsABC | 93.2 (±0.6) | 73 (±10) | 6.1 (±0.9) | 27 (±10) | 0.7 (±0.3) | 0.3 (±0.3) | 0.07 (±0.04) | 0.4 (±0.4) |
| ΔpgsA | 97.2 (±0.3) | 98.9 (±0.3) | 0.01 (±0.01) | 0.04 (±0.01) | 0.24 (±0.01) | 0.37 (±0.09) | 2.6 (±0.2) | 0.7 (±0.3) |
FIG 5.
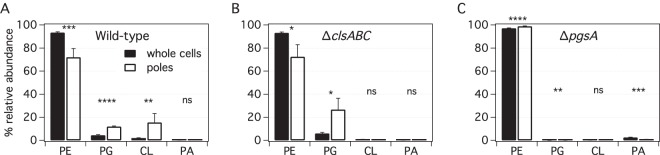
Percent abundances of PE, PG, CL, and PA determined by LC-MS of minicell-producing wild-type (WM1032) (A), ΔclsABC (POM10) (B), and ΔpgsA (UEM543) (C) E. coli strains. To assess differences between the lipid abundances in whole cells and those at poles for the various E. coli strains, we performed chi-squared tests. All tests were two sided, and statistical significance was considered when a P value of <0.05 was observed (ns, nonsignificant; *, P < 0.05; **, P < 0.01; ***, P < 0.001).
RESULTS AND DISCUSSION
In vitro studies of NAO and PLs. (i) Binding affinity of NAO and PLs.
To our knowledge, the only reported measurement of the binding affinity of NAO was performed in a study of mitochondrial PLs more than 2 decades ago (40). In that study, the authors used a pulldown assay and measured association constants of NAO with CL, phosphatidylserine (PS), and phosphatidylinositol (PI) of 2 × 10⁶ M−1, 7 × 10⁴ M−1, and 7 × 10⁴ M−1, respectively. Those authors concluded that NAO binds preferentially to the most abundant anionic PL in mitochondria, CL. This result and conclusion were key factors in the basis for the widespread use of NAO as a fluorophore for labeling CL in mitochondria and laid the foundation for its application in bacterial studies. Unfortunately, that study did not measure the affinity of NAO for PG, which is the most abundant anionic PL in many bacterial membranes (including E. coli).
To fill this knowledge gap, we measured the heats of binding of NAO with liposomes consisting of TOCL and DOPG using isothermal titration calorimetry (ITC) (Fig. 2, top). Our choice of the use of TOCL and DOPG (Fig. 1) was based on mimicking the approximate chain length of the highest-concentration species of CL and PG in E. coli membranes. For brevity, we refer to TOCL as CL and DOPG as PG in the remainder of this paper. Both ITC isotherms were integrated and fit to a one-site binding model (Fig. 2, bottom). We calculated apparent association constants of (6.5 ± 1.3) × 106 M−1 for NAO-CL and (26.4 ± 12.0) × 106 M−1 for NAO-PG. The enthalpies were −4.7 ± 0.1 kJ/mol and −4.9 ± 0.1 kJ/mol, respectively. Fitting of the data to a one-site binding model yielded stoichiometries of approximately 1:2 for CL-NAO and 1:1 for PG-NAO, which are consistent with values that were reported previously for CL and other anionic PLs (37, 40).
FIG 2.

ITC data for addition of 80 μM NAO to 3 μM CL (A) and 6 μM PG (B). The raw data for the heats of binding are shown at the top, and the integrated heats of binding are shown at the bottom and include a fit of the data to a one-site model. The fit yields affinity constants of (6.5 ± 1.3) × 106 M−1 for NAO-CL and (26.4 ± 12.0) × 106 M−1 for NAO-PG. Enthalpy values are −4.7 ± 0.1 kJ/mol and −4.9 ± 0.1 kJ/mol, respectively.
The binding affinity that we measured for NAO and CL closely matches the value reported previously (40). Compared to its binding to CL, the interaction of NAO with PS and PI was previously reported to be weak (40). In contrast, we found that the binding of NAO to PG has an association constant that is approximately 4-fold higher than that for binding to CL. ITC experiments performed with other PL concentrations (data not shown) also indicate that NAO has a preference for binding PG over CL. These data are consistent with a higher energy barrier for the packing of two NAO molecules close together on the glycerol-linked head group of one CL molecule. However, the size of the error from the fit of the PG data undermines our ability to discern the magnitude of the differences in binding affinity. The origin of the error is likely due to the tight binding of NAO to anionic PLs, as affinities of tight binders are often difficult to measure accurately.
(ii) Fluorimetry of NAO with PLs.
The Stokes shift of NAO fluorescence has been reported to broaden when bound to CL (λex,max of 492 nm and λem,max of 524 nm for unbound NAO versus λex,max of 456 to 472 nm and λem,max of ∼650 nm for bound NAO). This spectral property of NAO, particularly the red shift of the emission peak, has been used as a diagnostic tool to differentiate its binding to CL from its binding to other anionic PLs. Current methods of quantifying CL in vitro and in vivo (using microscopy) have relied heavily upon the reported specificity of this interaction; however, the red shift of NAO bound to PG under near-physiological conditions has not been reported. A change in the spectral properties of NAO in solutions containing PG dissolved in a methanol-water mixture was detected, but the effect was disregarded in the context of mitochondrial membranes, which do not contain significant amounts of PG (37).
We titrated NAO with liposomes consisting of CL or other anionic PLs in 10 mM Tris-HCl buffer (pH 8.0) and measured the red (652 nm or 700 nm) and green (524 nm) fluorescence emission intensities of the fluorophore-PL complex (Fig. 3A to C). The intensity data for red and green emissions demonstrate that the order-of-magnitude reduction in the emission peak at 524 nm is a more useful diagnostic for the interaction of NAO with anionic PLs than is the doubling of the emission peak at 652 nm. The self-quenching of the emission peak at around 524 nm as CL is titrated into NAO has been used previously to quantify the binding of NAO to CL in mitochondrial lipid extracts (37, 38, 40). Although the shape of the red and green emission intensities is complex, each feature can be explained in terms of three states of NAO in solution, in which NAO (i) is bound to the membrane at high concentrations and forms dimers with adjacent NAO molecules, (ii) is bound at lower concentrations and maintains its monomeric form, or (iii) is free in solution.
FIG 3.

(A to C) Plots of fluorescence emission intensities of NAO at wavelengths of 652 nm (A), 700 nm (B), and 524 nm (C) as a function of the mole ratio of lipid to NAO. The concentration of NAO was 5 μM, and the PL concentrations of CL, PG, PA, PS, and PE varied. The inset in panel C is an expanded view of the surrounding plot. All emission spectra were acquired at an excitation wavelength of 456 nm. (D) Γ652/524 (i.e., the ratio of red to green emission intensity) of NAO versus the mole ratio of lipid to NAO. Γ652/524 values were determined by dividing the red emission intensity shown in panel A by the green emission intensity shown in panel C. The vertical dotted lines in each panel indicate mole ratios of 0.5 and 1.0. All data shown depict the means of measurements for three separately prepared liposome solutions for each composition. Error bars in panel D indicate the standard deviations of the means. The error bars for the data in panels A to C were generally smaller than the size of the markers and were thus not included in the plots.
At a low mole ratio of PLs to NAO (<1), the red signal (NAO excimer) increases and the green signal (free NAO) is reduced. Once PL is present at a concentration sufficient to bind all free NAO, any extra PL added effectively dilutes the NAO and reduces the number of fluorophore dimers (i.e., the red fluorescence signal decreases). In this region, between a PG mole ratio of 1 and 5, the green signal is largely unaffected because the NAO molecules are close enough to each other to self-quench but not to red shift. The following upward trend in signal intensity for the green signal is likely due to a combination of surface dilution of NAO on the liposome and reduced aqueous solvation of the acridine head group. A corresponding increase in the red signal arises from the long tail of the green emission peak “washing out” the 652-nm red peak at high PL concentrations. In contrast, a plot of the emission at 700 nm versus PL/[NAO] does not show such an increase at high PL concentrations (Fig. 3B). Figure S1 in the supplemental material shows several complete spectra for the titration of CL, PG, PA (phosphatidic acid), PS (phosphatidylserine), and PE into NAO. The shapes of the emission profiles for the different anionic phospholipids studied are indistinguishable.
For CL and PG interacting with NAO, the red signal is at a maximum and the green signal is at a minimum at a stoichiometry that is consistent with our calorimetry experiments (1:2 for CL-NAO and 1:1 for PG-NAO). Both the fluorimetry and calorimetry experiments indicate a 1:1 charge interaction between the phosphate group(s) of each lipid molecule and NAO. As demonstrated in Fig. 3, the peak and valley positions of PA and PS are different from those of PG, even though they should have the same approximate charge as that of PG at pH 8.0. There may be nuances in the PL-specific shape of the fluorescence emission profile of NAO that we did not observe, or thermodynamic interactions other than electrostatic pairing between NAO and PLs, that are important in this context. Our interpretation of these data is that NAO has a lower affinity for PA and PS than for CL and PG.
Figure 3D demonstrates a plot of the ratio of the red to green fluorescence intensities (Γ652/524) of NAO against the mole ratio of lipid to NAO; high values of Γ652/524 are characteristic of the red-shifted fluorescence emitted by NAO. The red shift fluorescence data display a strong peak in the red-shifted emission of NAO with all of the anionic PLs that we tested. As expected, the zwitterionic phospholipid PE does not cause a significant red shift in NAO until PL reaches very high concentrations. Presumably, at higher concentrations of PE, the small fraction of lipids in a negatively charged state, due to exceeding its pKa, becomes significant and causes NAO (at a concentration of 5 μM) to dimerize. As the concentration of PE that causes NAO to red shift is 2 orders of magnitude higher than that of CL, PG, and PA, NAO-PE likely contributes to only a fraction of the red-shifted fluorescence produced when whole cells are labeled with NAO. The more striking aspect of the data presented in Fig. 3 is that the maximum values of Γ652/524 are comparable between CL, PG, and PA.
Similar spectroscopic measurements have been performed with methanol using CL, PG, PA, and an analog of NAO, and the results indicate differences between the red-shifted fluorescence emissions produced by PLs (38). An earlier study demonstrated that treatment of PI and PS with NAO produces a characteristic red fluorescence with an intensity that is 5-fold lower than that for CL (39). In both studies, however, the titrations of PLs into NAO were not extended beyond the concentration at which CL maximally red shifts NAO. Since the maximum red shift of NAO with CL and PG arises at a stoichiometry of 1 NAO molecule to 1 phosphate group, a concentration of PG that is 2-fold higher than that of CL is required to maximally red shift NAO. In titrations using a wider range of concentrations of anionic PLs, we found that PG and PA can produce a Γ652/524 value similar to that of CL (Fig. 3D).
(iii) NAO as a membrane-labeling fluorophore.
The calorimetric and spectral data presented above provide an updated molecular perspective on the binding of NAO to PLs. These data led us to formulate three important conclusions regarding the biophysics of NAO: (i) there is no clear preference of NAO for binding to CL compared to PG, and in fact, NAO binds PG more tightly than it binds CL; (ii) NAO produces an intense red-shifted fluorescence emission with PG, PS, and PA that is comparable to that with CL; and (iii) the intensity of the red-shifted fluorescence of NAO is strongly dependent on its stoichiometry relative to anionic PLs. Since PG is the most abundant anionic PL in many bacterial membranes, we expect PG to compete with CL for binding to and “red shifting” of NAO in vivo. Consequently, experiments with NAO are ideally complemented by other biochemical, biophysical, or genetic methods. NAO remains a useful fluorophore for visualizing anionic PLs.
Fluorescence microscopy of E. coli cells labeled with NAO.
To understand how the promiscuity of NAO binding anionic PLs in vitro translates into in vivo imaging experiments, we studied the signature of NAO fluorescence in strains deficient in CL or PG-CL by microscopy. For the study of cells depleted of CL, we used E. coli K-12 mutant strain MG1655 BKT12, which is deficient in the three CL synthase genes (MG1655 ΔclsABC::kan). This mutant strain is stable and does not display any growth or obvious physiological abnormalities (30). Our analysis of PLs in a minicell-producing E. coli mutant by TLC (see Fig. S4 in the supplemental material) and LC-MS (see Table 4 and Fig. 5) confirmed that this strain is CL deficient. For studies of E. coli cells depleted of both CL and PG, we used an E. coli mutant deficient in the PG synthase gene, UE54 (UE53 ΔpgsA::kan). Our analysis of a minicell-producing strain of UE54 by LC-MS (see Table 4 and Fig. 5) confirmed that it is deficient in PG and CL (52, 53); PG is required for the downstream synthesis of CL (30). We used E. coli strain UE53 as a pseudo-wild-type control since the mutations in UE53 are required for the viability of UE54.
Figure 4 shows representative images of red fluorescence emission in cells of different E. coli strains labeled with NAO (see Fig. S2 in the supplemental material for a comparison with green fluorescence). The optimal conditions for labeling these strains with NAO were determined empirically based on when cells displayed a polarly localized fluorescence signature in wild-type E. coli cells (see Materials and Methods). Our attempts to detect polar localization of red NAO fluorescence using an emission filter centered closer to a λ of 620 nm were unreliable. We believe that this difficulty arises due to the strong emission tail of the green NAO fluorescence, which may wash out the red NAO fluorescence at 620 nm at certain ratios of NAO to lipid (Fig. 3). We observed much clearer labeling of PLs with NAO when we used an emission filter centered at a λ of 685 nm.
The average intensity of red fluorescence across the long axis of cells is shown in Fig. 4. We wrote an Igor Pro script to search for fluorescence peaks at the poles and to calculate the percentage of the total cells that displayed polarly localized red and green fluorescence (see Table 3 and Materials and Methods for details). To avoid confusion in distinguishing between pre- and postdivisional cells, we did not include septating cells in the analysis. Visual inspection of the images, comparison of averaged fluorescence profiles of cells, and results from the peak-finding algorithm indicate a high degree of polar localization of red fluorescence in cells of the two strains with wild-type PL compositions (MG1665 and UE53) and in the ΔclsABC mutant (MG1655 BKT12).
Our labeling experiments indicate that the amount of polarly localized red fluorescence of NAO is drastically reduced in ΔpgsA mutant strain UE54, which lacks both PG and CL. A previous report of UE54 demonstrated that only the green fluorescence of NAO is polarly localized in these cells (35). These experiments led to the hypothesis that the enhancement of green fluorescence at the poles of cells in which PG synthase was knocked out arises from anionic PLs other than CL and PG. By performing mass spectrometry analysis of a minicell-producing mutant of UE54, those authors found that both N-acyl-PE and PA are enhanced at the poles of UE54 cells.
During our in vivo experiments with E. coli mutants, we imaged the green fluorescence emission of NAO and observed that the averaged intensity profiles of green fluorescence in cells occasionally demonstrated polar localization. Results from previous studies with the ΔpgsA mutant (UE53) do not necessarily conflict with our observations, as imaging conditions appear to be critical to these results (35). Perhaps the concentration of NAO used for in vivo experiments is as important for producing red-shifted fluorescence as it is for in vitro titrations of liposomes.
Our labeling results with NAO in ΔclsABC mutant (MG1655 BKT12) cells differ from results of labeling experiments with mutant E. coli cells deficient in a single CL synthase, in which a reduction in polar localization was observed (15, 51) (as also observed for B. subtilis [16]). In fact, we found that the percentage of cells with a polar localization of red and green fluorescence of NAO in the ΔclsABC mutant was consistently higher than that from our observations of wild-type E. coli (Fig. 4 and Table 3; see also Fig. S2 in the supplemental material). We are unsure of what causes this increase in polar NAO labeling, which is also evident at NAO concentrations of <2 μM (see Fig. S2 in the supplemental material). However, a direct comparison of our results with those described previously for CL synthase mutants is challenging, as E. coli strain MG1655 BKT12 lacks all three CL synthase genes. To address this issue, we labeled the single CL synthase knockouts from the Keio collection (54) with NAO under the same conditions as those used for the other mutants studied. We observed polar localization of NAO red fluorescence in cells of all three mutants (see Fig. S3 in the supplemental material).
We hypothesize that differences between our labeling protocol and those of others, namely, the cell density or growth phase used during labeling, may be a reason why we detected polar localization of NAO in the CL synthase knockouts while others have not. We found that the growth phase of the cells has a large impact on polar labeling with NAO, as polar localization of NAO was poor in cells grown to an OD of <0.55 (λ = 600 nm) (data not shown). We are unsure if the requirement for longer growth times is due to the slow uptake of NAO into the membrane or if there is an important physiological change occurring during this growth phase. A future study to address this effect would be illuminating.
The polar localization of red-shifted NAO fluorescence in the triple and single CL synthase knockouts provides further evidence that this fluorophore does not label CL specifically in vivo. Since our in vitro measurements demonstrate that NAO red shifts in the presence of both CL and PG, a lack of polar localization in the ΔpgsA mutant (UE54) implies that the polar pattern of the red NAO signal in the ΔclsABC mutant arises from its interaction with PG.
Analysis of PLs in minicells.
Several studies have measured the relative abundances of the major PLs (PE, PG, and CL) at the poles of E. coli cells without using NAO (21, 51, 55). Those studies used E. coli strains containing mutations in the minCDE operon, which misplaces the division site and produces a mixture of cells of various lengths that is enriched in minicells. By extracting, separating, and quantifying the major PLs contained in the minicells, those authors determined differences in lipid compositions between the poles (minicells) and whole cells (vegetative cells). Using thin-layer chromatography with phosphorus analysis to quantify lipids, two of those papers reported that the abundance of CL is enhanced and that of PG is diminished at the poles in E. coli (21, 51). Quantification of the relative abundances of the major PLs at the cell poles in E. coli mutants deficient in PL synthase genes has not been reported. Classes of PLs can compensate for the loss of CL or PG (17, 19, 24, 51, 56–59); however, aside from a study of UE54 minicells (35), the enhancement of PLs at the poles in lipid-deficient mutants is largely unknown.
We performed LC-MS on lipid extracts of two E. coli mutants and wild-type E. coli and included internal standards for PE, PG, CL, and PA to enable us to determine the relative abundances of the major PL families (Fig. 5 and Table 4), lipid tail lengths, and lipid tail saturation (see Fig. S5 and S6 in the supplemental material). Our choice to use LC-MS (versus TLC and phosphorus analysis) was centered upon its ability to quantitatively measure the composition and abundance of PLs in E. coli membranes. Similarly to previous work on the composition of PLs at the poles in bacteria, we used a complete deletion of the minCDE operon to produce mutants containing both minicells (poles) and vegetative cells (whole cells). We separated and extracted total lipids from cells, analyzed the mixtures by LC-MS, and mined the data to detect signals corresponding to the most abundant PLs in E. coli, including PE, PG, CL, PA, PS, N-acyl-PE, and CDP-diacylglycerol (CDP-DAG). We integrated the signals from the species of each of the major PL types and calculated their relative abundances (see Materials and Methods for details).
Since standards for phosphatidylserine (PS), N-acyl-PE, and CDP-diacylglycerol (CDP-DAG) were not added, we could not obtain relative abundances with respect to other PLs. We did, however, normalize the signals of these trace PLs with respect to the sum of the standardized PLs (e.g., we divided each of the signals of PS, N-acyl-PE, and CDP-DAG by the summed signals of PE, PG, CL, and PA). Hence, a relative comparison of the abundances of each of the trace lipid species among the mutants studied was possible (see Table S1 and Fig. S6 in the supplemental material).
Figure 5 and Table 4 summarize the results of our analysis of the relative abundances of the major PLs in minicell-producing wild-type (WM1032), ΔclsABC (POM10), ΔpgsA parent (UEM53), and ΔpgsA (UEM543) E. coli strains (see Fig. S4 in the supplemental material for analysis by TLC). We found that the relative abundances of PLs in wild-type E. coli are consistent with data from previous reports of whole-cell lipid extracts (17, 59, 60). Our discovery of an enhancement in the CL abundance at the poles of wild-type E. coli cells compared to that in whole cells (∼7.6-fold enhancement by LC-MS and ∼1.6-fold by TLC) is also consistent with data from previous reports (21, 51). Interestingly, our LC-MS data also demonstrate an approximately 2.7-fold enhancement of the concentration of PG at the poles compared to that in whole cells (∼1.5-fold by TLC), matching the asymmetric distribution of CL.
By using TLC, Goodell et al. reported previously that PG, and not CL, is preferentially polarly localized in the membranes of E. coli K-12 minicells (55). A recent review by Romantsov et al. provides one hypothesis for the inconsistency between the results of the minicell experiments of Goodell et al. and those of others—a reduction in the concentration of PG in E. coli minicells (compared to that in vegetative cells) may arise from the conversion of PG to CL after polar septation, thereby suggesting that results may be dependent on the method of minicell separation and extraction (23).
Our results are consistent with an alternative scenario in which both CL and PG abundances are enhanced at the polar membranes in wild-type E. coli cells. Support for this hypothesis comes from the abundance of PLs in the whole cells and poles of the minicell-producing ΔclsABC mutant (POM10). PG appears to compensate for the loss of CL in this mutant, and its polar enhancement is even more pronounced than that in wild-type E. coli (4.4-fold enhancement in PG in the ΔclsABC mutant versus 2.7-fold in the wild type [WM1032] by LC-MS). It is feasible that PG is localized to the cell poles independently of CL, which supports our finding that the abundance of PG is enhanced at the poles in wild-type E. coli cells and is consistent with the polar localization of NAO in the ΔclsABC mutant. We are unsure why TLCs of the ΔclsABC mutant do not show polar localization of PG, but our result is consistent with what was reported previously for wild-type E. coli using TLC (51). It is possible that PG comigrates with other PLs (i.e., have the same Rf value) on the TLC plate, which may also explain some of the other minor discrepancies between our LC-MS and TLC results.
Based on previous reports, we expected to find trace anionic PLs, including PA, N-acyl-PE, and possibly PS and CDP-DAG, enriched at the poles in the pgsA knockout strain (35). In principle, any one of these anionic PLs could compensate for the loss of PG and CL by concentrating at the cell poles. Consistent with data from a previous report (35), we discovered that the concentrations of PA, N-acyl-PE, and CDP-DAG were increased in the ΔpgsA mutant (UEM543) compared to those in the other strains that we tested (Fig. 5; see also Table S1 in the supplemental material). However, none of the anionic phospholipids that we studied, including PS, had an enhanced abundance in the poles (relative to that in whole cells) in the ΔpgsA mutant (see Fig. S5 and S6 and Table S1 in the supplemental material). This finding conflicts with data from a previous report in which N-acyl-PE and PA abundances were enhanced at the poles in the same pgsA knockout strain (35). We concede that the relative abundances of these trace lipids may be artificially decreased at the poles due to lower signal intensities in the minicell lipid fractions. Further studies are required to corroborate these results.
LC-MS is a sensitive analytical technique that provides information on relative abundances of individual lipid species in bacterial membranes. Figures S5 and S6 in the supplemental material summarize the relative abundances of individual fatty acid species for different PLs in whole cells and poles. Figure 6 and Fig. S7 to S12 in the supplemental material demonstrate the abundances normalized to the intensity of all fatty acid species for a given head group. We did not observe shifts or changes in overall fatty acid saturation content or cyclopropanation for any of the mutants that we studied. We did, however, find a significant 2-fold reduction in the concentration of shorter-lipid-tail PE species (C32:1) at the poles with respect to that in whole cells for all three mutants studied (Fig. 6; see also Fig. S7 in the supplemental material). A corresponding 2-fold increase in the concentration of longer-chain PE (C34:1) was measured at the poles for the wild type (WM1032) and the ΔpgsA mutant (UEM543). These two PE species make up >50% of the entire PL content in the cell (see Fig. S5 in the supplemental material).
FIG 6.
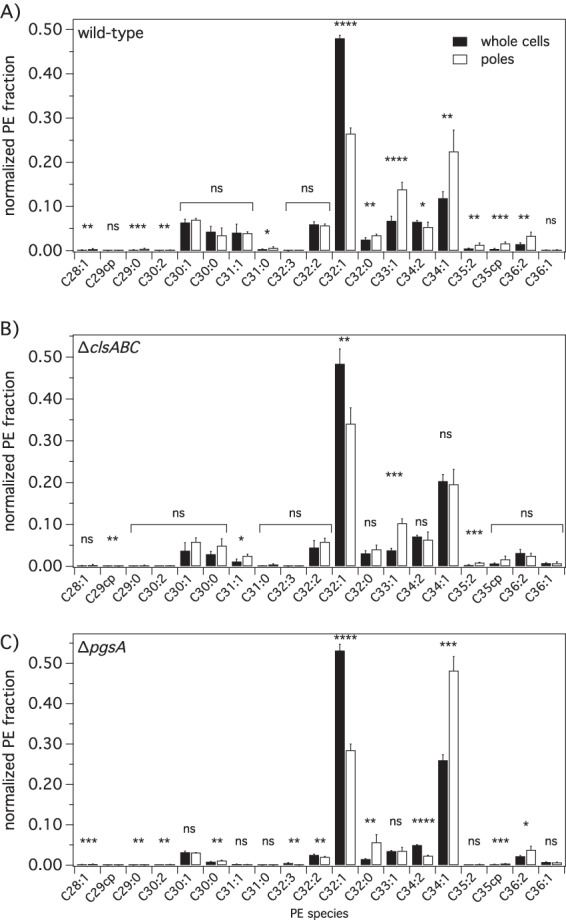
Normalized intensities of PE species in whole cells and poles of wild-type (WM1032) (A), ΔclsABC (POM10) (B), and ΔpgsA (UEM543) (C) E. coli strains determined by LC-MS. Intensities were normalized so that all the intensities of PE species for a particular mutant (whole cells or poles) sum to 1. This comparison is independent of standards and other lipids. To assess differences between lipid species abundances in whole cells and those in poles for the various E. coli strains, we performed chi-squared tests. All tests were two sided, and statistical significance was considered when a P value of <0.05 was observed (ns, nonsignificant; *, P < 0.05; **, P < 0.01; ***, P < 0.001). Error bars indicate the standard deviations of the means (n = 4+ replicates).
Conclusions.
The calorimetry and fluorimetry data for NAO and PL mixtures described in this paper highlight the limitations of using NAO to make quantitative statements regarding CL in membranes (41, 43, 44). We found that NAO binds to anionic PLs promiscuously and displays spectroscopic changes that are inconsistent with a unique interaction between NAO and CL. The characteristic red shift that was formerly attributed to the binding of NAO to CL is not specific; it also occurs with PG, PA, PS, and, we presume, all anionic PLs. The red shift of NAO in the presence of liposomes is consistent with the proximity-driven dimerization of the fluorophore and likely arises from the electrostatic interaction of the cationic quaternary amine of NAO and the anionic phosphate head group(s) of anionic PLs. Since CL is the most abundant anionic PL in mitochondrial membranes, the use of NAO to observe this lipid may still be relevant. In membranes containing a wide range of anionic PLs, NAO can be expected to bind promiscuously to all anionic PLs and shift the fluorescence of this probe. These data should be taken into consideration when interpreting past results of CL localization studies in vivo (e.g., see reference 14). However, in spite of our in vitro and in vivo experiments with NAO, it is still not clear whether the fluorophore influences the physicochemical properties and organization of anionic PLs in membranes. A more in-depth calorimetric study of model membranes may provide insight into the impact of NAO on membrane organization in vivo.
Establishing the experimental limitations of NAO is an important step in determining which lipids are present at the poles in wild-type and ΔclsABC mutant E. coli cells and sets the stage for our LC-MS and TLC experiments with minicell extracts. We discovered, by LC-MS, that wild-type E. coli minicell extracts contain almost equal amounts of PG and CL (TLC shows more than two times as much PG as CL in the minicells) (see Fig. S4A and S4D in the supplemental material). We hypothesize that the polar localization of NAO in wild-type E. coli cells arises from the mixture of CL and PG at the poles. Furthermore, for the E. coli ΔclsABC mutant, LC-MS demonstrated that PG localizes to the polar membrane independently of CL. We did not find any enhancement of PA, PS, N-acyl-PE, and CDP-DAG abundances at the poles in an E. coli mutant that lacks PG and CL. These results are surprising in light of our observation that PA and PS abundances are enhanced at the poles of wild-type and ΔclsABC mutant E. coli cells.
As mentioned in the introduction, one hypothesis for the localization of CL at the poles is curvature-mediated phase segregation of CL domains that relax the strain which accumulate in membranes with a large negative curvature (28). An analogous behavior of liquid crystalline materials has been widely studied in the area of materials science (61, 62). Evidence of PG phase segregation in E. coli was reported previously (63); however, PG does not form an inverted hexagonal phase (in contrast to CL), and its curvature in the presence of divalent cations is ∼10-fold smaller than that of CL (∼0.11 nm−1 for PG compared to ∼1.3 nm−1 for CL) (26, 27, 64). Consequently, the localization of PG by the strain-induced mechanism proposed for CL is possible, yet it remains untested.
The polar localization of PG, PA, and PS that we observed suggests that bacteria maintain the anionic character of polar membranes, even in the absence of CL. This observation may provide a framework for understanding why the depletion of CL does not have dramatic physiological consequences for bacteria. One possibility for the absence of an observable phenotype in the CL synthase mutant(s) is that PG, as well as other anionic PLs, can compensate for the absence of CL and bind to peripheral and integral membrane proteins that require interactions with anionic PLs. The hypothesis that PG can compensate for the loss of CL in polar membranes is supported by observations that many CL-binding proteins bind to PG (19, 24, 56–58). Furthermore, the cellular abundance of PG may be regulated in a manner similar to that of CL, when CL is absent from bacteria (17).
An alternative hypothesis for polar PL localization is that the abundances of PG and CL at the polar membranes arise from the localization of proteins that influence lipid composition. The absence of CL may result in the recruitment of PG to polarly localized proteins. A recent paper provides evidence for a new mechanism of lipid localization along the cylindrical walls of rod-shaped bacterial cells based on protein binding (20), and recent studies in eukaryotic cell biology provide additional support for creating ordered lipid phases (65). The increase in the amount of longer-chain PE lipids that we observed at the poles of E. coli cells may occur by similar mechanisms. Regardless of which hypothesis for the polar localization of anionic PLs in rod-shaped bacterial cells is correct, the biochemical and physiological function of these membrane domains remains an unsolved mystery.
Supplementary Material
ACKNOWLEDGMENTS
We thank the Raetz laboratory (Duke University) for strain MG1655 BKT12, Kouji Matsumoto (Saitama University, Japan) for UE53 and UE54, and Bill Dowhan (University of Texas—Houston Medical School) for UEM543. We thank Kirk Vander Meulen for input on ITC experiments.
This work was supported by National Science Foundation grant DMR-1121288, National Institutes of Health grant 1DP2OD008735-01 (to D.B.W.), an NSF postdoctoral fellowship (award number 1202622 to P.M.O.), a WARF graduate fellowship (to J.A.C.), a Searle scholars award (to A.S.), and grants BIR-9512577 (NSF) and S10 RR13790 (NIH) (to the Biophysics Instrumentation Facility). We gratefully acknowledge the use of facilities and instrumentation supported by the University of Wisconsin Materials Research Science and Engineering Center (award number DMR-1121288).
Footnotes
Published ahead of print 7 July 2014
Supplemental material for this article may be found at http://dx.doi.org/10.1128/JB.01877-14.
REFERENCES
- 1.Werner JN, Chen EY, Guberman JM, Zippilli AR, Irgon JJ, Gitai Z. 2009. Quantitative genome-scale analysis of protein localization in an asymmetric bacterium. Proc. Natl. Acad. Sci. U. S. A. 106:7858–7863. 10.1073/pnas.0901781106 [DOI] [PMC free article] [PubMed] [Google Scholar]
- 2.Kitagawa M, Ara T, Arifuzzaman M, Ioka-Nakamichi T, Inamoto E, Toyonaga H, Mori H. 2005. Complete set of ORF clones of Escherichia coli ASKA library (a complete set of E. coli K-12 ORF archive): unique resources for biological research. DNA Res. 12:291–299. 10.1093/dnares/dsi012 [DOI] [PubMed] [Google Scholar]
- 3.Meile J-C, Wu LJ, Ehrlich SD, Errington J, Noirot P. 2006. Systematic localisation of proteins fused to the green fluorescent protein in Bacillus subtilis: identification of new proteins at the DNA replication factory. Proteomics 6:2135–2146. 10.1002/pmic.200500512 [DOI] [PubMed] [Google Scholar]
- 4.Janakiraman A, Fixen KR, Gray AN, Niki H, Goldberg MB. 2009. A genome-scale proteomic screen identifies a role for DnaK in chaperoning of polar autotransporters in Shigella. J. Bacteriol. 191:6300–6311. 10.1128/JB.00833-09 [DOI] [PMC free article] [PubMed] [Google Scholar]
- 5.Wu LJ, Errington J. 2004. Coordination of cell division and chromosome segregation by a nucleoid occlusion protein in Bacillus subtilis. Cell 117:915–925. 10.1016/j.cell.2004.06.002 [DOI] [PubMed] [Google Scholar]
- 6.Veiga H, Jorge AM, Pinho MG. 2011. Absence of nucleoid occlusion effector Noc impairs formation of orthogonal FtsZ rings during Staphylococcus aureus cell division. Mol. Microbiol. 80:1366–1380. 10.1111/j.1365-2958.2011.07651.x [DOI] [PubMed] [Google Scholar]
- 7.Greenfield D, McEvoy AL, Shroff H, Crooks GE, Wingreen NS, Betzig E, Liphardt J. 2009. Self-organization of the Escherichia coli chemotaxis network imaged with super-resolution light microscopy. PLoS Biol. 7:e1000137. 10.1371/journal.pbio.1000137 [DOI] [PMC free article] [PubMed] [Google Scholar]
- 8.Rudner DZ, Losick R. 2010. Protein subcellular localization in bacteria. Cold Spring Harb. Perspect. Biol. 2:a000307. 10.1101/cshperspect.a000307 [DOI] [PMC free article] [PubMed] [Google Scholar]
- 9.Loose M, Fischer-Friedrich E, Herold C, Kruse K, Schwille P. 2011. Min protein patterns emerge from rapid rebinding and membrane interaction of MinE. Nat. Struct. Mol. Biol. 18:577–583. 10.1038/nsmb.2037 [DOI] [PubMed] [Google Scholar]
- 10.Hsieh W-T, Hsu C-J, Capraro BR, Wu T, Chen C-M, Yang S, Baumgart T. 2012. Curvature sorting of peripheral proteins on solid-supported wavy membranes. Langmuir 28:12838–12843. 10.1021/la302205b [DOI] [PMC free article] [PubMed] [Google Scholar]
- 11.Ramamurthi K, Lecuyer S, Stone H, Losick R. 2009. Geometric cue for protein localization in a bacterium. Science 323:1354–1357. 10.1126/science.1169218 [DOI] [PMC free article] [PubMed] [Google Scholar]
- 12.Ramamurthi KS, Losick R. 2009. Negative membrane curvature as a cue for subcellular localization of a bacterial protein. Proc. Natl. Acad. Sci. U. S. A. 106:13541–13545. 10.1073/pnas.0906851106 [DOI] [PMC free article] [PubMed] [Google Scholar]
- 13.Lenarcic R, Halbedel S, Visser L, Shaw M, Wu LJ, Errington J, Marenduzzo D, Hamoen LW. 2009. Localisation of DivIVA by targeting to negatively curved membranes. EMBO J. 28:2272–2282. 10.1038/emboj.2009.129 [DOI] [PMC free article] [PubMed] [Google Scholar]
- 14.Renner L, Weibel DB. 2011. Cardiolipin microdomains localize to negatively curved regions of Escherichia coli membranes. Proc. Natl. Acad. Sci. U. S. A. 108:6264–6269. 10.1073/pnas.1015757108 [DOI] [PMC free article] [PubMed] [Google Scholar]
- 15.Mileykovskaya E, Dowhan W. 2000. Visualization of phospholipid domains in Escherichia coli by using the cardiolipin-specific fluorescent dye 10-N-nonyl acridine orange. J. Bacteriol. 182:1172–1175. 10.1128/JB.182.4.1172-1175.2000 [DOI] [PMC free article] [PubMed] [Google Scholar]
- 16.Kawai F, Shoda M, Harashima R, Sadaie Y, Hara H, Matsumoto K. 2004. Cardiolipin domains in Bacillus subtilis Marburg membranes. J. Bacteriol. 186:1475–1483. 10.1128/JB.186.5.1475-1483.2004 [DOI] [PMC free article] [PubMed] [Google Scholar]
- 17.Romantsov T, Helbig S, Culham DE, Gill C, Stalker L, Wood JM. 2007. Cardiolipin promotes polar localization of osmosensory transporter ProP in Escherichia coli. Mol. Microbiol. 64:1455–1465. 10.1111/j.1365-2958.2007.05727.x [DOI] [PubMed] [Google Scholar]
- 18.Romantsov T, Battle AR, Hendel JL, Martinac B, Wood JM. 2010. Protein localization in Escherichia coli cells: comparison of the cytoplasmic membrane proteins ProP, LacY, ProW, AqpZ, MscS, and MscL. J. Bacteriol. 192:912–924. 10.1128/JB.00967-09 [DOI] [PMC free article] [PubMed] [Google Scholar]
- 19.Renner LD, Weibel DB. 2012. MinD and MinE interact with anionic phospholipids and regulate division plane formation in Escherichia coli. J. Biol. Chem. 287:38835–38844. 10.1074/jbc.M112.407817 [DOI] [PMC free article] [PubMed] [Google Scholar]
- 20.Strahl H, Bürmann F, Hamoen LW. 2014. The actin homologue MreB organizes the bacterial cell membrane. Nat. Commun. 5:3442. 10.1038/ncomms4442 [DOI] [PMC free article] [PubMed] [Google Scholar]
- 21.Koppelman C-M, Den Blaauwen T, Duursma MC, Heeren R, Nanninga N. 2001. Escherichia coli minicell membranes are enriched in cardiolipin. J. Bacteriol. 183:6144–6147. 10.1128/JB.183.20.6144-6147.2001 [DOI] [PMC free article] [PubMed] [Google Scholar]
- 22.Mileykovskaya E, Dowhan W, Birke RL, Zheng D, Lutterodt L, Haines TH. 2001. Cardiolipin binds nonyl acridine orange by aggregating the dye at exposed hydrophobic domains on bilayer surfaces. FEBS Lett. 507:187–190. 10.1016/S0014-5793(01)02948-9 [DOI] [PubMed] [Google Scholar]
- 23.Romantsov T, Guan Z, Wood JM. 2009. Cardiolipin and the osmotic stress responses of bacteria. Biochim. Biophys. Acta 1788:2092–2100. 10.1016/j.bbamem.2009.06.010 [DOI] [PMC free article] [PubMed] [Google Scholar]
- 24.Gold VAM, Robson A, Bao H, Romantsov T, Duong F, Collinson I. 2010. The action of cardiolipin on the bacterial translocon. Proc. Natl. Acad. Sci. U. S. A. 107:10044–10049. 10.1073/pnas.0914680107 [DOI] [PMC free article] [PubMed] [Google Scholar]
- 25.Barák I, Muchová K, Wilkinson AJ, O'Toole PJ, Pavlendová N. 2008. Lipid spirals in Bacillus subtilis and their role in cell division. Mol. Microbiol. 68:1315–1327. 10.1111/j.1365-2958.2008.06236.x [DOI] [PMC free article] [PubMed] [Google Scholar]
- 26.Powell GL, Hui SW. 1996. Tetraoleoylpyrophosphatidic acid: a four acyl-chain lipid which forms a hexagonal II phase with high curvature. Biophys. J. 70:1402–1406. 10.1016/S0006-3495(96)79698-4 [DOI] [PMC free article] [PubMed] [Google Scholar]
- 27.Rand RP, Sengupta S. 1972. Cardiolipin forms hexagonal structures with divalent cations. Biochim. Biophys. Acta 255:484–492. 10.1016/0005-2736(72)90152-6 [DOI] [PubMed] [Google Scholar]
- 28.Mukhopadhyay R, Huang KC, Wingreen NS. 2008. Lipid localization in bacterial cells through curvature-mediated microphase separation. Biophys. J. 95:1034–1049. 10.1529/biophysj.107.126920 [DOI] [PMC free article] [PubMed] [Google Scholar]
- 29.Schlame M. 2008. Cardiolipin synthesis for the assembly of bacterial and mitochondrial membranes. J. Lipid Res. 49:1607–1620. 10.1194/jlr.R700018-JLR200 [DOI] [PMC free article] [PubMed] [Google Scholar]
- 30.Tan BK, Bogdanov M, Zhao J, Dowhan W, Raetz CR, Guan Z. 2012. Discovery of a cardiolipin synthase utilizing phosphatidylethanolamine and phosphatidylglycerol as substrates. Proc. Natl. Acad. Sci. U. S. A. 109:16504–16509. 10.1073/pnas.1212797109 [DOI] [PMC free article] [PubMed] [Google Scholar]
- 31.Arias-Cartin R, Grimaldi S, Arnoux P, Guigliarelli B, Magalon A. 2012. Cardiolipin binding in bacterial respiratory complexes: structural and functional implications. Biochim. Biophys. Acta 1817:1937–1949. 10.1016/j.bbabio.2012.04.005 [DOI] [PubMed] [Google Scholar]
- 32.Doan T, Coleman J, Marquis KA, Meeske AJ, Burton BM, Karatekin E, Rudner DZ. 2013. FisB mediates membrane fission during sporulation in Bacillus subtilis. Genes Dev. 27:322–334. 10.1101/gad.209049.112 [DOI] [PMC free article] [PubMed] [Google Scholar]
- 33.Makise M, Mima S, Tsuchiya T, Mizushima T. 2001. Molecular mechanism for functional interaction between DnaA protein and acidic phospholipids: identification of important amino acids. J. Biol. Chem. 276:7450–7456. 10.1074/jbc.M009643200 [DOI] [PubMed] [Google Scholar]
- 34.Shibuya I, Miyazaki C, Ohta A. 1985. Alteration of phospholipid composition by combined defects in phosphatidylserine and cardiolipin synthases and physiological consequences in Escherichia coli. J. Bacteriol. 161:1086–1092 [DOI] [PMC free article] [PubMed] [Google Scholar]
- 35.Mileykovskaya E, Ryan A, Mo X, Lin C, Khalaf K, Dowhan W, Garrett T. 2009. Phosphatidic acid and N-acylphosphatidylethanolamine form membrane domains in Escherichia coli mutant lacking cardiolipin and phosphatidylglycerol. J. Biol. Chem. 284:2990–3000. 10.1074/jbc.M805189200 [DOI] [PMC free article] [PubMed] [Google Scholar]
- 36.Garcia Fernandez MI, Ceccarelli D, Muscatello U. 2004. Use of the fluorescent dye 10-N-nonyl acridine orange in quantitative and location assays of cardiolipin: a study on different experimental models. Anal. Biochem. 328:174–180. 10.1016/j.ab.2004.01.020 [DOI] [PubMed] [Google Scholar]
- 37.Kaewsuya P, Danielson ND, Ekhterae D. 2007. Fluorescent determination of cardiolipin using 10-N-nonyl acridine orange. Anal. Bioanal. Chem. 387:2775–2782. 10.1007/s00216-007-1135-0 [DOI] [PubMed] [Google Scholar]
- 38.Kaewsuya P, Miller JD, Danielson ND, Sanjeevi J, James PF. 2008. Comparison of N-alkyl acridine orange dyes as fluorescence probes for the determination of cardiolipin. Anal. Chim. Acta 626:111–118. 10.1016/j.aca.2008.08.002 [DOI] [PubMed] [Google Scholar]
- 39.Gallet PF, Maftah A, Petit JM, Denis-Gay M, Julien R. 1995. Direct cardiolipin assay in yeast using the red fluorescence emission of 10-N-nonyl acridine orange. Eur. J. Biochem. 228:113–119. 10.1111/j.1432-1033.1995.tb20238.x [DOI] [PubMed] [Google Scholar]
- 40.Petit JM, Maftah A, Ratinaud MH, Julien R. 1992. 10-N-Nonyl acridine orange interacts with cardiolipin and allows the quantification of this phospholipid in isolated mitochondria. Eur. J. Biochem. 209:267–273. 10.1111/j.1432-1033.1992.tb17285.x [DOI] [PubMed] [Google Scholar]
- 41.Gohil VM, Gvozdenovic-Jeremic J, Schlame M, Greenberg ML. 2005. Binding of 10-N-nonyl acridine orange to cardiolipin-deficient yeast cells: implications for assay of cardiolipin. Anal. Biochem. 343:350–352. 10.1016/j.ab.2005.04.039 [DOI] [PubMed] [Google Scholar]
- 42.Jacobson J, Duchen MR, Heales SJR. 2002. Intracellular distribution of the fluorescent dye nonyl acridine orange responds to the mitochondrial membrane potential: implications for assays of cardiolipin and mitochondrial mass. J. Neurochem. 82:224–233. 10.1046/j.1471-4159.2002.00945.x [DOI] [PubMed] [Google Scholar]
- 43.Rodriguez ME, Azizuddin K, Zhang P, Chiu S, Lam M, Kenney ME, Burda C, Oleinick NL. 2008. Targeting of mitochondria by 10-N-alkyl acridine orange analogues: role of alkyl chain length in determining cellular uptake and localization. Mitochondrion 8:237–246. 10.1016/j.mito.2008.04.003 [DOI] [PMC free article] [PubMed] [Google Scholar]
- 44.Lobasso S, Saponetti MS, Polidoro F, Lopalco P, Urbanija J, Kralj-Iglic V, Corcelli A. 2009. Archaebacterial lipid membranes as models to study the interaction of 10-N-nonyl acridine orange with phospholipids. Chem. Phys. Lipids 157:12–20. 10.1016/j.chemphyslip.2008.09.002 [DOI] [PubMed] [Google Scholar]
- 45.Schlame M. 2007. Assays of cardiolipin levels. Methods Cell Biol. 80:223–240. 10.1016/S0091-679X(06)80011-7 [DOI] [PubMed] [Google Scholar]
- 46.Cherepanov PP, Wackernagel W. 1995. Gene disruption in Escherichia coli: TcR and KmR cassettes with the option of Flp-catalyzed excision of the antibiotic-resistance determinant. Gene 158:9–14. 10.1016/0378-1119(95)00193-A [DOI] [PubMed] [Google Scholar]
- 47.Datsenko KA, Wanner BL. 2000. One-step inactivation of chromosomal genes in Escherichia coli K-12 using PCR products. Proc. Natl. Acad. Sci. U. S. A. 97:6640–6645. 10.1073/pnas.120163297 [DOI] [PMC free article] [PubMed] [Google Scholar]
- 48.Thomason LC, Costantino N, Court DL. 2007. E. coli genome manipulation by P1 transduction. Curr. Protoc. Mol. Biol. Chapter 1:Unit 1.17. 10.1002/0471142727.mb0117s79 [DOI] [PubMed] [Google Scholar]
- 49.Sliusarenko O, Heinritz J, Emonet T, Jacobs-Wagner C. 2011. High-throughput, subpixel-precision analysis of bacterial morphogenesis and intracellular spatio-temporal dynamics. Mol. Microbiol. 80:612–627. 10.1111/j.1365-2958.2011.07579.x [DOI] [PMC free article] [PubMed] [Google Scholar]
- 50.Bligh EG, Dyer WJ. 1959. A rapid method of total lipid extraction and purification. Can. J. Biochem. Physiol. 37:911–917. 10.1139/o59-099 [DOI] [PubMed] [Google Scholar]
- 51.Romantsov T, Stalker L, Culham DE, Wood JM. 2008. Cardiolipin controls the osmotic stress response and the subcellular location of transporter ProP in Escherichia coli. J. Biol. Chem. 283:12314–12323. 10.1074/jbc.M709871200 [DOI] [PubMed] [Google Scholar]
- 52.Shiba Y, Yokoyama Y, Aono Y, Kiuchi T, Kusaka J, Matsumoto K, Hara H. 2004. Activation of the Rcs signal transduction system is responsible for the thermosensitive growth defect of an Escherichia coli mutant lacking phosphatidylglycerol and cardiolipin. J. Bacteriol. 186:6526–6535. 10.1128/JB.186.19.6526-6535.2004 [DOI] [PMC free article] [PubMed] [Google Scholar]
- 53.Schniederberend M, Zimmann P, Bogdanov M, Dowhan W, Altendorf K. 2010. Influence of K+-dependent membrane lipid composition on the expression of the kdpFABC operon in Escherichia coli. Biochim. Biophys. Acta 1798:32–39. 10.1016/j.bbamem.2009.10.002 [DOI] [PMC free article] [PubMed] [Google Scholar]
- 54.Baba T, Ara T, Hasegawa M, Takai Y, Okumura Y, Baba M, Datsenko KA, Tomita M, Wanner BL, Mori H. 2006. Construction of Escherichia coli K-12 in-frame, single-gene knockout mutants: the Keio collection. Mol. Syst. Biol. 2:2006.0008. 10.1038/msb4100050 [DOI] [PMC free article] [PubMed] [Google Scholar]
- 55.Goodell EW, Schwarz U, Teather RM. 1974. Cell envelope composition of Escherichia coli K12: a comparison of the cell poles and the lateral wall. Eur. J. Biochem. 47:567–572. 10.1111/j.1432-1033.1974.tb03727.x [DOI] [PubMed] [Google Scholar]
- 56.Arias-Cartin R, Grimaldi S, Pommier J, Lanciano P, Schaefer C, Arnoux P, Giordano G, Guigliarelli B, Magalon A. 2011. Cardiolipin-based respiratory complex activation in bacteria. Proc. Natl. Acad. Sci. U. S. A. 108:7781–7786. 10.1073/pnas.1010427108 [DOI] [PMC free article] [PubMed] [Google Scholar]
- 57.Makise M, Mima S, Katsu T, Tsuchiya T, Mizushima T. 2002. Acidic phospholipids inhibit the DNA-binding activity of DnaA protein, the initiator of chromosomal DNA replication in Escherichia coli. Mol. Microbiol. 46:245–256. 10.1046/j.1365-2958.2002.03161.x [DOI] [PubMed] [Google Scholar]
- 58.Powl AM, East JM, Lee AG. 2003. Lipid-protein interactions studied by introduction of a tryptophan residue: the mechanosensitive channel MscL. Biochemistry 42:14306–14317. 10.1021/bi034995k [DOI] [PubMed] [Google Scholar]
- 59.Kikuchi S, Shibuya I, Matsumoto K. 2000. Viability of an Escherichia coli pgsA null mutant lacking detectable phosphatidylglycerol and cardiolipin. J. Bacteriol. 182:371–376. 10.1128/JB.182.2.371-376.2000 [DOI] [PMC free article] [PubMed] [Google Scholar]
- 60.Erez E, Stjepanovic G, Zelazny AM, Brügger B, Sinning I, Bibi E. 2010. Genetic evidence for functional interaction of the Escherichia coli signal recognition particle receptor with acidic lipids in vivo. J. Biol. Chem. 285:40508–40514. 10.1074/jbc.M110.140921 [DOI] [PMC free article] [PubMed] [Google Scholar]
- 61.Lin IH, Miller DS, Bertics PJ, Murphy CJ, de Pablo JJ, Abbott NL. 2011. Endotoxin-induced structural transformations in liquid crystalline droplets. Science 332:1297–1300. 10.1126/science.1195639 [DOI] [PMC free article] [PubMed] [Google Scholar]
- 62.Gupta JK, Zimmerman JS, de Pablo JJ, Caruso F, Abbott NL. 2009. Characterization of adsorbate-induced ordering transitions of liquid crystals within monodisperse droplets. Langmuir 25:9016–9024. 10.1021/la900786b [DOI] [PubMed] [Google Scholar]
- 63.Vanounou S, Parola AH, Fishov I. 2003. Phosphatidylethanolamine and phosphatidylglycerol are segregated into different domains in bacterial membrane. A study with pyrene-labelled phospholipids. Mol. Microbiol. 49:1067–1079. 10.1046/j.1365-2958.2003.03614.x [DOI] [PubMed] [Google Scholar]
- 64.Alley SH, Ces O, Barahona M, Templer RH. 2008. X-ray diffraction measurement of the monolayer spontaneous curvature of dioleoylphosphatidylglycerol. Chem. Phys. Lipids 154:64–67. 10.1016/j.chemphyslip.2008.03.007 [DOI] [PubMed] [Google Scholar]
- 65.Frisz JF, Lou K, Klitzing HA, Hanafin WP, Lizunov V, Wilson RL, Carpenter KJ, Kim R, Hutcheon ID, Zimmerberg J, Weber PK, Kraft ML. 2013. Direct chemical evidence for sphingolipid domains in the plasma membranes of fibroblasts. Proc. Natl. Acad. Sci. U. S. A. 110:E613–E622. 10.1073/pnas.1216585110 [DOI] [PMC free article] [PubMed] [Google Scholar]
- 66.Sun Q, Margolin W. 2001. Influence of the nucleoid on placement of FtsZ and MinE rings in Escherichia coli. J. Bacteriol. 183:1413–1422. 10.1128/JB.183.4.1413-1422.2001 [DOI] [PMC free article] [PubMed] [Google Scholar]
Associated Data
This section collects any data citations, data availability statements, or supplementary materials included in this article.