

Abstract
While adipogenesis is controlled by a cascade of transcription factors, the global gene expression profiles in the early phase of adipogenesis are not well defined. Using microarray analysis of gene expression in 3T3-L1 cells, we have identified evidence for the activity of 2,568 genes during the early phase of adipocyte differentiation. One of these, the ISL1 gene, was of interest since its expression was markedly upregulated 1 h after initiation of differentiation, with a subsequent rapid decline. Overexpression of ISL1 at early times during adipocyte differentiation but not at later times was found to profoundly inhibit differentiation. This was accompanied by moderate downregulation of peroxisome proliferator-activated receptor γ (PPARγ) levels, substantial downregulation of PPARγ downstream genes, and downregulation of bone morphogenetic protein 4 (BMP4) levels in preadipocytes. Readdition of BMP4 overcame the inhibitory effect of ISL1 on the expression of PPARγ but not aP2, a gene downstream of PPARγ, and BMP4 also partially rescued ISL1 inhibition of adipogenesis, an effect which is additive with rosiglitazone. These results suggest that ISL1 is intimately involved in early regulation of adipogenesis, modulating PPARγ expression and activity via BMP4-dependent and -independent mechanisms. Our time course gene expression survey sets the stage for further studies to explore other early and immediate regulators.
INTRODUCTION
Adipogenesis, the differentiation of fibroblast-like mesenchymal stem cells into adipocytes, plays a central role in regulation of whole-body energy metabolism. Adipogenesis is generally described as a 2-step process consisting of a commitment step, wherein committed adipocyte progenitors (or preadipocytes) are generated from multipotent mesenchymal stem cells (MSCs), and a differentiation step, wherein preadipocytes acquire the features of mature, functional adipocytes (1). The 3T3-L1 cell line is a widely accepted adipogenic model, which can be efficiently differentiated into mature adipocytes by hormonal stimulation under experimental conditions (2).
A cascade of sequential transcriptional regulatory bursts underpins adipogenesis. To trigger adipocyte differentiation in vitro, cells are first growth arrested and subsequently treated with differentiation inducers, usually comprising dexamethasone (Dex), 3-isobutyl-1-methylxanthine (IBMX), and insulin (DMI). The earliest inductive event in this process includes the transcriptional activation of KLF4 and Krox20, which stimulate C/EBPβ and C/EBPδ, two members of the C/EBP family of transcription factors (3, 4). C/EBPβ and C/EBPδ then stimulate expression of C/EBPα and proliferator-activated receptor γ (PPARγ), the major late transcription factors (5–7). PPARγ is necessary and sufficient for adipocyte differentiation (8). During the first 48 h of adipogenesis, cells reenter the cell cycle and undergo mitotic clonal expansion (MCE), which is a prerequisite for 3T3-L1 differentiation (9).
Bone morphogenetic proteins (BMPs) regulate diverse physiological processes, including adipose tissue formation (10). BMPs transmit their signals through Smad1/5/8 phosphorylation (11–13). BMP activity is high in 3T3-L1 preadipocytes before treatment with adipocyte differentiation inducers (14). Downregulation of BMP4 activity by treatment with its inhibitor, dorsomorphin, before differentiation induction decreases the expression levels of C/EBPα and PPARγ during adipogenesis and lipid accumulation (15). Hence, BMP4 activity in preadipocytes is required for adipogenesis.
Late-stage adipogenesis has been studied extensively, but less is known about factors governing early adipogenesis. The first 4 h after initiation of differentiation represents a critical time during 3T3-L1 adipogenesis. Several important immediate early regulators of adipogenesis are transiently expressed within 4 h after differentiation induction, including KLF4 and Krox20, which are required for C/EBPβ induction. mRNA levels for these transcription factors reach maximal levels within 2 h after differentiation induction and return to basal levels at about 4 h (3, 4). Several microarray studies have explored global gene expression profiles during adipocyte differentiation, but none of them focused on the first 4 h (16–20). Here we performed a time course microarray study to profile the transcriptome of 3T3-L1 cells prior to induction and at 0.5, 1, 2, 4, 8, and 48 h after the induction of differentiation. Analysis of the temporal expression patterns led us to identify ISL1 as an immediate early regulator of adipogenesis.
(This work was presented as a poster presentation at the Endocrine Society of Australia and the Australian Pediatric Endocrine Group Annual Meetings 2011, 28 to 31 September 2011, Perth, Australia.)
MATERIALS AND METHODS
Antibodies and reagents.
Polyclonal rabbit antibodies raised against C/EBPα, C/EBPβ, C/EBPδ, and 14-3-3 were purchased from Santa Cruz Biotechnology, Inc. (Santa Cruz, CA). Monoclonal mouse antibodies raised against aP2 were purchased from Millipore. Polyclonal rabbit antibodies raised against PPARγ, phosphorylated Smad1/5/8, and Smad1 were purchased from Cell Signaling Technologies (Beverly, MA). Antibodies against mouse monoclonal GLUT4 were described previously (21). Tubulin and mouse Flag (M2) were obtained from Sigma. Rosiglitazone was obtained from GlaxoSmithKline. Recombinant mouse BMP4 and mouse noggin were obtained from R&D. Horseradish peroxidase-conjugated secondary antibodies were obtained from Amersham Biosciences. Paraformaldehyde was obtained from ProSciTech (Thuringowa, Australia). Dulbecco's modified Eagle's medium (DMEM) and newborn calf serum were obtained from Invitrogen. Fetal calf serum was obtained from Trace Scientific (Melbourne, Australia), and antibiotics were obtained from Invitrogen. Bovine serum albumin (BSA) was obtained from Bovogen (Essendon, Australia). Super Signal West Pico chemiluminescent substrate was obtained from Pierce. Protease inhibitor mixture tablets were obtained from Roche Applied Science.
Plasmid, retrovirus, and lentivirus.
Mammalian constructs expressing Flag-ISL1, Flag-HD, Flag-LIM, or BMP4 were generated by using the Gateway system (Invitrogen). Primers including the attB1 and attB2 recombination sites were used to amplify the ISL1 sequences of interest. PCR fragments were introduced into plasmid vector pDONOR221 (Invitrogen) via the BP recombination reaction, according to the manufacturer's recommendations, to generate the entry clones pDONR-Flag-ISL1, pDONR-Flag-HD, pDONR-Flag-LIM, and pDONR-BMP4. Entry clones were then used to perform LR recombination reactions with the Gateway system-compatible expression plasmid pMIG or pQCXIP according to the manufacturer's recommendations. The integrity of all constructs was confirmed by DNA sequencing. pBabe-PPARγ2 containing the full-length Flag-hemagglutinin (HA)-PPARγ2 fusion protein was obtained from Addgene (plasmid 8859). The BMP4 promoter-luciferase constructs −6815/+4513 BMP4Luc and +1532/+4513 BMP4Luc were described previously (22). Retroviral stocks of the pMIG empty vector, pMIG-Flag-ISL1, pMIG-Flag-HD, pMIG-Flag-LIM, the pBabe empty vector, pBabe-Flag-HA-PPARγ2, the pQCXIP empty vector, and pQCXIP-BMP4 were generated by using the Plat-E packaging cell line as described previously (23). Lentiviral stocks of the pLenti-GIII vector and pLenti-GIII-mISL1 were obtained from ABM (Canada).
Culture and differentiation of 3T3-L1 preadipocytes.
3T3-L1 preadipocytes (ATCC, Manassas, VA) were cultured and differentiated to adipocytes as described previously (24). 3T3-L1 preadipocytes were infected with pMIG-GFP, pMIG-GFP/Flag-ISL1, pMIG-GFP/Flag-LIM, and pMIG-GFP/Flag-HD retroviruses, which expressed green fluorescent protein (GFP) only or GFP and Flag-ISL1, Flag-LIM, or Flag-HD. GFP-positive (GFP+) and GFP-negative (GFP−) cells were sorted after 48 h of infection and subjected to further analysis. 3T3-L1 preadipocytes expressing Flag-ISL1 were infected with either pBabe or pBabe-Flag/HA/PPARγ2 retrovirus. After a 24-h recovery period, infected cells were selected with 2 μg/ml puromycin in DMEM supplemented with 10% fetal calf serum. Surviving 3T3-L1 preadipocytes were then grown to confluence and subsequently differentiated into adipocytes.
Preparation of cytoplasmic and nuclear extracts.
Cytoplasmic extracts were prepared by incubating cells in 400 μl buffer A (20 mM HEPES [pH 7.9], 10 mM KCl, 1 mM EGTA, 1 mM dithiothreitol [DTT]) on ice for 15 min, adding 25 μl 10% NP-40, and vortexing the mixture for 10 s, followed by centrifugation at 13,000 × g for 1 min. The supernatant was used as a cytoplasmic extract. The pellet was incubated with buffer B (20 mM HEPES [pH 7.9], 10 mM KCl, 500 mM NaCl, 1 mM EGTA, 1 mM DTT) for 15 min at 4°C, followed by centrifugation at 13,000 × g for 10 min, and the supernatant was used as a nuclear extract.
Western blot analysis.
Cells were washed twice with ice-cold phosphate-buffered saline (PBS) and solubilized in 2% SDS in PBS containing phosphatase inhibitors (1 mM sodium pyrophosphate, 2 mM sodium vanadate, 10 mM sodium fluoride) and a complete protease inhibitor mixture. Insoluble material was removed by centrifugation at 18,000 × g for 10 min. The protein concentration was measured by using the bicinchoninic acid method. Proteins were separated by SDS-PAGE for immunoblot analysis. After proteins were transferred onto polyvinylidene difluoride membranes, the membranes were incubated in blocking buffer containing 5% skim milk in Tris-buffered saline and immunoblotted with relevant antibodies overnight at 4°C in blocking buffer containing 5% BSA–0.1% Tween in Tris-buffered saline. After incubation, membranes were washed, incubated with horseradish peroxidase-labeled secondary antibodies, and then detected by using the Super Signal West Pico chemiluminescent substrate. Quantification of the protein levels was performed by using Odyssey IR imaging system software.
Real-time PCR analysis.
RNA extraction was performed by using TRIzol reagent (Invitrogen Corporation) according to the manufacturer's protocols. An Omniscript reverse transcription (RT) kit (Qiagen) was used for cDNA synthesis. Real-time PCR analysis was performed on a Light Cycler 480 instrument (Roche Applied Science) with the Universal Probe Master system; primers and probes for ISL1, PPARγ, aP2, and BMP4 mouse genes were selected online according to the Universal Probe Library system (Roche Applied Science). mRNA levels were normalized to Cyclophilin B mRNA levels, and the relative mRNA levels were determined by using the comparative threshold cycle (CT) method (25). Primer sequences are 5′-AGCAACCCAACGACAAAACT-3′ and 5′-CCATCATGTCTCTCCGGACT-3′ for ISL1, 5′-GAAAGACAACGGACAAATCACC-3′ and 5′-GGGGGTGATATGTTTGAACTTG-3′ for PPARγ, 5′-AAGAGAAAACGAGATGGTGACAA-3′ and 5′-CTTGTGGAAGTCACGCCTTT-3′ for aP2, 5′-GAGGAGTTTCCATCACGAAGA-3′ and 5′-GCTCTGCCGAGGAGATCA-3′ for BMP4, and 5′-TTCTTCATAACCACAGTCAAGACC-3′ and 5′-ACCTTCCGTACCACATCCAT-3′ for Cyclophilin B.
Microarray.
RNA was purified from 3T3-L1 cells at time zero, immediately prior to induction of differentiation, as well as 0.5, 1, 2, 4, 8, and 48 h after differentiation induction. For each time point, total cellular RNA was isolated from 3T3-L1 cells following treatment with the differentiation cocktail by using an RNeasy minikit (Qiagen GmbH, Germany). Individual RNA from biological triplicates was used for microarray analysis. The RNA quality was assessed by an RNA 6000 Nano assay using an Agilent 2100 bioanalyzer (Agilent Technologies, Palo Alto, CA). Samples were prepared according to the standard Affymetrix one-cycle protocol and hybridized against Affymetrix Mouse Gene 1.0 ST arrays by the Ramaciotti Centre for Gene Function Analysis, University of New South Wales, Australia.
Microarray analysis.
Raw microarray data were summarized to the transcript level by using the oligo R package (26) and normalized by using the robust multiarray average (RMA) method (27). Transcripts that have no gene symbol annotation were removed, leaving a total of 21,759 genes quantified in the time course data. Differentially expressed (DE) genes at each time point were determined by using empirical Bayes modeling and moderated t test methods implemented in the limma R package (28), with a significance threshold of a false discovery rate (FDR) of <0.05 and a fold change of >2. The time course profiles of the union of DE genes from all time points were standardized for visualization by using a fuzzy c-mean clustering algorithm (29). The time course R package was used to calculate the statistical significance of gene expression changes over time (30).
Oil Red O analysis.
For Oil Red O staining, cells expressing Flag-ISL1 or not were cultured in 24-well plates, differentiated, and then washed in PBS and fixed for 2 h with 10% formalin at room temperature. Afterwards, cells were washed with 60% isopropanol, and lipids were subsequently stained with 0.2% Oil Red O dissolved in 60% isopropanol for 10 min. Staining was quantified by dissolving Oil Red O with 100% isopropanol and measuring the absorbance at 500 nm.
Luciferase assays.
For BMP4 promoter activity assays, 3T3-L1 cells overexpressing Flag-ISL1 or the vector were transfected with BMP4 luciferase reporters. Forty-eight hours later, luciferase activities were measured by using the Luciferase Reporter Assay system (Promega). Luminescence values were normalized to tubulin or actin levels, which were determined by Western blotting.
Cell proliferation assay.
A bromodeoxyuridine (BrdU) cell proliferation assay kit was purchased from Cell Signaling Technologies (Beverly, MA). Postconfluent 3T3-L1 preadipocytes in 96-well plates were induced to differentiate with DMI for 24 h or 48 h and labeled for 4 h with 10 μM BrdU. Incorporation of the BrdU label was measured according to the manufacturer's protocol.
Statistical analysis.
Data are expressed as means ± the standard deviations (SD) or standard errors of the means (SEM), as indicated, and P values were calculated by using a two-tailed Student t test and GraphPad Prism.
Microarray data accession number.
Data sets have been deposited in the Gene Expression Omnibus (GEO) archive under series accession number GSE40565.
RESULTS
Gene expression profiles during adipogenesis.
Using a c-mean clustering algorithm, we empirically determined from the time course data 20 clusters that partition the data into distinctive temporal profiles (Fig. 1A; see also Table S1 in the supplemental material for gene lists for each cluster). Based on the expression patterns and annotated functions in the literature, 16 genes were picked from our screen, including genes encoding the well-known important early factors KLF4, EGR2 (Krox20), C/EBPβ, C/EBPδ, TLE3, and KLF5 and 10 potential new adipogenesis mediators (Fig. 1B). These 16 genes were partitioned into three clusters representing early and intermediate responses upon differentiation induction, indicating their potential role in regulating early-stage adipogenesis. Among them, ISL1 was of particular interest because our previous study suggested that ISL1 functions as a potential early adipogenesis regulator (31). It was ranked among the top 5% of the total of 21,759 genes whose expression levels significantly changed over the time course by using a longitudinal empirical Bayes model (Fig. 1C) and was chosen as the novel candidate for our follow-up study.
FIG 1.

Gene expression profiles during early adipogenesis. (A) Temporal profiles of 20 clusters generated from c-mean clustering of time course microarray data. Time points 1 to 7 represent the times shown in panel C. The numbers indicate the number of genes within each cluster. (B) Heat map of 15 selected known or potential candidate genes. The genes are grouped into three rectangles indicating the clusters into which they were partitioned to by the c-mean clustering algorithm. (C) ISL1 as one of the top-ranked genes that were significantly changed over the time course. The expression value from triplicate experiments indicates that the microarray measurements are highly reproducible.
The ISL1 expression level is transiently increased in 3T3-L1 cells after differentiation induction.
Quantitative RT-PCR revealed that ISL1 was expressed in preconfluent 3T3-L1 preadipocytes before differentiation induction, and the expression level of ISL1 increased quickly and transiently after differentiation induction (Fig. 2A). The ISL1 mRNA level peaked at 2.3 h to a level that was 30-fold higher than that in postconfluent 3T3-L1 preadipocytes. Protein levels for ISL1 were consistent with the mRNA levels (Fig. 2B). ISL1 expression was induced by Dex or IBMX alone or in combination and was slightly reduced by insulin alone (Fig. 2C). These results show that ISL1 is expressed very early in the course of 3T3-L1 differentiation, with a subsequent rapid decline.
FIG 2.
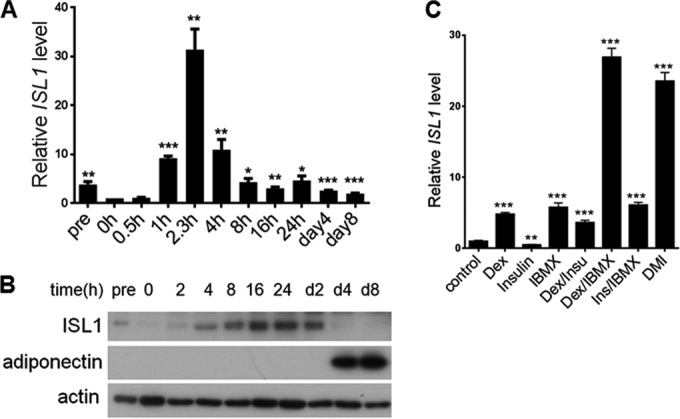
ISL1 expression during 3T3-L1 cell differentiation. (A and B) ISL1 mRNA and protein levels at the indicated time points during adipogenesis. (A) Total RNA was isolated from 3T3-L1 cells. Gene expression of ISL1 was measured by quantitative real-time RT-PCR. Expression levels at day 0 are indicated as 1. Error bars indicate SEM of data from three independent experiments, with each experiment being performed in triplicate. pre indicates preconfluent 3T3-L1 cells. (B) Nuclear fractions of 3T3-L1 cells were subjected to SDS-PAGE, and ISL1 and adiponectin were detected by immunoblotting. Actin served as a loading control. (C) ISL1 mRNA levels in response to different treatments. Total RNA was isolated from 3T3-L1 cells treated under different conditions, as indicated, and measured by quantitative real-time RT-PCR.
ISL1 overexpression inhibits adipogenesis.
To address the role of ISL1 in adipogenesis, Flag-ISL1 was stably overexpressed in 3T3-L1 cells by retroviral infection (Fig. 3A), and overexpressed ISL1 was located primarily in the nuclear fraction of transfected cells (Fig. 3B). ISL1 overexpression inhibited lipid accumulation (Fig. 3C to E) and expression of adipogenic markers (Fig. 3F). Overexpression of either the LIM domain or HD domain of ISL1 did not affect adipocyte differentiation (Fig. 3G and H). To determine at what stage ISL1 has its inhibitory effect on adipogenesis, we next infected 3T3-L1 cells at different times prior to differentiation with a lentivirus expressing full-length ISL1. Overexpression of ISL1 induced by lentiviral infection was mildly increased (about 2-fold) compared to native ISL1 levels (Fig. 3I), in contrast to the very substantial retroviral overexpression. Transient overexpression of ISL1 at day −5, −3, or −1 before differentiation induction significantly decreased lipid accumulation, whereas infection at day 0, just prior to differentiation induction, was without effect (Fig. 3J and K). These results suggest that ISL1 acts as an early repressor of adipogenesis in 3T3-L1 cells and that this inhibitory function of ISL1 requires the entire protein.
FIG 3.

ISL1 overexpression inhibits adipogenesis. (A) Overexpression of Flag-ISL1 in 3T3-L1 preadipocytes. 3T3-L1 preadipocytes were infected with retrovirus that expressed GFP only or GFP and Flag-ISL1. Forty-eight hours later, ∼11% of low-level-GFP+ cells were sorted and used for further experiments. Flag-ISL1 expression levels (in the low-level fraction) were compared to those in control cells 8 h after differentiation induction by Western blotting. (B) Nuclear (Nuc) and cytosolic (Cyto) fractions of 3T3-L1 preadipocytes overexpressing Flag-ISL1 were subjected to SDS-PAGE using anti-ISL1 antibody. Tubulin served as a cytosolic marker, histone H3 (Histon) served as a nuclear marker, and actin served as a loading control. (C) ISL1 overexpression inhibits adipocyte differentiation. Postconfluent preadipocytes expressing Flag-ISL1 or not were induced to differentiate for 8 days, and images were collected. (D) Oil Red O staining of lipid droplets in 3T3-L1 cells overexpressing Flag-ISL1 or not at day 8 after differentiation induction. (E) Quantification of the experiment shown in panel D. Error bars indicate SEM of data from three independent experiments, with each experiment being performed in triplicate (***, P < 0.001). OD500, optical density at 500 nm. (F) ISL1 inhibits adipocyte marker expression. Postconfluent preadipocytes expressing Flag-ISL1 or not were induced to differentiate for different times, as indicated; the cell lysates were subjected to SDS-PAGE; and aP2, PPARγ, and C/EBPα were detected by immunoblotting. Tubulin served as a loading control. (G and H) The LIM domain or HD domain of ISL1 has no effect on adipocyte differentiation. Postconfluent preadipocytes overexpressing Flag-ISL1, Flag-LIM, or Flag-HD were induced to differentiate for 8 days, pictures were collected (G), and cells were subjected to Oil Red O staining (H). Error bars indicate SD of data from triplicate experiments. (I) Overexpression of ISL1 by lentiviral infection. 3T3-L1 preadipocytes were infected with lentivirus encoding ISL1 or the empty vector for 24 h. At 48 h postinfection, ISL1 expression levels were compared to those in control cells 8 h after differentiation induction by Western blotting. NC, normal control. (J and K) Effect of transient ISL1 overexpression at different time points on adipogenesis. Confluent 3T3-L1 cells were infected with lentivirus encoding ISL1 or the empty vector for 24 h at different time points, as indicated, and cells were induced to differentiate at day 0 and then stained by Oil Red O (J) or analyzed by SDS-PAGE (K) at day 9.
C/EBPβ and C/EBPδ are two transcription factors that are important during early adipocyte differentiation, upstream of C/EBPα and PPARγ, and C/EBPβ is required for mitotic clonal expansion (MCE) (32). ISL1 overexpression did not inhibit the expression of either C/EBPβ or C/EBPδ (Fig. 4A), nor did it inhibit subsequent MCE (Fig. 4B).
FIG 4.
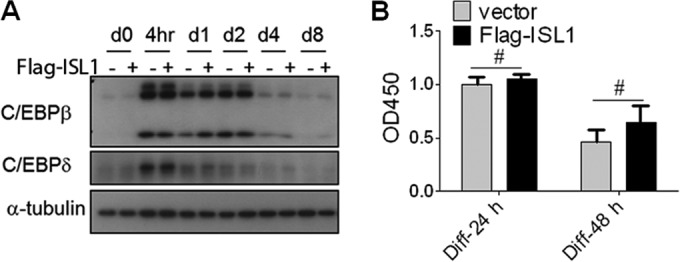
ISL1 overexpression does not inhibit expression of C/EBPβ and C/EBPδ or mitotic clonal expansion. (A) Effect of ISL1 on protein levels of C/EBPβ and C/EBPδ. Postconfluent preadipocytes expressing Flag-ISL1 or not were induced to differentiate, and the cell lysates at different time points, as indicated, were subjected to SDS-PAGE. (B) Effect of ISL1 on mitotic clonal expansion of 3T3-L1 preadipocytes measured by a BrdU assay. The values were determined relative to values for control cells. Error bars indicate SD of data from triplicate experiments (#, P > 0.05).
PPARγ and rosiglitazone can rescue differentiation of ISL1-overexpressing cells.
We next examined the possible interaction between ISL1 and the PPARγ pathway, since this pathway is activated downstream of C/EBPβ and -δ. We first explored the effects of a PPARγ agonist (rosiglitazone); however, this agonist only partially rescued the ISL1 block. Similarly, overexpression of the PPARγ2 receptor alone only partially rescued the inhibitory effect of ISL1 on adipogenesis. Intriguingly, stable overexpression of PPARγ2 combined with rosiglitazone treatment caused a substantial rescue of the ISL1 block (Fig. 5A to C). These results indicate that both the expression and activity of PPARγ are involved in the inhibitory effect of ISL1 on adipogenesis.
FIG 5.

Effects of PPARγ2 and rosiglitazone to rescue differentiation of ISL1-overexpressing cells. (A and B) Postconfluent preadipocytes overexpressing Flag-ISL1, PPARγ2, Flag-ISL1 and PPARγ2, or the vector were induced to differentiate in the presence of 1 μM rosiglitazone (Rosi) or not, as indicated, for 8 days. Cells were subjected to Oil Red O staining (A), or cell lysates were subjected to SDS-PAGE (B). PPARγ, C/EBPα, and aP2 were detected by immunoblotting; actin served as a loading control. (C) Quantification of immunoblots. Error bars indicate SEM of data from three independent experiments (*, P < 0.05; **, P < 0.01; ****, P < 0.0001).
ISL1 inhibits BMP4 expression and function.
To determine the mechanism of the ISL1 effect on adipocyte differentiation, we next examined changes in global gene expression in ISL1-overexpressing 3T3-L1 preadipocytes and control cells at 0 h. Among those genes regulated by ISL1, BMP4 was of particular interest, since it was substantially downregulated in ISL1-expressing cells, and BMP4 is required for the onset of adipocyte differentiation (33). ISL1 overexpression did not affect the expression of other BMPs except BMP3b, a repressor of 3T3-L1 adipogenesis (34), which was partially inhibited (Fig. 6A). Our quantitative PCR (qPCR) data revealed that the BMP4 mRNA level was decreased by 90% 6 h after adipocyte induction in wild-type 3T3-L1 cells (Fig. 6B). ISL1 overexpression exerted a moderate repressive effect on BMP4 expression in preconfluent 3T3-L1 cells and a strong repressive effect on BMP4 expression in postconfluent 3T3-L1 cells at day 0 (Fig. 6C), concomitant with the reduced phosphorylation of Smad1/5/8, a downstream target of BMP4 (Fig. 6D and E). Furthermore, gene set enrichment analysis (GSEA) indicated that BMP-Smad signaling pathway gene sets were downregulated by ISL1 overexpression in preadipocytes (data not shown). To determine whether ISL1 regulates BMP4 gene transcription, we performed transient-transfection studies of luciferase reporter constructs with different regions of the BMP4 promoter. In preconfluent cells, ISL1 overexpression moderately reduced BMP4 promoter activity in the region spanning positions −6815 to +4513 but had no effect on the region spanning positions +1532 to +4513. In postconfluent 3T3-L1 cells, ISL1 overexpression strongly reduced BMP4 promoter luciferase activity in the region spanning positions −6815 to +4513 and moderately reduced BMP4 promoter activity in the region spanning positions +1532 to +4513 (Fig. 6F). In addition, ISL1 overexpression in HEK293 cells had no effect on BMP4 promoter activity (data not shown), which means that ISL1 does not inhibit BMP4 promoter activity directly. Taken together, these data show that ISL1 indirectly inhibits BMP4 gene transcription and function in preadipocytes.
FIG 6.

ISL1 inhibits BMP4 expression and function. (A) Effect of ISL1 on BMPs. Total RNA was isolated from postconfluent 3T3-L1 cells overexpressing Flag-ISL1 or not and subjected to a microarray assay. (B) BMP4 expression. Total RNA was extracted at the indicated times and subjected to quantitative real-time RT-PCR, and values were normalized to cyclophilin values. Expression levels at day 0 are indicated as 1. Error bars indicate SEM of data from three independent experiments, with each experiment being performed in triplicate. (C) ISL1 inhibits BMP4 expression. Total RNA was extracted from pre- or postconfluent preadipocytes (day 0) expressing Flag-ISL1 or not, BMP4 expression was measured by quantitative real-time RT-PCR, and values were normalized to cyclophilin values. Error bars indicate SEM of data from three independent experiments, with each experiment being performed in triplicate. (D) Effect of ISL1 on phosphorylation of Smad1/5/8 (pSmad1/5/8). The cell lysates of postconfluent preadipocytes overexpressing Flag-ISL1 or not were subjected to SDS-PAGE. (E) Quantification of immunoblots for phosphorylation of Smad1/5/8. Error bars indicate SEM of data from three independent experiments (**, P < 0.01; ****, P < 0.0001). (F) Effect of ISL1 on BMP4 promoter activity. Luciferase reporter constructs carrying the different promoter regions of BMP4, as indicated, were transfected into pre- or postconfluent 3T3-L1 cells overexpressing Flag-ISL1 or not. Results are expressed as firefly luciferase activity normalized to protein levels; firefly luciferase activity in control cells is indicated as 1. Error bars indicate SEM of data from three independent experiments (**, P < 0.01; ***, P < 0.001; #, P > 0.05).
BMP4 rescues differentiation of ISL1-overexpressing 3T3-L1 cells.
We exposed 3T3-L1 cells to noggin, a naturally occurring BMP binding antagonist (35), during preadipocyte proliferation. Noggin exposure reduced phosphorylation of Smad1/5/8 (Fig. 7A) and blocked lipid accumulation (Fig. 7B), suggesting that secreted BMP4 is required for 3T3-L1 cell differentiation. Thus, a reduction in BMP4 expression, as observed in ISL1-overexpressing cells, could be the mechanism for ISL1's inhibition of adipogenesis. Consistent with this hypothesis, recombinant BMP4 treatment during proliferation significantly, but not completely, rescued both lipid accumulation (Fig. 7C) and the expression of adipocyte markers (Fig. 7D and E) in ISL1-overexpressing 3T3-L1 cells. BMP4 overexpression had an effect similar to that of recombinant BMP4 on rescuing ISL1 inhibition of adipogenesis, and the rescue effect was additive with rosiglitazone (Fig. 7F). In 3T3-L1 preadipocytes, ISL1 overexpression reduced PPARγ mRNA levels by ∼40% and reduced aP2 mRNA levels by ∼90% (aP2 is a bona fide PPARγ downstream gene). Overexpression of BMP4 completely rescued the expression of PPARγ but rescued aP2 to only ∼30% of the level seen in control cells (Fig. 7G and H), suggesting that BMP4 cannot completely rescue PPARγ activity in ISL1-overexpressing 3T3-L1 cells. Nevertheless, these results show that BMP4 can partially rescue ISL1 inhibition of adipogenesis, suggesting that ISL1 negatively regulates adipogenesis via BMP4-dependent and -independent mechanisms.
FIG 7.

BMP4 rescues differentiation of ISL1-overexpressing 3T3-L1 cells. (A and B) Effect of noggin on adipogenesis. 3T3-L1 preadipocytes were cultured without or with noggin at 100 ng/ml until cells reached postconfluence and then differentiated into adipocytes according to standard protocols. (A) On day 0, before differentiation induction, whole-cell lysates were subjected to SDS-PAGE, and phosphorylation of Smad1/5/8 was detected by immunoblotting. (B) On day 8, the accumulation of cytoplasmic triglyceride was assessed by Oil Red O staining. (C to E) Effect of recombinant BMP4 on ISL1 inhibition of adipogenesis. 3T3-L1 preadipocytes overexpressing Flag-ISL1 or not were cultured with or without BMP4 at 100 ng/ml until cells reached postconfluence and then differentiated into adipocytes according to standard protocols. (C and D) On day 8, the accumulation of cytoplasmic triglyceride was assessed by Oil Red O staining (C), whole-cell extracts were subjected to SDS-PAGE, and C/EBPα, PPARγ, and aP2 were detected by immunoblotting (D). (E) Quantification of immunoblots. Error bars indicate SEM of data from two independent experiments. (F) Effect of BMP4 overexpression on ISL1 inhibition of adipogenesis. Postconfluent 3T3-L1 preadipocytes overexpressing Flag-ISL1 or Flag-ISL1/BMP4 were differentiated into adipocytes according to standard protocols. On day 9, the accumulation of cytoplasmic triglyceride was assessed by Oil Red O staining. (G and H) Total RNA was extracted from 3T3-L1 preadipocytes overexpressing Flag-ISL1 or Flag-ISL1/BMP4, and gene expression levels of PPARγ and aP2 were measured by quantitative real-time RT-PCR and normalized to cyclophilin values (*, P < 0.05; **, P < 0.01; ***, P < 0.001).
BMP4 pathway activity has been reported to upregulate PPARγ expression (36, 37), while the effect of BMP4 on PPARγ activity is unknown. Our results showed that BMP4 treatment did not increase PPARγ transcriptional activity in HEK293 cells and 3T3-L1 preadipocytes, indicating that BMP4 treatment had no direct effect on PPARγ activity (data not shown). It is possible that BMP4 activity prior to differentiation induction is required for PPARγ transcriptional activity during differentiation. To test this hypothesis, we compared the effects of BMP4 overexpression with rosiglitazone in combination with a different differentiation component(s) (Fig. 8). IBMX and insulin (MI) could not induce differentiation of 3T3-L1 preadipocytes alone or together without Dex. Similarly, rosiglitazone or BMP4 overexpression did not promote differentiation alone without Dex, but it did induce differentiation in the presence of Dex. BMP4 and Dex induced differentiation to a level almost equivalent to that observed with the traditional DMI cocktail. These results suggest that rosiglitazone or BMP4 overexpression has a function similar to that of IBMX and insulin, both of which increase PPARγ transcriptional activity by generating an endogenous PPARγ agonist(s) during differentiation (38, 39). In addition, when combined with Dex plus IBMX (DM) or Dex plus insulin (DI), BMP4 and BMP4-rosiglitazone have the same effect on differentiation induction, which means that PPARγ reached its maximal activity when BMP4 was combined with DM or DI, and BMP4 could increase PPARγ activity during adipocyte differentiation.
FIG 8.
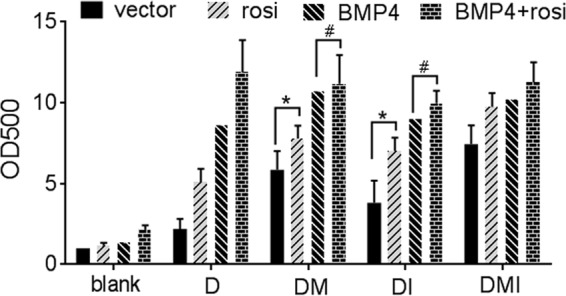
BMP4 overexpression increases PPARγ activity during adipocyte differentiation. Parental or BMP4-overexpressing 3T3-L1 preadipocytes were treated with dexamethasone (D) or combinations of dexamethasone IBMX (M), and insulin (I) (versus blank) with or without the addition of rosiglitazone from day 0 to day 3; treated with insulin (versus blank) with or without the addition of rosiglitazone from day 3 to day 6; and then cultured in fresh medium from day 6 to day 8. On day 8, differentiation was assessed by Oil Red O staining. Error bars indicate SEM of data from three independent experiments, with each experiment being performed in triplicate (*, P < 0.05; #, P > 0.05).
DISCUSSION
Adipogenesis is controlled by a cascade of transcription factors that act to induce the expression of gene products necessary for the acquisition of the characteristic morphology and specialized functions of adipocytes (40). Immediate early regulators expressed within 4 h of differentiation induction have been shown to be important for adipocyte differentiation, for example, KLF4 (3), Krox20 (4), C/EBPβ, and C/EBPδ. In this study, we identified ISL1 as a novel regulator of early adipogenesis.
ISL1 gene expression is induced early during adipogenesis in response to IBMX or dexamethasone, two of the components of the standard induction cocktail. Stable ISL1 overexpression significantly inhibited 3T3-L1 cell differentiation (Fig. 3C to F), and transient ISL1 overexpression prior to but not immediately after differentiation markedly decreased adipogenesis (Fig. 3J and K). These data suggest that ISL1 acts at a very early time point in adipocyte differentiation. Although levels of stably overexpressed ISL1 were ∼10-fold higher than those of native ISL1 (Fig. 3A), levels of transiently overexpressed ISL1 were elevated only ∼2-fold (Fig. 3I), which indicates that the effect of ISL1 stably overexpressed by retrovirus is not simply related to the degree of elevation of expression. 3T3-L1 cells produce endogenous PPARγ ligands to activate PPARγ activity during early adipogenesis, and PPARγ is one of the master genes for adipocyte differentiation, which is required and sufficient for adipocyte differentiation induction (8, 41). Consistent with an important role for ISL1 in the PPAR program, PPARγ overexpression partially rescued differentiation in ISL1-overexpressing cells and completely rescued differentiation in the presence of rosiglitazone. These results suggest that ISL1 plays a role in regulating both the expression and activity of PPARγ.
ISL1 overexpression moderately reduced PPARγ mRNA levels and greatly reduced mRNA levels of its bona fide target genes in preadipocytes, such as aP2, adiponectin, and CD36 in 3T3-L1 preadipocytes (data not shown). This suggests that ISL1 overexpression inhibits basal PPARγ expression and activity in preadipocytes. The BMP pathway has been reported to regulate both PPARγ expression and transcriptional activity (36, 42). Interestingly, BMP4 expression was markedly inhibited by ISL1 overexpression. BMP4 is expressed in preadipocytes, and its level decreases rapidly after differentiation induction. BMP4 activity in preadipocytes is required for adipocyte differentiation, and BMP4 inhibitor treatment after differentiation induction has no effect on terminal differentiation (14). Similarly, ISL1 overexpression late in differentiation does not inhibit adipocyte differentiation (Fig. 3J and K). Collectively, these data suggest that the inhibitory effect of ISL1 overexpression on adipogenesis is mediated via inhibition of BMP4 expression, which in turn leads to reduced PPARγ expression and reduced production of its ligand. BMP4 promoter studies show that ISL1 inhibits BMP4 promoter activity in 3T3-L1 cells but not in HEK293 cells and that inhibition is more potent in postconfluent 3T3-L1 cells than in preconfluent cells (Fig. 6F). These results indicate that ISL1 inhibits BMP4 promoter activity indirectly, probably via a downstream factor(s). In addition, ISL1 decreases phosphorylation of Smad1/5/8, which is downstream in the BMP pathway. After differentiation induction, ISL1 mRNA levels peak at 2.3 h, and ISL1 protein levels are increased significantly at 4 h. In contrast, the BMP4 mRNA level is greatly decreased at 6 h, which is inversely correlated with ISL1 levels. The ISL1 level transiently increases after differentiation induction, likely leading to repression of BMP4 expression, which remains repressed throughout the adipogenic process. This supports the conclusion that ISL1 indirectly inhibits BMP4 expression. We cannot exclude the possibility that BMP4 expression is also regulated by other unknown mechanisms independent of ISL1.
In ISL1-overexpressing 3T3-L1 preadipocytes, BMP4 overexpression completely rescues ISL1 inhibition of basal PPARγ gene expression but not of its bona fide downstream gene, aP2. This indicates that BMP4 does not regulate PPARγ activity in preadipocytes, meaning that ISL1 inhibition of PPARγ activity is BMP4 independent. Consistent with this, BMP4 and rosiglitazone alone partially rescued ISL1 inhibition of adipogenesis, but in combination, they almost completely rescued this inhibition. ISL1 did not interact with PPARγ (data not shown) and had no direct effect on PPARγ activity, as indicated by the PPARγ response element luciferase assay in HEK293 cells (data not shown). This suggests that ISL1 indirectly regulates PPARγ activity.
BMPs have an important role in the commitment of pluripotent stem cells to preadipocytes (43). The addition of BMP4 to the culture medium stimulated adipocyte differentiation of multipotential C3H10T1/2 cells (44, 45) and mouse embryonic fibroblasts (46). The regulation of preadipocyte levels of PPARγ has been suggested to be a crucial determinant of preadipocyte commitment. BMP4 has been reported to regulate PPARγ expression to mediate the preadipocyte commitment activity of Zfp423 and WISP2 (36, 37). It is possible that the BMP4/PPARγ pathway in preadipocytes is required for 3T3-L1 cells to maintain the proadipogenic state, and ISL1 overexpression affects the proadipogenic state of 3T3-L1 cells by reducing the expressions of BMP4 and PPARγ. ISL1 knockdown or knockout might lead to sustained BMP4 expression during adipocyte differentiation. BMP4 treatment of 3T3-L1 adipocytes increased the expression of PRDM16, a key inducer of brown adipocyte development (47, 48), and fat-specific BMP4 overexpression induces brown-fat-like effects on white fat (49), which is metabolically beneficial. ISL1 knockdown or knockout should have effects similar to those of BMP4 overexpression. For unknown reasons, ISL1 has been resistant to knockdown using a range of short interfering RNAs (siRNAs) and short hairpin RNAs (shRNAs), so this hypothesis needs to be examined further in the future.
ISL1 belongs to the LIM homeobox gene family and plays an important role in the development of pancreatic islets, motor neurons, and cardiac tissue (50–52). We previously found that ISL1 expression was virtually absent in subcutaneous fat (SF) but substantially expressed in the stromovascular (preadipocyte-containing) fraction of visceral fat (VF) and that its expression correlated inversely with adiposity in rodents and humans (31). Serum BMP4 levels are increased in individuals with obesity or metabolic syndrome (53), suggesting an inverse correlation of ISL1 and BMP4 levels in vivo. Forced expression of a BMP4 transgene in white adipocytes of mice induces brown-fat-like changes of white adipose tissue (WAT) (49). Given that ISL1 is expressed at high levels in VF but not in SF, we predict that BMP4 expression in VF but not in SF is normally repressed by ISL1, with BMP4 having a role in SF, which could be beneficial for metabolic disease. This suggests an additional level of control that might distinguish different white adipose depots. The differentiation potential is different for preadipocytes isolated from SF or VF. In a defined serum-free medium, PPARγ agonists markedly enhance the differentiation of preadipocytes isolated from SF but not of preadipocytes from VF of same individuals (54). In vivo, subcutaneous but not visceral fat expands in response to PPARγ agonists (55, 56). The mechanisms by which SF and VF have different sensitivities to PPARγ agonists are still unknown. ISL1 decreases PPARγ levels and activity in preadipocytes and is expressed in VF but not SF; thus, ISL1 in VF may be responsible for the downregulation of the PPARγ response.
In this study, our gene expression survey sets the stage for further studies to explore the immediate early regulators of adipogenesis. In addition, our results show that upregulation of ISL1 inhibits PPARγ expression and activity in preadipocytes, which might provide an explanation for why subcutaneous but not visceral fat expands in response to PPARγ agonists. At the same time, our results suggest that ISL1 reduces BMP4 expression during adipocyte differentiation. Previously, we found that adipose tissue ISL1 expression is prominent in VF but not SF. As abdominal obesity strongly correlates with insulin resistance and cardiovascular risk (57, 58), we postulate that ISL1 downregulation may lead to upregulation of BMP4, which may favorably impact abdominal obesity and its concomitant metabolic disturbances.
Supplementary Material
ACKNOWLEDGMENTS
This work was supported by the National Health and Medical Research Council of Australia.
We thank the Peter Wills Bioinformatics Centre at the Garvan Institute for valuable assistance in microarray data analysis.
We declare that we have no competing interests.
Footnotes
Published ahead of print 21 July 2014
Supplemental material for this article may be found at http://dx.doi.org/10.1128/MCB.00583-14.
REFERENCES
- 1.Rosen ED, Spiegelman BM. 2014. What we talk about when we talk about fat. Cell 156:20–44. 10.1016/j.cell.2013.12.012 [DOI] [PMC free article] [PubMed] [Google Scholar]
- 2.Green H, Kehinde O. 1975. An established preadipose cell line and its differentiation in culture. II. Factors affecting the adipose conversion. Cell 5:19–27 [DOI] [PubMed] [Google Scholar]
- 3.Birsoy K, Chen Z, Friedman J. 2008. Transcriptional regulation of adipogenesis by KLF4. Cell Metab. 7:339–347. 10.1016/j.cmet.2008.02.001 [DOI] [PMC free article] [PubMed] [Google Scholar]
- 4.Chen Z, Torrens JI, Anand A, Spiegelman BM, Friedman JM. 2005. Krox20 stimulates adipogenesis via C/EBPbeta-dependent and -independent mechanisms. Cell Metab. 1:93–106. 10.1016/j.cmet.2004.12.009 [DOI] [PubMed] [Google Scholar]
- 5.Cao Z, Umek RM, McKnight SL. 1991. Regulated expression of three C/EBP isoforms during adipose conversion of 3T3-L1 cells. Genes Dev. 5:1538–1552. 10.1101/gad.5.9.1538 [DOI] [PubMed] [Google Scholar]
- 6.Lane MD, Tang QQ, Jiang MS. 1999. Role of the CCAAT enhancer binding proteins (C/EBPs) in adipocyte differentiation. Biochem. Biophys. Res. Commun. 266:677–683. 10.1006/bbrc.1999.1885 [DOI] [PubMed] [Google Scholar]
- 7.Yeh WC, Cao Z, Classon M, McKnight SL. 1995. Cascade regulation of terminal adipocyte differentiation by three members of the C/EBP family of leucine zipper proteins. Genes Dev. 9:168–181. 10.1101/gad.9.2.168 [DOI] [PubMed] [Google Scholar]
- 8.Rosen ED, Hsu CH, Wang X, Sakai S, Freeman MW, Gonzalez FJ, Spiegelman BM. 2002. C/EBPalpha induces adipogenesis through PPARgamma: a unified pathway. Genes Dev. 16:22–26. 10.1101/gad.948702 [DOI] [PMC free article] [PubMed] [Google Scholar]
- 9.Tang QQ, Otto TC, Lane MD. 2003. Mitotic clonal expansion: a synchronous process required for adipogenesis. Proc. Natl. Acad. Sci. U. S. A. 100:44–49. 10.1073/pnas.0137044100 [DOI] [PMC free article] [PubMed] [Google Scholar]
- 10.Chang H, Brown CW, Matzuk MM. 2002. Genetic analysis of the mammalian transforming growth factor-beta superfamily. Endocr. Rev. 23:787–823. 10.1210/er.2002-0003 [DOI] [PubMed] [Google Scholar]
- 11.Derynck R, Zhang YE. 2003. Smad-dependent and Smad-independent pathways in TGF-beta family signalling. Nature 425:577–584. 10.1038/nature02006 [DOI] [PubMed] [Google Scholar]
- 12.Heldin CH, Miyazono K, ten Dijke P. 1997. TGF-beta signalling from cell membrane to nucleus through SMAD proteins. Nature 390:465–471. 10.1038/37284 [DOI] [PubMed] [Google Scholar]
- 13.Massague J, Seoane J, Wotton D. 2005. Smad transcription factors. Genes Dev. 19:2783–2810. 10.1101/gad.1350705 [DOI] [PubMed] [Google Scholar]
- 14.Suenaga M, Kurosawa N, Asano H, Kanamori Y, Umemoto T, Yoshida H, Murakami M, Kawachi H, Matsui T, Funaba M. 2013. Bmp4 expressed in preadipocytes is required for the onset of adipocyte differentiation. Cytokine 64:138–145. 10.1016/j.cyto.2013.07.011 [DOI] [PubMed] [Google Scholar]
- 15.Suenaga M, Matsui T, Funaba M. 2010. BMP inhibition with dorsomorphin limits adipogenic potential of preadipocytes. J. Vet. Med. Sci. 72:373–377. 10.1292/jvms.09-0442 [DOI] [PubMed] [Google Scholar]
- 16.Guo X, Liao K. 2000. Analysis of gene expression profile during 3T3-L1 preadipocyte differentiation. Gene 251:45–53. 10.1016/S0378-1119(00)00192-X [DOI] [PubMed] [Google Scholar]
- 17.Soukas A, Socci ND, Saatkamp BD, Novelli S, Friedman JM. 2001. Distinct transcriptional profiles of adipogenesis in vivo and in vitro. J. Biol. Chem. 276:34167–34174. 10.1074/jbc.M104421200 [DOI] [PubMed] [Google Scholar]
- 18.Burton GR, Guan Y, Nagarajan R, McGehee RE. 2002. Microarray analysis of gene expression during early adipocyte differentiation. Gene 293:21–31. 10.1016/S0378-1119(02)00726-6 [DOI] [PubMed] [Google Scholar]
- 19.Jessen BA, Stevens GJ. 2002. Expression profiling during adipocyte differentiation of 3T3-L1 fibroblasts. Gene 299:95–100. 10.1016/S0378-1119(02)01017-X [DOI] [PubMed] [Google Scholar]
- 20.Burton GR, Nagarajan R, Peterson CA, McGehee RE., Jr 2004. Microarray analysis of differentiation-specific gene expression during 3T3-L1 adipogenesis. Gene 329:167–185. 10.1016/j.gene.2003.12.012 [DOI] [PubMed] [Google Scholar]
- 21.Shewan AM, van Dam EM, Martin S, Luen TB, Hong W, Bryant NJ, James DE. 2003. GLUT4 recycles via a trans-Golgi network (TGN) subdomain enriched in syntaxins 6 and 16 but not TGN38: involvement of an acidic targeting motif. Mol. Biol. Cell 14:973–986. 10.1091/mbc.E02-06-0315 [DOI] [PMC free article] [PubMed] [Google Scholar]
- 22.Yasunaga M, Masui E, Oji A, Soma A, Osaki M, Nakanishi T, Sato K. 2013. Identification of the control region of pancreatic expression of Bmp4 in vitro and in vivo. PLoS One 8:e61821. 10.1371/journal.pone.0061821 [DOI] [PMC free article] [PubMed] [Google Scholar]
- 23.Morita S, Kojima T, Kitamura T. 2000. Plat-E: an efficient and stable system for transient packaging of retroviruses. Gene Ther. 7:1063–1066. 10.1038/sj.gt.3301206 [DOI] [PubMed] [Google Scholar]
- 24.Tan SX, Ng Y, Meoli CC, Kumar A, Khoo PS, Fazakerley DJ, Junutula JR, Vali S, James DE, Stockli J. 2012. Amplification and demultiplexing in insulin-regulated Akt protein kinase pathway in adipocytes. J. Biol. Chem. 287:6128–6138. 10.1074/jbc.M111.318238 [DOI] [PMC free article] [PubMed] [Google Scholar]
- 25.Livak KJ, Schmittgen TD. 2001. Analysis of relative gene expression data using real-time quantitative PCR and the 2(-Delta Delta C(T)) method. Methods 25:402–408. 10.1006/meth.2001.1262 [DOI] [PubMed] [Google Scholar]
- 26.Carvalho BS, Irizarry RA. 2010. A framework for oligonucleotide microarray preprocessing. Bioinformatics 26:2363–2367. 10.1093/bioinformatics/btq431 [DOI] [PMC free article] [PubMed] [Google Scholar]
- 27.Irizarry RA, Hobbs B, Collin F, Beazer-Barclay YD, Antonellis KJ, Scherf U, Speed TP. 2003. Exploration, normalization, and summaries of high density oligonucleotide array probe level data. Biostatistics 4:249–264. 10.1093/biostatistics/4.2.249 [DOI] [PubMed] [Google Scholar]
- 28.Smyth GK. 2004. Linear models and empirical Bayes methods for assessing differential expression in microarray experiments. Stat. Appl. Genet. Mol. Biol. 3:Article3. 10.1292/jvms.09-0442 [DOI] [PubMed] [Google Scholar]
- 29.Asyali MH, Alci M. 2005. Reliability analysis of microarray data using fuzzy c-means and normal mixture modeling based classification methods. Bioinformatics 21:644–649. 10.1093/bioinformatics/bti036 [DOI] [PubMed] [Google Scholar]
- 30.Tai YC, Speed TP. 2006. A multivariate empirical Bayes statistic for replicated microarray time course data. Ann. Stat. 34:2387–2412. 10.1214/009053606000000759 [DOI] [Google Scholar]
- 31.Li H, Heilbronn LK, Hu D, Poynten AM, Blackburn MA, Shirkhedkar DP, Kaplan WH, Kriketos AD, Ye J, Chisholm DJ. 2008. Islet-1: a potentially important role for an islet cell gene in visceral fat. Obesity (Silver Spring) 16:356–362. 10.1038/oby.2007.76 [DOI] [PubMed] [Google Scholar]
- 32.Tang QQ, Otto TC, Lane MD. 2003. CCAAT/enhancer-binding protein beta is required for mitotic clonal expansion during adipogenesis. Proc. Natl. Acad. Sci. U. S. A. 100:850–855. 10.1073/pnas.0337434100 [DOI] [PMC free article] [PubMed] [Google Scholar]
- 33.Tanko LB, Bagger YZ, Alexandersen P, Larsen PJ, Christiansen C. 2003. Peripheral adiposity exhibits an independent dominant antiatherogenic effect in elderly women. Circulation 107:1626–1631. 10.1161/01.CIR.0000057974.74060.68 [DOI] [PubMed] [Google Scholar]
- 34.Hino J, Miyazawa T, Miyazato M, Kangawa K. 2012. Bone morphogenetic protein-3b (BMP-3b) is expressed in adipocytes and inhibits adipogenesis as a unique complex. Int. J. Obes. (Lond.) 36:725–734. 10.1038/ijo.2011.124 [DOI] [PMC free article] [PubMed] [Google Scholar]
- 35.Piccolo S, Sasai Y, Lu B, De Robertis EM. 1996. Dorsoventral patterning in Xenopus: inhibition of ventral signals by direct binding of chordin to BMP-4. Cell 86:589–598. 10.1016/S0092-8674(00)80132-4 [DOI] [PMC free article] [PubMed] [Google Scholar]
- 36.Hammarstedt A, Hedjazifar S, Jenndahl L, Gogg S, Grunberg J, Gustafson B, Klimcakova E, Stich V, Langin D, Laakso M, Smith U. 2013. WISP2 regulates preadipocyte commitment and PPARgamma activation by BMP4. Proc. Natl. Acad. Sci. U. S. A. 110:2563–2568. 10.1073/pnas.1211255110 [DOI] [PMC free article] [PubMed] [Google Scholar]
- 37.Gupta RK, Arany Z, Seale P, Mepani RJ, Ye L, Conroe HM, Roby YA, Kulaga H, Reed RR, Spiegelman BM. 2010. Transcriptional control of preadipocyte determination by Zfp423. Nature 464:619–623. 10.1038/nature08816 [DOI] [PMC free article] [PubMed] [Google Scholar]
- 38.Kim JB, Wright HM, Wright M, Spiegelman BM. 1998. ADD1/SREBP1 activates PPARgamma through the production of endogenous ligand. Proc. Natl. Acad. Sci. U. S. A. 95:4333–4337. 10.1073/pnas.95.8.4333 [DOI] [PMC free article] [PubMed] [Google Scholar]
- 39.Farmer SR. 2005. Regulation of PPARgamma activity during adipogenesis. Int. J. Obes. (Lond.) 29(Suppl 1):S13–S16. 10.1038/sj.ijo.0802907 [DOI] [PubMed] [Google Scholar]
- 40.Farmer SR. 2006. Transcriptional control of adipocyte formation. Cell Metab. 4:263–273. 10.1016/j.cmet.2006.07.001 [DOI] [PMC free article] [PubMed] [Google Scholar]
- 41.Tzameli I, Fang H, Ollero M, Shi H, Hamm JK, Kievit P, Hollenberg AN, Flier JS. 2004. Regulated production of a peroxisome proliferator-activated receptor-gamma ligand during an early phase of adipocyte differentiation in 3T3-L1 adipocytes. J. Biol. Chem. 279:36093–36102. 10.1074/jbc.M405346200 [DOI] [PubMed] [Google Scholar]
- 42.Hata K, Nishimura R, Ikeda F, Yamashita K, Matsubara T, Nokubi T, Yoneda T. 2003. Differential roles of Smad1 and p38 kinase in regulation of peroxisome proliferator-activating receptor gamma during bone morphogenetic protein 2-induced adipogenesis. Mol. Biol. Cell 14:545–555. 10.1091/mbc.E02-06-0356 [DOI] [PMC free article] [PubMed] [Google Scholar]
- 43.Tang QQ, Lane MD. 2012. Adipogenesis: from stem cell to adipocyte. Annu. Rev. Biochem. 81:715–736. 10.1146/annurev-biochem-052110-115718 [DOI] [PubMed] [Google Scholar]
- 44.Tang QQ, Otto TC, Lane MD. 2004. Commitment of C3H10T1/2 pluripotent stem cells to the adipocyte lineage. Proc. Natl. Acad. Sci. U. S. A. 101:9607–9611. 10.1073/pnas.0403100101 [DOI] [PMC free article] [PubMed] [Google Scholar]
- 45.Huang HY, Song TJ, Li X, Hu LL, He Q, Liu M, Lane MD, Tang QQ. 2009. BMP signaling pathway is required for commitment of C3H10T1/2 pluripotent stem cells to the adipocyte lineage. Proc. Natl. Acad. Sci. U. S. A. 106:12670–12675. 10.1073/pnas.0906266106 [DOI] [PMC free article] [PubMed] [Google Scholar]
- 46.Jin W, Takagi T, Kanesashi SN, Kurahashi T, Nomura T, Harada J, Ishii S. 2006. Schnurri-2 controls BMP-dependent adipogenesis via interaction with Smad proteins. Dev. Cell 10:461–471. 10.1016/j.devcel.2006.02.016 [DOI] [PubMed] [Google Scholar]
- 47.Seale P, Kajimura S, Yang W, Chin S, Rohas LM, Uldry M, Tavernier G, Langin D, Spiegelman BM. 2007. Transcriptional control of brown fat determination by PRDM16. Cell Metab. 6:38–54. 10.1016/j.cmet.2007.06.001 [DOI] [PMC free article] [PubMed] [Google Scholar]
- 48.Kajimura S, Seale P, Kubota K, Lunsford E, Frangioni JV, Gygi SP, Spiegelman BM. 2009. Initiation of myoblast to brown fat switch by a PRDM16-C/EBP-beta transcriptional complex. Nature 460:1154–1158. 10.1038/nature08262 [DOI] [PMC free article] [PubMed] [Google Scholar]
- 49.Qian SW, Tang Y, Li X, Liu Y, Zhang YY, Huang HY, Xue RD, Yu HY, Guo L, Gao HD, Liu Y, Sun X, Li YM, Jia WP, Tang QQ. 2013. BMP4-mediated brown fat-like changes in white adipose tissue alter glucose and energy homeostasis. Proc. Natl. Acad. Sci. U. S. A. 110:E798–E807. 10.1073/pnas.1215236110 [DOI] [PMC free article] [PubMed] [Google Scholar]
- 50.Bu L, Jiang X, Martin-Puig S, Caron L, Zhu S, Shao Y, Roberts DJ, Huang PL, Domian IJ, Chien KR. 2009. Human ISL1 heart progenitors generate diverse multipotent cardiovascular cell lineages. Nature 460:113–117. 10.1038/nature08191 [DOI] [PubMed] [Google Scholar]
- 51.Kritzik MR, Krahl T, Good A, Krakowski M, St-Onge L, Gruss P, Wright C, Sarvetnick N. 2000. Transcription factor expression during pancreatic islet regeneration. Mol. Cell. Endocrinol. 164:99–107. 10.1016/S0303-7207(00)00234-3 [DOI] [PubMed] [Google Scholar]
- 52.Moretti A, Caron L, Nakano A, Lam JT, Bernshausen A, Chen Y, Qyang Y, Bu L, Sasaki M, Martin-Puig S, Sun Y, Evans SM, Laugwitz KL, Chien KR. 2006. Multipotent embryonic isl1+ progenitor cells lead to cardiac, smooth muscle, and endothelial cell diversification. Cell 127:1151–1165. 10.1016/j.cell.2006.10.029 [DOI] [PubMed] [Google Scholar]
- 53.Son JW, Kim MK, Park YM, Baek KH, Yoo SJ, Song KH, Son HS, Yoon KH, Lee WC, Cha BY, Son HY, Kwon HS. 2011. Association of serum bone morphogenetic protein 4 levels with obesity and metabolic syndrome in non-diabetic individuals. Endocr. J. 58:39–46. 10.1507/endocrj.K10E-248 [DOI] [PubMed] [Google Scholar]
- 54.Adams M, Montague CT, Prins JB, Holder JC, Smith SA, Sanders L, Digby JE, Sewter CP, Lazar MA, Chatterjee VKK, O'Rahilly S. 1997. Activators of peroxisome proliferator-activated receptor gamma have depot-specific effects on human preadipocyte differentiation. J. Clin. Invest. 100:3149–3153. 10.1172/JCI119870 [DOI] [PMC free article] [PubMed] [Google Scholar]
- 55.Carey DG, Cowin GJ, Galloway GJ, Jones NP, Richards JC, Biswas N, Doddrell DM. 2002. Effect of rosiglitazone on insulin sensitivity and body composition in type 2 diabetic patients [corrected]. Obes. Res. 10:1008–1015. 10.1038/oby.2002.137 [DOI] [PubMed] [Google Scholar]
- 56.Miyazaki Y, Mahankali A, Matsuda M, Mahankali S, Hardies J, Cusi K, Mandarino LJ, DeFronzo RA. 2002. Effect of pioglitazone on abdominal fat distribution and insulin sensitivity in type 2 diabetic patients. J. Clin. Endocrinol. Metab. 87:2784–2791. 10.1210/jcem.87.6.8567 [DOI] [PubMed] [Google Scholar]
- 57.Carey DG, Jenkins AB, Campbell LV, Freund J, Chisholm DJ. 1996. Abdominal fat and insulin resistance in normal and overweight women: direct measurements reveal a strong relationship in subjects at both low and high risk of NIDDM. Diabetes 45:633–638. 10.2337/diab.45.5.633 [DOI] [PubMed] [Google Scholar]
- 58.Hocking S, Samocha-Bonet D, Milner KL, Greenfield JR, Chisholm DJ. 2013. Adiposity and insulin resistance in humans: the role of the different tissue and cellular lipid depots. Endocr. Rev. 34:463–500. 10.1210/er.2012-1041 [DOI] [PubMed] [Google Scholar]
Associated Data
This section collects any data citations, data availability statements, or supplementary materials included in this article.