

Abstract
Breast cancers are stratified into distinct subtypes, which influence therapeutic responsiveness and patient outcome. Patients with luminal breast cancers are often associated with a better prognosis relative to that with other subtypes. However, subsets of patients with luminal disease remain at increased risk of cancer-related death. A critical process that increases the malignant potential of breast cancers is the epithelial-to-mesenchymal transition (EMT). The p66ShcA adaptor protein stimulates the formation of reactive oxygen species in response to stress stimuli. In this paper, we report a novel role for p66ShcA in inducing an EMT in HER2+ luminal breast cancers. p66ShcA increases the migratory properties of breast cancer cells and enhances signaling downstream of the Met receptor tyrosine kinase in these tumors. Moreover, Met activation is required for a p66ShcA-induced EMT in luminal breast cancer cells. Finally, elevated p66ShcA levels are associated with the acquisition of an EMT in primary breast cancers spanning all molecular subtypes, including luminal tumors. This is of high clinical relevance, as the luminal and HER2 subtypes together comprise 80% of all newly diagnosed breast cancers. This study identifies p66ShcA as one of the first prognostic biomarkers for the identification of more aggressive tumors with mesenchymal properties, regardless of molecular subtype.
INTRODUCTION
Breast cancer is classified into distinct molecular subtypes, which include basal and claudin-low (both typically ER− PR− HER2−), luminal A/B (ER+), and HER2+ cancers (1, 2). Luminal A tumors are generally associated with a more favorable outcome, while luminal B, HER2+, basal, and claudin-low tumors predict a worse prognosis. Breast cancers are often classified based on expression of markers that define distinct cell types within a mammary duct. Luminal epithelial cells express cytokeratin 8/18 (CK8/18), along with adherens (E-cadherin) and tight junctional (ZO-1 and claudin) proteins. Myoepithelial cells, which are cytokeratin 14 and smooth muscle actin (SMA) positive, provide structural support to the luminal epithelial layer. Luminal and HER2+ breast cancers retain CK8/18 and E-cadherin expression (3), while basal breast cancers often coexpress CK14 and SMA (4).
Molecular profiling studies have shown that triple-negative breast cancers stratify into basal and claudin-low subtypes. This is also reflected in cultivated breast cancer cell lines, which cluster into basal A (basal) and basal B (claudin-low) subgroups by gene expression profiling (5). Basal A tumors coexpress luminal (CK8/18) and myoepithelial (CK14 and SMA) markers. Basal B tumors, also referred to as claudin low, uniformly lack luminal epithelial markers but express mesenchymal markers that are indicative of an epithelial-to-mesenchymal transition (EMT) (6, 7). During an EMT, epithelial cells acquire mesenchymal properties, including loss of cell polarity and cell-cell contacts, which augment their migratory properties (8). The EMT process is governed by a network of transcription factors, including Snail1/2, Zeb1/2, and Twist1/2, which coordinately repress E-cadherin and increase the expression of mesenchymal markers to impart a more spindle-like and migratory phenotype. Elevated levels of these transcription factors are associated with increased recurrence and poor disease-free and overall survival in breast cancer patients (8).
Claudin-low tumors, representing 5 to 8% of all breast cancers, have undergone a full EMT (6, 7). However, several studies have unequivocally demonstrated that some breast cancers express EMT-like genes (vimentin, N-cadherin, Snai1/2, Zeb1/2, and Twist1/2 genes) irrespective of E-cadherin levels (9–11). This suggests that many breast cancers can acquire mesenchymal characteristics without the obligate loss of epithelial features. This partial trans-differentiation of breast tumors within other molecular subtypes increases their plasticity by promoting many prometastatic properties that are associated with an EMT (8).
The ShcA gene encodes three proteins that are produced through differential promoter usage (p66) or alternate translation initiation (p46 and p52) (12, 13). While the p46/52ShcA isoforms are ubiquitously expressed, p66ShcA levels are highly variable in cancer cells (14). The p46/52ShcA isoforms transduce mitogenic signals by recruiting Grb2/SOS and Grb2/Gab complexes to activate the extracellular signal-regulated kinase (ERK) and AKT pathways, respectively (15, 16). Paradoxically, while p66ShcA is tyrosine phosphorylated and binds Grb2, it neither has transforming properties nor activates ERK (12). p66ShcA contains a unique N-terminal domain, including a serine residue (S36) that is phosphorylated in response to stress stimuli (17, 18). Binding of Pin1 to pSer36 of p66ShcA induces its translocation into the inner mitochondrial matrix (19, 20), where p66ShcA promotes the formation of reactive oxygen species (ROS) (21).
While it is well established that the p46/52ShcA isoforms are critical for breast cancer progression (22–25), the biological significance of p66ShcA during this process is poorly understood. We provide the first experimental evidence that p66ShcA is a major driver of breast cancer plasticity, both in vitro and in vivo, by inducing an epithelial-to-mesenchymal transition.
MATERIALS AND METHODS
Cell lines.
MDA-MB-231 and BT474 cells were obtained from the ATCC. MDA-MB-231 cells were cultured in 10% fetal bovine serum (FBS)–Dulbecco modified Eagle medium (DMEM), while BT474 cells were cultured in 10% FBS–RPMI medium. The NIC tumor cell line was established from a mouse mammary tumor virus (MMTV)/Neu-internal ribosome entry site (IRES)-Cre (NIC) transgenic mouse mammary tumor (25) and maintained in 5% FBS–DMEM supplemented with mammary epithelial growth supplement (Invitrogen). NIC cells were cultured in 10% FBS–DMEM for 3 to 4 days prior to experimental analysis. A C-terminal, FLAG-tagged mouse p66ShcA cDNA was subcloned into the XhoI/EcoRI sites of pMSCV-puro (Clontech) or the NotI/EcoRI sites of pQXCIB-blast (Addgene) and used for the generation of stable cell lines. MDA-MB-231 and NIC cells were transfected with the pMSCV-puro vector and maintained in 2 μg/ml of puromycin, while the BT474 cells were transfected with the pQXCIB/p66ShcA vector and maintained in 10 μg/ml of blasticidin. Parental BT474 cells were employed as the negative control. For the small interfering RNA (siRNA) studies, cells were transfected with a pool of three DICER substrate duplex siRNAs targeting mouse Met or with a universal scrambled control (Origene) as described previously (22). Cells were also cultured in the presence of 1 μM crizotinib (LC Laboratories) or an equivalent volume of dimethyl sulfoxide (DMSO) for 4 days prior to cell lysis. The medium was replenished and fresh inhibitor was added on the second day.
For the in vivo studies, tumor cells (1 × 10⁶) were injected into the fourth mammary gland of 6- to 8-week-old female SCID-beige mice (Taconic). Following the first palpation, tumor volumes were measured on a biweekly basis, as described previously (25). Animal studies were approved by the Animal Resources Centre at McGill University and complied with guidelines set by the Canadian Council of Animal Care.
Immunoblotting, ELISA, and qRT-PCR.
For the immunoprecipitation experiments, 200-μg quantities of cytoplasmic extracts were immunoprecipitated with FLAG-specific antibodies (Sigma). Immunoblots were performed as described previously (25) using the antibodies listed in Table S1 in the supplemental material. Hepatocyte growth factor (HGF) enzyme-linked immunosorbent assay (ELISA) (R&D) was performed on 50 μg of whole-cell lysate. For the reverse transcription-quantitative PCR (RT-qPCR) studies, total RNA was isolated using RNeasy midi-kits (Qiagen) and cDNA was generated using Superscript II reverse transcriptase (Invitrogen). Quantitative PCR was performed using the QuantiTect SYBR green RT-PCR kit (Qiagen) with primers listed in Table S2 in the supplemental material. CSF1, CCL2, CCL5, MMP9, and tumor necrosis factor alpha (TNF-α) mRNA levels were measured using TaqMan probes (Invitrogen). Semiquantitative analysis of immunoblots was conducted using ImageJ software.
Immunohistochemistry.
Immunohistochemical and immunohistofluorescent staining of paraffin- and OCT-embedded sections was performed as described previously (25). The antibodies are listed in Table S1 in the supplemental material. Quantification of stained sections was performed using Aperio Imagescope software. For the immunohistofluorescent images, the percent green and percent red pixels were quantified using ImageJ software. For ex vivo dihydroethidium (DHE) staining, OCT-embedded sections were incubated with 2 μM DHE (Invitrogen) and quantified by ImageJ software.
Boyden chamber assays and scratch assays.
Boyden chamber assays were performed as described previously (26) using the following numbers of cells: NIC cells, 200,000; BT474 cells, 125,000; and MDA-MB-231 cells, 100,000. For the scratch assays, cells were allowed to reach a monolayer prior to initiation of the experiment. Wound closure was monitored for specific time periods, and images were captured using a bright-field microscope.
Bioinformatics.
Samples from the McGill Genome Quebec data set (n = 84) with matching RT-qPCR-derived p66ShcA expression values were used. Samples were hybridized on GeneChip Human Gene 1.0 ST arrays (Affymetrix) and normalized in R using the bioconductor RMA (27) and hugene10stv1cdf annotation packages. All patients were assigned a genomic subtype based on genes in the PAM50 centroids (28). We also employed publicly available level 1 Illumina HiSeq RNA sequencing data from breast invasive carcinoma (TCGA) (29). Relative p66ShcA levels were measured based on the read depth in the p66ShcA specific region (chr1, 154942676 to 154943043). Rsamtools was used to index downloaded bam files, extract reads, and calculate read depth coverage (http://bioconductor.org/packages/release/bioc/html/Rsamtools.html). Tumors were annotated by their PAM50 subtype. Expression of EMT genes was investigated in level 3 TCGA microarray data where matching transcriptome sequencing (RNA-seq) data were available (n = 660).
Statistical analysis.
All statistical analysis was performed using a two-tailed Student t test with the exception the data shown in Fig. 7F and G, which were evaluated using single-factor analysis of variance (ANOVA), and Fig. 8A and G, which were determined using Fisher's exact probability test (2 × 2 contingency).
FIG 7.

p66ShcA levels stratify primary breast tumors with an EMT phenotype irrespective of molecular subtype. (A) Region within the CH2 domain used to interrogate p66ShcA expression levels. (B) Relative p66ShcA mRNA levels were determined from 84 primary breast cancers by RT-qPCR (Genome Quebec). We also screened p66ShcA mRNA levels in 660 primary breast cancers by RNA-seq (TCGA). Tumors were stratified based on relative p66ShcA expression levels (low, bottom 50%; high, top 50%). (C and D) Stratification of breast tumors with the Genome Quebec (C) and TCGA (D) data sets based on increasing p66ShcA expression levels. A similar analysis was performed across all subtypes within the Genome Quebec and TCGA data sets. (E) Stratification of breast tumors within the TCGA data set based on increasing ShcA levels using a probe that spans all three isoforms. A heat map depicting the relative expression levels of luminal (green) and mesenchymal (red) genes is shown. (F) Relative E-cadherin (CDH1) and vimentin (VIM) expression levels in breast cancer patients from the TCGA data set (n = 660). For each patient, fold change gene expression values were calculated by first normalizing expression levels within a tumor to the average expression value across all tumors (n = 660). Normalized expression values were then log2 transformed, and tumors were segregated into quartiles based on relative p66ShcA levels over the entire cohort. (G) Relative SNAI1, SNAI2, TWIST1, TWIST2, ZEB1, and ZEB2 gene expression levels in breast tumors from the TCGA data set as outlined in panel F.
FIG 8.

p66ShcA is enriched in the claudin-low subtype of basal breast cancer. (A) The percentage of p66ShcA-low and p66ShcA-high tumors within each molecular subtype is shown for the Genome Quebec and TCGA data sets. (B to E) Stratification of luminal A (B), luminal B (C), HER2 (D), and basal (E) tumors within the TCGA data set based on increasing p66ShcA levels. Heat maps depicting the relative expression levels of luminal (green) and mesenchymal (red) genes are shown. (F) Tumors were ordered by increasing p66ShcA levels, and expression levels of genes within a claudin-low signature were determined (Genome Quebec). (G) For the TCGA data set, the relative percentage of p66ShcA-low and p66ShcA-high tumors that are defined as claudin low by gene expression profiling is shown. For the TCGA data set in panel A, the P values for the association between high p66ShcA levels (top 50%) between breast cancer subtypes was determined using Fisher's exact probability test and are as follows: luminal A versus luminal B, P = 0.0002; luminal A versus HER2, P = 0.00019; luminal A versus basal, P = 7.3 × 10⁻⁸; luminal B versus HER2, P = 0.64; luminal B versus basal, P = 0.07; and HER2 versus basal, P = 0.27. *, P = 0.004 (p66ShcALow versus p66ShcAHigh within the basal subtype).
RESULTS
p66ShcA is enriched in claudin-low breast cancer cell lines.
We sought to interrogate how p66ShcA expression is regulated in human breast cancer cell lines that resemble the luminal or basal subtypes (5). While p46/52ShcA is ubiquitously expressed, p66ShcA is absent or weakly expressed in all luminal breast cancer cell lines examined (Fig. 1A). Indeed, p66ShcA is also weakly expressed in normal mouse mammary gland tissue (Fig. 1B). In contrast, p66ShcA expression is aberrantly elevated in many human basal breast cancer cell lines and is particularly enriched within the claudin-low subtype (basal A, 2/5; basal B, 4/5) (Fig. 1A). We also examined the relationship between p66ShcA levels and expression of the ErbB2, epidermal growth factor receptor (EGFR), and MET receptor tyrosine kinases in this panel of human breast cancer cell lines. We show that p66ShcA tends to be enriched in MET-positive cell lines and is excluded from ErbB2-expressing cell lines, with a few exceptions for each receptor tyrosine kinase. In contrast, we did not observe any association between p66ShcA and EGFR levels in any of the breast cancer cell lines that we studied (Fig. 1A). We extended our observations and show that p66ShcA mRNA levels are also exceedingly low in luminal cell lines and highly enriched in p66ShcA-positive basal breast cancer cell lines (Fig. 1C). Using a publicly available data set (5), we show that p66ShcA protein levels are elevated in a larger panel of basal breast cancer cell lines in which the highest p66ShcA levels are observed in the claudin-low subgroup (Fig. 1D).
FIG 1.

p66ShcA is enriched in basal breast cancer cell lines. (A) Immunoblot analysis of whole-cell lysates using ShcA-, MET-, EGFR-, ErbB2-, and tubulin-specific antibodies. Cells are classified as luminal or basal (A or B) as described previously (5). Note that the same lysates from the luminal cell lines were loaded in the immunoblots comparing expression to basal A versus basal B tumors. (B) Immunoblot analysis of whole-cell lysates generated from mammary glands of three FVB female mice using ShcA- and tubulin-specific antibodies. (C) Quantification of p66ShcA mRNA levels in the indicated cell lines by RT-qPCR analysis. The data are normalized to GAPDH levels and are representative of results from three replicates. (D) Semiquantitative assessment of p66ShcA protein levels in breast cancer cells lines comprising the luminal and basal A and B subtypes. The data were obtained from densitometric analysis of published immunoblots (5) and are represented as the mean p66/p46 and p66/52 ratios in luminal (n = 19), basal A (n = 6), and basal B (n = 7) cell lines ± SEM (*, P = 0.036; **, P = 0.034; ***, P = 0.002). (E) Semiquantitative assessment of the mean p66/ErbB2 ratio ± SEM (*, P = 0.001; **, P < 0.001).
p66ShcA inhibits the growth of ErbB2+ luminal breast cancers in vivo.
In general, p66ShcA is restricted from luminal breast cancer cell lines and enriched in those resembling the claudin-low subtype. Moreover, p66ShcA and ErbB2 levels are inversely correlated in several, but not all, of the luminal breast cancer cell lines examined (Fig. 1A and E). Therefore, we sought to define whether p66ShcA functionally alters ErbB2-driven mammary tumorigenesis. We ectopically expressed p66ShcA in a cell line derived from ErbB2-driven mammary tumors (NIC) (25), which retains a luminal phenotype (Fig. 2A) and expresses low endogenous p66ShcA levels (Fig. 2B). Unsupervised hierarchical clustering analysis previously revealed that MMTV/ErbB2 mouse mammary tumors most closely resemble human luminal breast cancer (30). We also overexpressed p66ShcA in MDA-MB-231 breast cancer cells, which are claudin low and express moderate p66ShcA levels (Fig. 1A; see also Fig. S1A in the supplemental material). We confirmed that p66ShcA is overexpressed in NIC and MDA-MB-231 cells (Fig. 2B; see also Fig. S1B in the supplemental material) to levels that correspond to those observed in many basal breast cancer cell lines (Fig. 1A and D).
FIG 2.

p66ShcA reduces the growth of ErbB2-positive luminal mammary tumors. (A) Immunohistofluorescent staining of ErbB2-driven (NIC) tumors using cytokeratin 8/18 (CK8)- and vimentin-specific antibodies. Scale bar = 30 μm. (B) Immunoblot of vector control (VC) and p66ShcA-overexpressing NIC cell lysates using ShcA- and tubulin-specific antibodies. (C) Mammary fat pad injection of NIC/VC and NIC/p66ShcA cells (1 × 10⁶). The data are recorded as mean tumor volume (mm3) ± SEM and are representative of results for 7 mice each. (D) Percentage of dihydroethidium (DHE)-positive cells present in cryosections from NIC/VC and NIC/p66ShcA mammary tumors. The data are representative of results for 40 to 46 fields (20×) and 6 tumors per cell line and are shown as mean percent DHE-positive cells/field of view (FOV) ± SEM. (E) Mammary tumors were probed with phospho-p38 MAPK-, p38 MAPK-, and tubulin-specific antibodies. The right side shows phospho-p38/p38 ratios quantified by ImageJ software. The data represent the averages from seven independent tumors per cell line ± SEM. (F) Ki67 immunohistochemical staining of paraffin-embedded sections from NIC/VC and NIC/p66ShcA mammary tumors. The data are representative of results for 7 tumors each and are depicted as percent Ki67-positive cells ± SEM. Scale bars = 40 μm. (G) Terminal deoxynucleotidyltransferase-mediated dUTP-biotin nick end labeling (TUNEL) staining of paraffin-embedded sections from vector control and p66ShcA-expressing tumors. For each section, a minimum of 20,000 nuclei were counted using Image Scope software. The data are presented as the percent TUNEL-positive cells ± SEM (n = 7 tumors each). Scale bars = 40 μm.
Overexpression of p66ShcA moderately decreased the growth of NIC luminal tumors (Fig. 2C) but did not affect the growth of MDA-MB-231 claudin-low tumors in vivo (see Fig. S1C in the supplemental material). Despite this fact, both NIC/p66ShcA and MDA-MB-231/p66ShcA tumors displayed elevated ROS production relative to that of vector controls (VCs). These results suggest that claudin-low tumors, but not luminal tumors, can adapt to elevated ROS levels induced by p66ShcA (Fig. 2D; see also Fig. S1D). Consistently, NIC/p66ShcA tumors, but not MDA-MB-231/p66ShcA tumors, display increased p38 mitogen-activated protein kinase (MAPK) activation (Fig. 2E; see also Fig. S1E). Moreover, the reduced growth potential of NIC/p66ShcA tumors is associated with impaired cell proliferation (Fig. 2F), while the proliferative indices of control and p66ShcA-overexpressing MDA-MB-231 tumors were comparable (see Fig. S1F). Interestingly, however, we also observe increased microvessel density in NIC/p66ShcA tumors but not in MDA-MB-231 tumors relative to that in vector controls (see Fig. S2). Finally, p66ShcA overexpression does not significantly alter the apoptotic potential of NIC or MDA-MB-231 tumors relative to that of their vector controls (Fig. 2G; see also Fig. S1G). These observations suggest that p66ShcA impairs the in vivo growth potential of ErbB2-driven luminal breast cancers but does not appreciably alter the growth of claudin-low tumors.
p66ShcA induces an EMT in ErbB2+ luminal breast cancers.
Given that claudin-low tumors already possess mesenchymal features and endogenously express p66ShcA, we examined whether p66ShcA overexpression increases the mesenchymal properties of luminal breast tumors. Indeed, NIC/p66ShcA mammary tumors acquired a spindle-like morphology (Fig. 3A) coincident with exceedingly low E-cadherin and high vimentin levels relative to those in vector controls (Fig. 3B). Moreover, NIC/p66ShcA tumors significantly upregulate EMT-promoting transcription factors (Slug, Twist1/2, and Zeb1/2) and display reduced expression of genes encoding adherens and tight junction proteins (E-cadherin and claudin-3 [Cldn3], Cldn4, and Cldn7) (Fig. 3C). These data were confirmed by immunofluorescent staining, which revealed NIC/VC tumors uniformly retain expression of luminal epithelial markers (CK8/18) and display residual SMA and vimentin staining that is reflective of fibroblast/myofibroblast infiltration. While small subsets of NIC/p66ShcA tumor cells retain CK8/18 positivity, a majority of them have lost their luminal characteristics and acquire expression of basal/mesenchymal markers (SMA, vimentin, and CK14) (Fig. 3D). These data suggest that p66ShcA induces an EMT in ErbB2-driven luminal breast cancers.
FIG 3.

p66ShcA induces an EMT in luminal mammary tumors. (A) Hematoxylin and eosin (H&E)-stained sections from NIC/VC and NIC/p66ShcA mammary tumors. Scale bars = 40 μm. (B) Immunoblot analysis of NIC/VC and NIC/p66ShcA tumor lysates using E-cadherin-, vimentin-, and tubulin-specific antibodies. Lower-molecular-weight species in the vimentin blot represent proteolytic fragments. (C) RT-qPCR analysis of RNA isolated from NIC/VC or NIC/p66ShcA mammary tumors using primers specific for mesenchymal (Snail1/2, Twist1/2, and Zeb1/2) and epithelial (E-cadherin/Cdh1 and Cldn3/Cldn4/Cldn7) markers. The data are normalized to glyceraldehyde-3-phosphate dehydrogenase (GAPDH) levels ± SEM (n = 7 tumors each). (D) Paraffin-embedded sections from NIC/VC and NIC/p66ShcA mammary tumors were subjected to immunohistofluorescent staining with CK8/18-specific antibodies (green) and costained with vimentin-, CK14-, or SMA-specific antibodies (red). The data are representative of results for seven tumors each. The following numbers of 20× fields were quantified: for VC, 141 (CK8/vimentin), 140 (CK8/SMA), and 116 (CK8/CK14), and for p66ShcA, 151 (CK8/vimentin) and 141 (CK8/SMA and CK8/CK14). The data are shown as mean percent positive staining per field ± SEM. Scale bars = 40 μm.
We next examined whether p66ShcA functions in a cell-autonomous fashion to promote an EMT using two ErbB2-positive luminal breast cancer cell lines (NIC and BT474). BT474 cells express low levels of endogenous p66ShcA (Fig. 1A). Both NIC and BT474 cells are E-cadherin positive, with little vimentin expression in vitro (Fig. 4A). However, p66ShcA overexpression is sufficient to substantially increase vimentin levels in both NIC and BT474 cells (Fig. 4A), which is associated with elevated p38 MAPK activation (Fig. 4B), similar to what we observed in ErbB2-positive mammary tumors (Fig. 2E). We next assessed the phosphorylation status of p66ShcA in NIC and BT474 overexpressers to evaluate whether serine or tyrosine phosphorylation of this adaptor protein is associated with its ability to endow breast tumor cells with mesenchymal features. We demonstrate a significant, albeit variable, increase in p66ShcA Ser36 phosphorylation in NIC and BT474 cells (Fig. 4C). In contrast, p66ShcA is only weakly phosphorylated on key tyrosine residues within the CH1 domain in NIC and BT474 cells relative to levels that are achieved with the p46/52ShcA isoforms (Fig. 4D). These data suggest that the S36 phosphorylation site may contribute to a p66ShcA-induced EMT.
FIG 4.

p66ShcA is S36 phosphorylated and increases vimentin expression in ErbB2-driven luminal breast cancer cell lines. (A) Total cell lysates were generated from control and p66ShcA-expressing NIC and BT474 cells and subsequently probed with FLAG-, E-cadherin-, vimentin-, and tubulin-specific antibodies. (B) Total cell lysates were generated from control and p66ShcA-expressing NIC and BT474 cells and subsequently probed pp38 MAPK-, p38 MAPK-, pMET-, and MET-specific antibodies. (C) FLAG immunoprecipitates from control and p66ShcA overexpressing NIC and BT474 cells probed with pS36-p66ShcA- and ShcA-specific antibodies. The positive control represents the NIC/FLAG-p66ShcA overexpressing cell line stimulated with 1 mM H2O2 for 1 h prior to cell lysis. (D) FLAG immunoprecipitates from control and p66ShcA-overexpressing NIC and BT474 cells probed with pY239/240-ShcA- and ShcA-specific antibodies. The positive control represents a breast cancer cell line stably overexpressing a FLAG-tagged p46/42ShcA construct.
To extend these observations, we evaluated E-cadherin levels in control and p66ShcA expression luminal breast cancer cell lines in vitro. Interestingly, E-cadherin levels do not vary appreciably between control and p66ShcA-expressing cells (Fig. 4A), and the majority of NIC/p66ShcA and BT474/p66ShcA cells retain both E-cadherin and vimentin expression in the same cell (see Fig. S3 in the supplemental material). This contrasts with results of our in vivo studies, which demonstrate that CK8/18 and vimentin are reciprocally regulated in NIC/p66ShcA luminal breast tumors (Fig. 3). To interrogate the reproducibility of these findings in an independent model of ErbB2-driven breast cancer, we injected parental and p66ShcA-overexpressing BT474 cells into the mammary fat pads of immunodeficient mice. We also observed a significant growth inhibition in BT474/p66ShcA tumors (see Fig. S4A), similar to what we observed with NIC cells (Fig. 2C). However, p66ShcA significantly increased vimentin expression in BT474 tumors in vivo without a corresponding reduction in E-cadherin levels (see Fig. S4B and C). Taken together, these data suggest that p66ShcA primarily functions to increase breast cancer plasticity by stimulating the expression of mesenchymal genes in luminal breast cancer cells. However, p66ShcA expression is not necessarily sufficient to correspondingly inhibit the expression of luminal markers, such as E-cadherin. Thus, we conclude that p66ShcA primarily induces a partial EMT in luminal breast cancers and that its ability to induce a full EMT in vivo requires integration of additional signaling pathways derived from the mammary tumor itself or from cells within the stromal microenvironment.
It is well established that an EMT increases the migratory properties of cancer cells. We next employed both Boyden chamber and scratch assays to examine whether a p66ShcA-induced EMT in ErbB2+ luminal breast cancers renders them more motile in vitro (8). We show that NIC/p66ShcA and BT474/p66ShcA cells displayed a 2.5-fold increase in their migratory properties relative to those of their respective controls (Fig. 5A and B). Moreover, NIC/p66ShcA cells displayed a comparable increase in their invasive properties (Fig. 5A). The inability of p66ShcA to increase the invasive properties of BT474 cells (Fig. 5B) may reflect differences in expression of matrix-degrading proteases between NIC and BT474 cells. Despite this fact, we did observe a robust increase in p66ShcA-induced cell migration in both cell types. We further validated these observations using an in vitro scratch assay. Despite the fact that p66ShcA significantly inhibited the growth potential of NIC cells in vitro, it stimulated a 2-fold increase in cell migration in a scratch assay (see Fig. S5A to C in the supplemental material). By the same token, p66ShcA did not significantly impact the proliferative ability of BT474 cells but accelerated wound closure (>4-fold) in a scratch assay (see Fig. S5C to E). In contrast, p66ShcA overexpression had no appreciable effect on the migratory or invasive characteristics of MDA-MB-231 cells, which are claudin low (Fig. 5C). These data demonstrate that p66ShcA augments the migratory properties of luminal breast cancers but may not be required in breast cancer cells that have already undergone a stable EMT. Interestingly, these observations contrast recent studies which showed a role for p66ShcA in impairing leukocyte migration and chemotaxis by inhibiting actin polymerization and its subsequent disassembly, coincident with reduced Vav phosphorylation (31, 32). This suggests either that p66ShcA exerts differential effects on the actin cytoskeleton in epithelial cells or that the ability of p66ShcA to increase the migratory properties of breast cancer cells is secondary to its ability to induce an EMT.
FIG 5.

p66ShcA increases the migratory property of luminal breast cancer cells. (A) Control and p66ShcA-expressing NIC (A), BT474 (B), and MDA-MB-231 (C) cells were screened by Boyden chamber assays to assess cell migration and invasion. The data are representative of results for 8 inserts from two independent experiments (NIC migration, P < 0.001; NIC invasion, P = 0.004; and BT474 migration, P < 0.001). For the MDA-MB-231 cells, the data represents the averages for 6 inserts from one experiment.
p66ShcA relies on increased Met signaling to induce an EMT in ErbB2+ luminal breast cancers.
Oxidative stress induces an EMT (33), and p66ShcA stimulates ROS production in response to stress stimuli (21). Indeed, p66ShcA overexpression increases ROS production (Fig. 2D) and the acquisition of an EMT phenotype in luminal breast tumors (Fig. 3). One mechanism by which ROS stimulates an EMT is via activation of the NF-κB pathway (34). Thus, we examined whether p66ShcA overexpression was associated with elevated NF-κB signaling in luminal breast cancer cells. Under steady-state conditions, phospho-NF-κB levels are comparable in control and p66ShcA-expressing NIC and BT474 cells (see Fig. S6A) in the supplemental material. However, p66ShcA could potentiate NF-κB signaling in mammary tumors in vivo, given their exposure to a plethora of stress stimuli. Indeed, NIC/p66ShcA mammary tumors significantly and uniformly increase NF-κB signaling (see Fig. S6B), coincident with elevated expression of NF-κB target genes that confer a tumorigenic and angiogenic phenotype (see Fig. S6C). In contrast, NF-κB signaling is not appreciably altered in control and p66ShcA-expressing BT474 tumors (see Fig. S3C). These observations demonstrate that p66ShcA expression is not necessarily sufficient to increase NF-κB signaling in mammary tumors in vivo but rather may rely on collaborative stromally derived signals to activate this pathway.
The transforming growth factor β (TGF-β) pathway is another key promoter of an EMT in ErbB2-driven breast cancer cells (26, 35). However, the degree of activation of canonical TGF-β/SMAD signaling in NIC/VC mammary tumors is comparable to that in NIC/p66ShcA mammary tumors (Fig. 6A and B). Another critical inducer of an EMT is the Met receptor tyrosine kinase (36). Transgenic mouse models have demonstrated that Met overexpression in the mammary epithelium synergizes with p53 deficiency to induce the formation of mammary tumors resembling the claudin-low subtype (37). We show that p66ShcA and Met are coordinately regulated in several, but not all, human claudin-low breast cancer cell lines examined (Fig. 1A) and that both NIC/p66ShcA and BT474/p66ShcA breast cancer cells activate Met in vitro (Fig. 4B). Moreover, both NIC/p66ShcA and BT474/p66ShcA tumors with mesenchymal properties demonstrate increased Met activation (Fig. 6A and B; see also Fig. S4B in the supplemental material), which coincides with elevated HGF (the Met ligand) production from p66ShcA-overexpressing mammary tumors in vivo (Fig. 6C). Thus, p66ShcA overexpression increases Met signaling in luminal breast cancer cells, both in vitro and in vivo. Finally, we examined whether p66ShcA expression is differentially regulated in transgenic mouse models of breast cancer. These include ErbB2-driven (NIC) tumors, resembling the luminal subtype (25), and Met/p53+/+ tumors, which give rise to tumors that coexpress luminal and basal markers but do not acquire a mesenchymal phenotype (38). In contrast, Met-driven, p53-deficient tumors lose their epithelial characteristics and undergo a stable EMT (37). We demonstrate that p66ShcA is absent from NIC and Met/p53+/+ tumors but is upregulated in Met-driven models of claudin-low breast cancer (Fig. 6D). Combined, these data suggest that p66ShcA and Met are coordinately regulated in mammary tumors with mesenchymal properties. Finally, we evaluated whether reduced Met expression or signaling impacted a p66ShcA-induced EMT. Using Met-specific siRNAs, we were able to achieve a >4-fold reduction in Met levels in control and p66ShcA-expressing NIC cells. While vimentin levels were low and unaltered in NIC/VC control cells, reduced Met expression resulted in a 3-fold decrease in vimentin expression in NIC/p66ShcA cells (Fig. 6E and F). To substantiate these findings, we also employed crizotinib, a pharmacological Met inhibitor, and show a 2-fold reduction in Met phosphorylation in both control and p66ShcA-expressing NIC cells. Again, crizotinib had no effect on baseline vimentin levels in NIC cells but significantly attenuated (3.5-fold) vimentin expression in NIC/p66ShcA expressors (Fig. 6G and H). Taken together, these data suggest that p66ShcA cooperates with Met signaling to support a mesenchymal phenotype in breast cancer cells.
FIG 6.

p66ShcA activated Met signaling increases vimentin expression in luminal breast cancer cells. (A) Immunoblot analysis of NIC/VC and NIC/p66ShcA tumor lysates using pSMAD2/3-, SMAD2/3-, pMET, MET-, and tubulin-specific antibodies. (B) Quantification of the relative ratios of pSMAD2/3 to SMAD2/3 and pMET to MET in the mammary tumor lysates shown in panel A. (C) HGF ELISA of NIC/VC and NIC/p66ShcA tumor lysates (n = 7 tumors each). (D) Immunoblot analysis of tumor lysates from MMTV/NIC, MMTV/Met;Cre;p53+/+, and MMTV/Met;Cre;p53fl/+ transgenic mice using ShcA- and tubulin-specific antibodies. (E) Immunoblot analysis of whole-cell lysates from NIC/VC and NIC/p66ShcA breast cancer cells transfected with scrambled or Met-specific siRNAs using pMET-, E-cadherin-, vimentin-, and tubulin-specific antibodies. (F) Quantification of relative MET (*, P = 0.018; **, P = 0.005) and vimentin levels (normalized to tubulin levels) in NIC/VC and NIC/p66ShcA cells transfected with scrambled and Met-specific siRNAs as outlined for panel E. The data are representative of results from four independent experiments. (G) Immunoblot analysis of whole-cell lysates from NIC-p66ShcA breast cancer cells treated with 1 μM crizotinib or DMSO control over a 4-day period. (H) Quantification of the pMET/MET ratio (*, P = 0.04; **, P = 0.008) and relative vimentin levels (normalized to tubulin levels) in NIC/VC and NIC/p66ShcA cells treated with DMSO or crizotinib as outlined for panel G. The data are representative of results from four independent experiments.
Elevated p66ShcA levels are associated with an EMT phenotype in primary human breast cancers.
The relationship between p66ShcA and an EMT cannot be interrogated by microarray data given that the ShcA probes recognize all three isoforms. To circumvent this issue, we took a two-pronged approach. First, we quantified p66ShcA mRNA levels from 84 primary breast tumors (Genome Quebec) by RT-qPCR using primers specific to the CH2 domain (Fig. 7A) and generated matching gene expression profiling data for each tumor. We also determined relative p66ShcA levels in a publicly available RNA-seq data set (n = 660; TCGA) (29), including luminal A/B, HER2+, and basal breast cancers. In both data sets, tumors were rank ordered based on p66ShcA levels and stratified into two groups: p66ShcA-low (bottom 50%) and p66ShcA-high (top 50%) (Fig. 7B). We show that increasing p66ShcA levels are associated with increased Met and HGF levels, elevated expression of mesenchymal markers (vimentin, Snai1/2, Zeb1/2, and Twist1/2), and a reduction of several claudins (Cldn3, Cldn4, and Cldn7) across all breast cancer subtypes (Fig. 7C and D). Interestingly, utilization of a ShcA probe spanning all three isoforms cannot stratify breast tumors with increased mesenchymal features (Fig. 7E), suggesting that p66ShcA is uniquely associated with the acquisition of EMT characteristics. Similar to observations made in our preclinical models, we show that a corresponding increase in p66ShcA levels in primary breast tumors is significantly associated with a robust increase in vimentin expression and has no appreciable effect on E-cadherin levels (Fig. 7F). This is associated with a particularly robust increase in Snail2, Zeb1, and Zeb2 mRNA levels in p66ShcA-high mammary tumors (Fig. 7G).
We next interrogated whether p66ShcA expression is specific to particular breast cancer subtypes. Surprisingly, p66ShcA is expressed in all breast cancer subtypes, including luminal A tumors (Fig. 8A), which seemingly contradicts our observation in breast cancer cell lines (Fig. 1A). However, upon closer inspection, increased p66ShcA levels specifically within luminal A breast cancers are associated with increased Met signaling (HGF and Met) and elevated expression of mesenchymal markers (vimentin, Snai1/2, Zeb1/2, and Twist1/2) concomitant with reduced claudin levels (Cldn3, Cldn4, and Cldn7) (Fig. 8B). Indeed, high p66ShcA levels correlate with an EMT across all molecular subtypes, including luminal B, HER2, and basal breast tumors (Fig. 8C to E). Taken together, these observations suggest that p66ShcA is a universal driver of breast cancer cell plasticity by promoting the acquisition of mesenchymal features in all breast cancers, including the luminal subtypes. Given this observation, we next examined whether increasing p66ShcA levels were associated with the acquisition of a claudin-low signature, which is indicative of a full and stable EMT (6). Breast tumors expressing elevated p66ShcA levels are enriched in a subset of genes that identify the claudin-low subtype (Fig. 8F). However, p66ShcA-high luminal A/B and HER2 tumors are not defined as claudin low (Fig. 8G). In contrast, p66ShcA-high basal breast tumors are significantly enriched in the claudin-low subtype (Fig. 8G), which is consistent with our observations in basal breast cancer cell lines (Fig. 1) and in transgenic mouse models of claudin-low breast cancer (Fig. 6D). This suggests that within the basal subtype, p66ShcA overexpression may promote the development of claudin-low tumors. Combined, our data demonstrate that p66ShcA may serve as a clinical biomarker for breast cancer plasticity, through the induction of an EMT, irrespective of molecular subtype. The functional implication of p66ShcA overexpression in luminal and basal breast tumors warrants future investigation.
DISCUSSION
Breast cancers are stratified into distinct subtypes, which influences patient outcome. Despite this fact, a significant degree of heterogeneity exists within breast cancer subtypes, which impacts therapeutic responsiveness. Our data reinforce the concept of such plasticity, even within breast cancer subtypes. Indeed, we show that a significant number of primary breast tumors which acquire mesenchymal features neither display reduced E-cadherin levels nor are defined as claudin low. Several studies support the notion that breast cancers can acquire mesenchymal genes without the obligate loss of epithelial features (9–11). By combining orthotopic studies with established breast cancer cell lines and primary breast tumor material, we demonstrated a causal role for the p66ShcA adaptor in inducing such an EMT, in part through activation of the Met receptor tyrosine kinase (Fig. 9). This is clinically relevant, as tumors with luminal features comprise up to 80% of all newly diagnosed breast cancers. Indeed, p66ShcA expression is elevated in breast tumors with mesenchymal features, including the luminal A subtype, which is typically associated with a more epithelial-like state and better patient outcome. This is consistent with retrospective studies which showed that a significant number of luminal A breast cancer patients are at elevated risk of cancer-related death more than 10 years following diagnosis despite adjuvant endocrine therapy and chemotherapy (39). It is possible that a subset of tumor cells with increased plasticity confers therapeutic resistance and relapse in these patients with luminal A breast cancer. The importance of p66ShcA in promoting therapeutic resistance and/or relapse in luminal tumors requires additional experimentation.
FIG 9.
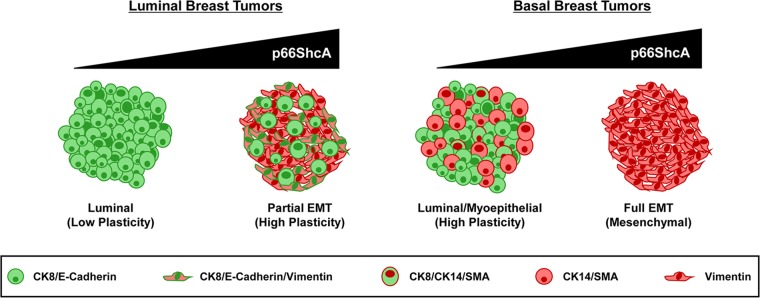
Proposed model for the role of p66ShcA in promoting plasticity among the various breast cancer subtypes. Within the luminal subtype, breast tumors uniformly express cytokeratin 8/18, along with adherens (E-cadherin) and tight junctional (ZO-1 and claudin) proteins. However, a subset of these tumors also express EMT-like genes (vimentin, N-cadherin, Snai1/2, Zeb1/2, and Twist1/2) without the obligate loss of E-cadherin expression. We propose that elevated p66ShcA expression in luminal breast cancer cells endows them with such a partial EMT phenotype to increase their plasticity, leading to enhanced cell migration and invasion. In contrast, within the basal subtype, basal-like tumors coexpress luminal (CK8/18) and myoepithelial (CK14 and SMA) markers, while claudin-low tumors uniformly lack luminal epithelial markers and stably express mesenchymal genes indicative of a complete EMT. We propose that elevated p66ShcA overexpression in the basal subtype further drives an EMT to promote the development of claudin-low breast tumors.
Paradoxically, we also demonstrate that p66ShcA is enriched in the majority of basal breast cancer cell lines, particularly within the claudin-low subtype, and is expressed at exceedingly low levels or is absent from luminal breast cancer cell lines. This seemingly contradicts our observations in primary breast tumors, which show elevated p66ShcA expression across all subtypes, including luminal breast cancers. However, our observation that p66ShcA can stratify mammary tumors with mesenchymal features, irrespective of breast cancer subtype, reconciles these observations and reinforces the notion that a significant degree of heterogeneity exists within breast tumors in vivo, even within a specific subtype. Interestingly, while elevated p66ShcA levels induce the acquisition of mesenchymal features in all breast tumors, they are significantly enriched only in claudin-low tumors within the basal subtype. This suggests that p66ShcA increases plasticity of luminal breast tumors, by favoring coexpression of luminal and mesenchymal genes. Ironically, within the basal subtype, p66ShcA may limit plasticity by pushing these already more plastic tumors toward a full EMT and favor the emergence of claudin-low breast tumors (Fig. 9). The importance of p66ShcA in the emergence and tumorigenic potential of claudin-low breast tumors requires further experimentation. Finally, this study suggests that although established breast cancer cell lines retain many luminal or basal features that are observed in primary tumors at the molecular level, they do not capture the inherent heterogeneity that is found in primary clinical material. Thus, they are a useful surrogate for, but not an exact representation of, what is observed in primary breast cancers.
Numerous studies highlight a critical role for the ShcA isoforms in breast cancer. Increased ShcA signaling predicts lymph node positivity, high grade, and relapse in breast cancer patients (40). High ShcA levels are enriched in HER2+ and basal tumors and are associated with reduced survival of breast cancer patients (23). In transgenic mouse models, deletion of all three ShcA isoforms in the mammary epithelium virtually ablates ErbB2-driven tumor induction (23, 25). Using xenograft approaches, an important role for p46/52ShcA during mammary tumor growth, angiogenesis, and metastasis was shown (22, 24, 25). Our in vivo studies provide the first experimental evidence that p66ShcA contributes to tumor heterogeneity in luminal breast cancers by inducing an EMT. However, we also show a modest p66ShcA-induced impairment of luminal tumor growth. These dichotomous roles for p66ShcA in breast cancers are in agreement with contradictory studies that interrogated the relationship between p66ShcA and disease outcome. While some studies suggest that high p66ShcA levels are associated with good outcome in breast cancers (40), others correlate high p66ShcA levels with increased lymph node positivity, grade, and recurrence in breast, prostate, and colon cancer patients (41–43). We suggest that the association between high p66ShcA levels and good outcome is reflective of the fact that p66ShcA is enriched in luminal breast cancers. In these studies, the predictive power of p66ShcA as a good prognosis biomarker is significantly increased when stratifying for tumors with reduced ShcA tyrosine phosphorylation (40). Thus, it is possible that the combination of p66ShcAHigh and ShcA-pTyrLow as stratification tools selects for luminal breast tumors with reduced receptor tyrosine kinase signaling. In contrast, an association between p66ShcA levels and poor outcome (41–43) may be reflective of increased tumor heterogeneity and is consistent with our observation that p66ShcA increases the migratory properties of luminal breast cancers.
Consistent with these clinical correlates, numerous studies have suggested both pro- and antitumorigenic properties for p66ShcA signaling. In response to stress stimuli, p66ShcA catalyzes electron transport from cytochrome c and promotes the formation of reactive oxygen species (ROS) (21). Extremely high ROS levels disrupt the mitochondrial membrane potential, leading to opening of the permeability transition pore, cytochrome c release, and apoptosis (18). We hypothesize that reduced p66ShcA-induced tumor cell proliferation is likely reflective of increased oxidative stress, which is consistent with the observation that p66ShcA is Ser36 phosphorylated in the luminal breast cancer cell lines examined in this study.
However, most solid tumors exhibit moderately elevated ROS levels, which facilitate neoplastic growth by stimulating an inflammatory response (44). By inducing the NF-κB pathway, ROS increases tumor cell proliferation and survival (45) and stimulates the recruitment of stromal cells that facilitate tumor growth and metastasis (46).Our observations suggest that p66ShcA signaling increases Met and NF-κB signaling in breast tumors, coincident with a robust increase in tumor angiogenesis. Indeed, both NF-κB and Met transduce proangiogenic stimuli in cancer cells (47, 48). Thus, this study suggests that p66ShcA functions in a cell-autonomous manner and may also collaborate with the microenvironment to establish an EMT in vivo. Moreover, p66ShcA expression is sufficient to increase Met signaling in vitro, which, in turn, promotes the acquisition of mesenchymal markers in breast cancer cells. Interestingly, while the Met receptor tyrosine kinase is a clinically relevant biomarker of poor outcome basal breast cancers (38), a subset of luminal breast tumors examined in this work coordinately display increased Met, HGF, and p66ShcA expression, coincident with the attainment of an EMT phenotype. The observation that Met-driven, claudin-low transgenic mammary tumors further increase endogenous p66ShcA expression reinforces the hypothesis that a Met/p66ShcA-driven signaling axis is central for the ability of a mammary tumor to undergo an epithelial-to-mesenchymal transition.
In contrast, p66ShcA overexpression only activates NF-κB signaling in mammary tumors in vivo. Moreover, it is intriguing that we only observe elevated NF-κB activation, in addition to increased expression of protumorigenic NF-κB target genes, in p66ShcA-expressing mammary tumors that have undergone a full EMT. In contrast, BT474/p66ShcA tumors enhance vimentin expression but retain their luminal characteristics. Interestingly, the degree of NF-κB signaling in control BT474 tumors is comparable to that in p66ShcA-expressing BT474 tumors. Given that NF-κB is a known inducer of an EMT (34), this raises the intriguing possibility that tumor microenvironmental cues that increase stress signaling in vivo, including tumor hypoxia and inflammation, collaborate with p66ShcA to engage the NF-κB pathway and fully drive the EMT process. This study has important clinical implications, as it demonstrates that p66ShcA functions as a molecular driver of an EMT, irrespective of breast cancer subtype. Thus, it may assist in the development of broadly applicable targeted therapies that span all molecular subtypes.
Supplementary Material
ACKNOWLEDGMENTS
We thank Peter Siegel for critical reading of the manuscript.
This work was supported by Susan G. Komen (KG110197) and Cancer Research Society grants awarded to J.U.-S. J.U.-S. holds a Canadian Institutes of Health Research New Investigator award. M.P. holds the Diane and Sal Guerrera Chair in Cancer Genetics at McGill University. J.R.H., R.A., R.L.S., and L.F. are recipients of McGill Integrated Cancer Research Training Program studentships. J.K. is the recipient of a Susan G. Komen fellowship.
Footnotes
Published ahead of print 28 July 2014
Supplemental material for this article may be found at http://dx.doi.org/10.1128/MCB.00341-14.
REFERENCES
- 1.Perou CM, Sorlie T, Eisen MB, van de Rijn M, Jeffrey SS, Rees CA, Pollack JR, Ross DT, Johnsen H, Akslen LA, Fluge O, Pergamenschikov A, Williams C, Zhu SX, Lonning PE, Borresen-Dale AL, Brown PO, Botstein D. 2000. Molecular portraits of human breast tumours. Nature 406:747–752. 10.1038/35021093 [DOI] [PubMed] [Google Scholar]
- 2.van de Vijver MJ, He YD, van't Veer LJ, Dai H, Hart AA, Voskuil DW, Schreiber GJ, Peterse JL, Roberts C, Marton MJ, Parrish M, Atsma D, Witteveen A, Glas A, Delahaye L, van der Velde T, Bartelink H, Rodenhuis S, Rutgers ET, Friend SH, Bernards R. 2002. A gene-expression signature as a predictor of survival in breast cancer. N. Engl. J. Med. 347:1999–2009. 10.1056/NEJMoa021967 [DOI] [PubMed] [Google Scholar]
- 3.Visvader JE. 2009. Keeping abreast of the mammary epithelial hierarchy and breast tumorigenesis. Genes Dev. 23:2563–2577. 10.1101/gad.1849509 [DOI] [PMC free article] [PubMed] [Google Scholar]
- 4.Gusterson BA, Ross DT, Heath VJ, Stein T. 2005. Basal cytokeratins and their relationship to the cellular origin and functional classification of breast cancer. Breast Cancer Res. 7:143–148. 10.1186/bcr1041 [DOI] [PMC free article] [PubMed] [Google Scholar]
- 5.Neve RM, Chin K, Fridlyand J, Yeh J, Baehner FL, Fevr T, Clark L, Bayani N, Coppe JP, Tong F, Speed T, Spellman PT, DeVries S, Lapuk A, Wang NJ, Kuo WL, Stilwell JL, Pinkel D, Albertson DG, Waldman FM, McCormick F, Dickson RB, Johnson MD, Lippman M, Ethier S, Gazdar A, Gray JW. 2006. A collection of breast cancer cell lines for the study of functionally distinct cancer subtypes. Cancer Cell 10:515–527. 10.1016/j.ccr.2006.10.008 [DOI] [PMC free article] [PubMed] [Google Scholar]
- 6.Prat A, Parker JS, Karginova O, Fan C, Livasy C, Herschkowitz JI, He X, Perou CM. 2010. Phenotypic and molecular characterization of the claudin-low intrinsic subtype of breast cancer. Breast Cancer Res. 12:R68. 10.1186/bcr2635 [DOI] [PMC free article] [PubMed] [Google Scholar]
- 7.Taube JH, Herschkowitz JI, Komurov K, Zhou AY, Gupta S, Yang J, Hartwell K, Onder TT, Gupta PB, Evans KW, Hollier BG, Ram PT, Lander ES, Rosen JM, Weinberg RA, Mani SA. 2010. Core epithelial-to-mesenchymal transition interactome gene-expression signature is associated with claudin-low and metaplastic breast cancer subtypes. Proc. Natl. Acad. Sci. U. S. A. 107:15449–15454. 10.1073/pnas.1004900107 [DOI] [PMC free article] [PubMed] [Google Scholar]
- 8.Drasin DJ, Robin TP, Ford HL. 2011. Breast cancer epithelial-to-mesenchymal transition: examining the functional consequences of plasticity. Breast Cancer Res. 13:226. 10.1186/bcr3037 [DOI] [PMC free article] [PubMed] [Google Scholar]
- 9.Côme C, Magnino F, Bibeau F, De Santa Barbara P, Becker KF, Theillet C, Savagner P. 2006. Snail and slug play distinct roles during breast carcinoma progression. Clin. Cancer Res. 12:5395–5402. 10.1158/1078-0432.CCR-06-0478 [DOI] [PubMed] [Google Scholar]
- 10.Moody SE, Perez D, Pan TC, Sarkisian CJ, Portocarrero CP, Sterner CJ, Notorfrancesco KL, Cardiff RD, Chodosh LA. 2005. The transcriptional repressor Snail promotes mammary tumor recurrence. Cancer Cell 8:197–209. 10.1016/j.ccr.2005.07.009 [DOI] [PubMed] [Google Scholar]
- 11.Yang J, Mani SA, Donaher JL, Ramaswamy S, Itzykson RA, Come C, Savagner P, Gitelman I, Richardson A, Weinberg RA. 2004. Twist, a master regulator of morphogenesis, plays an essential role in tumor metastasis. Cell 117:927–939. 10.1016/j.cell.2004.06.006 [DOI] [PubMed] [Google Scholar]
- 12.Migliaccio E, Mele S, Salcini AE, Pelicci G, Lai KM, Superti-Furga G, Pawson T, Di Fiore PP, Lanfrancone L, Pelicci PG. 1997. Opposite effects of the p52shc/p46shc and p66shc splicing isoforms on the EGF receptor-MAP kinase-fos signalling pathway. EMBO J. 16:706–716. 10.1093/emboj/16.4.706 [DOI] [PMC free article] [PubMed] [Google Scholar]
- 13.Pelicci G, Lanfrancone L, Grignani F, McGlade J, Cavallo F, Forni G, Nicoletti I, Pawson T, Pelicci PG. 1992. A novel transforming protein (SHC) with an SH2 domain is implicated in mitogenic signal transduction. Cell 70:93–104. 10.1016/0092-8674(92)90536-L [DOI] [PubMed] [Google Scholar]
- 14.Ventura A, Luzi L, Pacini S, Baldari CT, Pelicci PG. 2002. The p66Shc longevity gene is silenced through epigenetic modifications of an alternative promoter. J. Biol. Chem. 277:22370–22376. 10.1074/jbc.M200280200 [DOI] [PubMed] [Google Scholar]
- 15.Gu H, Maeda H, Moon JJ, Lord JD, Yoakim M, Nelson BH, Neel BG. 2000. New role for Shc in activation of the phosphatidylinositol 3-kinase/Akt pathway. Mol. Cell. Biol. 20:7109–7120. 10.1128/MCB.20.19.7109-7120.2000 [DOI] [PMC free article] [PubMed] [Google Scholar]
- 16.Rozakis-Adcock M, Fernley R, Wade J, Pawson T, Bowtell D. 1993. The SH2 and SH3 domains of mammalian Grb2 couple the EGF receptor to the Ras activator mSos1. Nature 363:83–85. 10.1038/363083a0 [DOI] [PubMed] [Google Scholar]
- 17.Migliaccio E, Giorgio M, Mele S, Pelicci G, Reboldi P, Pandolfi PP, Lanfrancone L, Pelicci PG. 1999. The p66shc adaptor protein controls oxidative stress response and life span in mammals. Nature 402:309–313. 10.1038/46311 [DOI] [PubMed] [Google Scholar]
- 18.Orsini F, Migliaccio E, Moroni M, Contursi C, Raker VA, Piccini D, Martin-Padura I, Pelliccia G, Trinei M, Bono M, Puri C, Tacchetti C, Ferrini M, Mannucci R, Nicoletti I, Lanfrancone L, Giorgio M, Pelicci PG. 2004. The life span determinant p66Shc localizes to mitochondria where it associates with mitochondrial heat shock protein 70 and regulates trans-membrane potential. J. Biol. Chem. 279:25689–25695. 10.1074/jbc.M401844200 [DOI] [PubMed] [Google Scholar]
- 19.Gertz M, Fischer F, Wolters D, Steegborn C. 2008. Activation of the lifespan regulator p66Shc through reversible disulfide bond formation. Proc. Natl. Acad. Sci. U. S. A. 105:5705–5709. 10.1073/pnas.0800691105 [DOI] [PMC free article] [PubMed] [Google Scholar]
- 20.Pinton P, Rimessi A, Marchi S, Orsini F, Migliaccio E, Giorgio M, Contursi C, Minucci S, Mantovani F, Wieckowski MR, Del Sal G, Pelicci PG, Rizzuto R. 2007. Protein kinase C beta and prolyl isomerase 1 regulate mitochondrial effects of the life-span determinant p66Shc. Science 315:659–663. 10.1126/science.1135380 [DOI] [PubMed] [Google Scholar]
- 21.Giorgio M, Migliaccio E, Orsini F, Paolucci D, Moroni M, Contursi C, Pelliccia G, Luzi L, Minucci S, Marcaccio M, Pinton P, Rizzuto R, Bernardi P, Paolucci F, Pelicci PG. 2005. Electron transfer between cytochrome c and p66Shc generates reactive oxygen species that trigger mitochondrial apoptosis. Cell 122:221–233. 10.1016/j.cell.2005.05.011 [DOI] [PubMed] [Google Scholar]
- 22.Ahn R, Sabourin V, Ha JR, Cory S, Maric G, Im YK, Hardy WR, Zhao H, Park M, Hallett M, Siegel PM, Pawson T, Ursini-Siegel J. 2013. The ShcA PTB domain functions as a biological sensor of phosphotyrosine signaling during breast cancer progression. Cancer Res. 73:4521–4532. 10.1158/0008-5472.CAN-12-4178 [DOI] [PubMed] [Google Scholar]
- 23.Ursini-Siegel J, Cory S, Zuo D, Hardy WR, Rexhepaj E, Lam S, Schade B, Jirstrom K, Bjur E, Piccirillo CA, Denardo D, Coussens LM, Brennan DJ, Gallagher WM, Park M, Pawson T, Hallett M, Muller WJ. 2010. Receptor tyrosine kinase signaling favors a protumorigenic state in breast cancer cells by inhibiting the adaptive immune response. Cancer Res. 70:7776–7787. 10.1158/0008-5472.CAN-10-2229 [DOI] [PMC free article] [PubMed] [Google Scholar]
- 24.Ursini-Siegel J, Hardy WR, Zheng Y, Ling C, Zuo D, Zhang C, Podmore L, Pawson T, Muller WJ. 2012. The ShcA SH2 domain engages a 14-3-3/PI3′K signaling complex and promotes breast cancer cell survival. Oncogene 31:5038–5044. 10.1038/onc.2012.4 [DOI] [PubMed] [Google Scholar]
- 25.Ursini-Siegel J, Hardy WR, Zuo D, Lam SH, Sanguin-Gendreau V, Cardiff RD, Pawson T, Muller WJ. 2008. ShcA signalling is essential for tumour progression in mouse models of human breast cancer. EMBO J. 27:910–920. 10.1038/emboj.2008.22 [DOI] [PMC free article] [PubMed] [Google Scholar]
- 26.Northey JJ, Chmielecki J, Ngan E, Russo C, Annis MG, Muller WJ, Siegel PM. 2008. Signaling through ShcA is required for transforming growth factor beta- and Neu/ErbB-2-induced breast cancer cell motility and invasion. Mol. Cell. Biol. 28:3162–3176. 10.1128/MCB.01734-07 [DOI] [PMC free article] [PubMed] [Google Scholar]
- 27.Gautier L, Cope L, Bolstad BM, Irizarry RA. 2004. affy—analysis of Affymetrix GeneChip data at the probe level. Bioinformatics 20:307–315. 10.1093/bioinformatics/btg405 [DOI] [PubMed] [Google Scholar]
- 28.Parker JS, Mullins M, Cheang MC, Leung S, Voduc D, Vickery T, Davies S, Fauron C, He X, Hu Z, Quackenbush JF, Stijleman IJ, Palazzo J, Marron JS, Nobel AB, Mardis E, Nielsen TO, Ellis MJ, Perou CM, Bernard PS. 2009. Supervised risk predictor of breast cancer based on intrinsic subtypes. J. Clin. Oncol. 27:1160–1167. 10.1200/JCO.2008.18.1370 [DOI] [PMC free article] [PubMed] [Google Scholar]
- 29.The Cancer Genome Atlas Network. 2012. Comprehensive molecular portraits of human breast tumours. Nature 490:61–70. 10.1038/nature11412 [DOI] [PMC free article] [PubMed] [Google Scholar]
- 30.Herschkowitz JI, Simin K, Weigman VJ, Mikaelian I, Usary J, Hu Z, Rasmussen KE, Jones LP, Assefnia S, Chandrasekharan S, Backlund MG, Yin Y, Khramtsov AI, Bastein R, Quackenbush J, Glazer RI, Brown PH, Green JE, Kopelovich L, Furth PA, Palazzo JP, Olopade OI, Bernard PS, Churchill GA, Van Dyke T, Perou CM. 2007. Identification of conserved gene expression features between murine mammary carcinoma models and human breast tumors. Genome Biol. 8:R76. 10.1186/gb-2007-8-5-r76 [DOI] [PMC free article] [PubMed] [Google Scholar]
- 31.Masi G, Mercati D, Vannuccini E, Paccagnini E, Riparbelli MG, Lupetti P, Pelicci PG, Baldari CT, Ulivieri C. 2014. p66Shc regulates vesicle-mediated secretion in mast cells by affecting F-actin dynamics. J. Leukoc. Biol. 95:285–292. 10.1189/jlb.0313178 [DOI] [PubMed] [Google Scholar]
- 32.Patrussi L, Capitani N, Cannizzaro E, Finetti F, Lucherini OM, Pelicci PG, Baldari CT. 2014. Negative regulation of chemokine receptor signaling and B-cell chemotaxis by p66Shc. Cell Death Dis. 5:e1068. 10.1038/cddis.2014.44 [DOI] [PMC free article] [PubMed] [Google Scholar]
- 33.Giannoni E, Parri M, Chiarugi P. 2012. EMT and oxidative stress: a bidirectional interplay affecting tumor malignancy. Antioxid. Redox Signal. 16:1248–1263. 10.1089/ars.2011.4280 [DOI] [PubMed] [Google Scholar]
- 34.Min C, Eddy SF, Sherr DH, Sonenshein GE. 2008. NF-kappaB and epithelial to mesenchymal transition of cancer. J. Cell. Biochem. 104:733–744. 10.1002/jcb.21695 [DOI] [PubMed] [Google Scholar]
- 35.Muraoka RS, Koh Y, Roebuck LR, Sanders ME, Brantley-Sieders D, Gorska AE, Moses HL, Arteaga CL. 2003. Increased malignancy of Neu-induced mammary tumors overexpressing active transforming growth factor beta1. Mol. Cell. Biol. 23:8691–8703. 10.1128/MCB.23.23.8691-8703.2003 [DOI] [PMC free article] [PubMed] [Google Scholar]
- 36.Garofalo M, Romano G, Di Leva G, Nuovo G, Jeon YJ, Ngankeu A, Sun J, Lovat F, Alder H, Condorelli G, Engelman JA, Ono M, Rho JK, Cascione L, Volinia S, Nephew KP, Croce CM. 2012. EGFR and MET receptor tyrosine kinase-altered microRNA expression induces tumorigenesis and gefitinib resistance in lung cancers. Nat. Med. 18:74–82. 10.1038/nm.2577 [DOI] [PMC free article] [PubMed] [Google Scholar] [Retracted]
- 37.Knight JF, Lesurf R, Zhao H, Pinnaduwage D, Davis RR, Saleh SM, Zuo D, Naujokas MA, Chughtai N, Herschkowitz JI, Prat A, Mulligan AM, Muller WJ, Cardiff RD, Gregg JP, Andrulis IL, Hallett MT, Park M. 2013. Met synergizes with p53 loss to induce mammary tumors that possess features of claudin-low breast cancer. Proc. Natl. Acad. Sci. U. S. A. 110:E1301–E1310. 10.1073/pnas.1210353110 [DOI] [PMC free article] [PubMed] [Google Scholar]
- 38.Ponzo MG, Lesurf R, Petkiewicz S, O'Malley FP, Pinnaduwage D, Andrulis IL, Bull Chughtai SBN, Zuo D, Souleimanova M, Germain D, Omeroglu A, Cardiff RD, Hallett M, Park M. 2009. Met induces mammary tumors with diverse histologies and is associated with poor outcome and human basal breast cancer. Proc. Natl. Acad. Sci. U. S. A. 106:12903–12908. 10.1073/pnas.0810402106 [DOI] [PMC free article] [PubMed] [Google Scholar]
- 39.Ignatiadis M, Sotiriou C. 2013. Luminal breast cancer: from biology to treatment. Nat. Rev. Clin. Oncol. 10:494–506. 10.1038/nrclinonc.2013.124 [DOI] [PubMed] [Google Scholar]
- 40.Davol PA, Bagdasaryan R, Elfenbein GJ, Maizel AL, Frackelton AR., Jr 2003. Shc proteins are strong, independent prognostic markers for both node-negative and node-positive primary breast cancer. Cancer Res. 63:6772–6783 [PubMed] [Google Scholar]
- 41.Grossman SR, Lyle S, Resnick MB, Sabo E, Lis RT, Rosinha E, Liu Q, Hsieh CC, Bhat G, Frackelton AR, Jr, Hafer LJ. 2007. p66 Shc tumor levels show a strong prognostic correlation with disease outcome in stage IIA colon cancer. Clin. Cancer Res. 13:5798–5804. 10.1158/1078-0432.CCR-07-0073 [DOI] [PubMed] [Google Scholar]
- 42.Jackson JG, Yoneda T, Clark GM, Yee D. 2000. Elevated levels of p66 Shc are found in breast cancer cell lines and primary tumors with high metastatic potential. Clin. Cancer Res. 6:1135–1139 [PubMed] [Google Scholar]
- 43.Lee MS, Igawa T, Chen SJ, Van Bemmel D, Lin JS, Lin FF, Johansson SL, Christman JK, Lin MF. 2004. p66Shc protein is upregulated by steroid hormones in hormone-sensitive cancer cells and in primary prostate carcinomas. Int. J. Cancer 108:672–678. 10.1002/ijc.11621 [DOI] [PubMed] [Google Scholar]
- 44.Ralph SJ, Rodriguez-Enriquez S, Neuzil J, Saavedra E, Moreno-Sanchez R. 2010. The causes of cancer revisited: “mitochondrial malignancy” and ROS-induced oncogenic transformation—why mitochondria are targets for cancer therapy. Mol. Aspects Med. 31:145–170. 10.1016/j.mam.2010.02.008 [DOI] [PubMed] [Google Scholar]
- 45.Bubici C, Papa S, Dean K, Franzoso G. 2006. Mutual cross-talk between reactive oxygen species and nuclear factor-kappa B: molecular basis and biological significance. Oncogene 25:6731–6748. 10.1038/sj.onc.1209936 [DOI] [PubMed] [Google Scholar]
- 46.Nowsheen S, Aziz K, Kryston TB, Ferguson NF, Georgakilas A. 2012. The interplay between inflammation and oxidative stress in carcinogenesis. Curr. Mol. Med. 12:672–680. 10.2174/156652412800792642 [DOI] [PubMed] [Google Scholar]
- 47.Prasad S, Ravindran J, Aggarwal BB. 2010. NF-kappaB and cancer: how intimate is this relationship. Mol. Cell. Biochem. 336:25–37. 10.1007/s11010-009-0267-2 [DOI] [PMC free article] [PubMed] [Google Scholar]
- 48.Zhang YW, Su Y, Volpert OV, Vande Woude GF. 2003. Hepatocyte growth factor/scatter factor mediates angiogenesis through positive VEGF and negative thrombospondin 1 regulation. Proc. Natl. Acad. Sci. U. S. A. 100:12718–12723. 10.1073/pnas.2135113100 [DOI] [PMC free article] [PubMed] [Google Scholar]
Associated Data
This section collects any data citations, data availability statements, or supplementary materials included in this article.