

Abstract
The diagnosis and management of pneumonia are limited by the use of culture-based techniques of microbial identification, which may fail to identify unculturable, fastidious, and metabolically active viable but unculturable bacteria. Novel high-throughput culture-independent techniques hold promise but have not been systematically compared to conventional culture. We analyzed 46 clinically obtained bronchoalveolar lavage (BAL) fluid specimens from symptomatic and asymptomatic lung transplant recipients both by culture (using a clinical microbiology laboratory protocol) and by bacterial 16S rRNA gene pyrosequencing. Bacteria were identified in 44 of 46 (95.7%) BAL fluid specimens by culture-independent sequencing, significantly more than the number of specimens in which bacteria were detected (37 of 46, 80.4%, P ≤ 0.05) or “pathogen” species reported (18 of 46, 39.1%, P ≤ 0.0001) via culture. Identification of bacteria by culture was positively associated with culture-independent indices of infection (total bacterial DNA burden and low bacterial community diversity) (P ≤ 0.01). In BAL fluid specimens with no culture growth, the amount of bacterial DNA was greater than that in reagent and rinse controls, and communities were markedly dominated by select Gammaproteobacteria, notably Escherichia species and Pseudomonas fluorescens. Culture growth above the threshold of 104 CFU/ml was correlated with increased bacterial DNA burden (P < 0.01), decreased community diversity (P < 0.05), and increased relative abundance of Pseudomonas aeruginosa (P < 0.001). We present two case studies in which culture-independent techniques identified a respiratory pathogen missed by culture and clarified whether a cultured “oral flora” species represented a state of acute infection. In summary, we found that bacterial culture of BAL fluid is largely effective in discriminating acute infection from its absence and identified some specific limitations of BAL fluid culture in the diagnosis of pneumonia. We report the first correlation of quantitative BAL fluid culture results with culture-independent evidence of infection.
INTRODUCTION
Pneumonia remains a leading cause of death in the United States (1), and respiratory infections are responsible for a greater global burden of disease than malignancy, ischemic heart disease, or diabetes mellitus (2). The diagnosis and management of pneumonia are limited by the use of conventional culture-based techniques (3). In recent years, novel culture-independent techniques of microbial identification have revealed that bronchoalveolar lavage (BAL) fluid specimens contain diverse communities of bacteria previously undetected via culture-based approaches (4–6). These techniques, while promising, have not been systematically compared to conventional culture-based approaches, including quantitative BAL fluid cultures (7).
In this study, we compared conventional BAL fluid cultures (which were optimized to identify acute infection) with a culture-independent research technique, pyrosequencing (which is designed to identify microbial communities independent of subjects' clinical status). Our goal was to identify strengths and limitations of each technique through parallel application of complementary approaches. We hypothesized that pyrosequencing would identify bacteria in more specimens than culture, that culture results (including quantitative BAL fluid culture) would correlate with culture-independent indices of infection, and that specific features of microbial communities identified via pyrosequencing would predict the results of bacterial culture.
MATERIALS AND METHODS
Ethics statement.
All clinical investigations were conducted according to the principles of the Declaration of Helsinki. The study protocol was approved by the institutional review board of the University of Michigan Health System (HUM00042443). All patients provided written informed consent.
Study population.
BAL fluid samples were obtained consecutively from lung transplant recipients undergoing bronchoscopy at the University of Michigan between 1 November 2011 and 1 August 2012. Clinical data were abstracted from the electronic medical record. We enrolled 33 subjects and performed 46 bronchoscopies, 21 (45.6%) for an acute clinical indication (dyspnea, cough, radiographic infiltrate, or decline in lung function) on 16 unique patients, and the remaining 25 (54.3%) as surveillance bronchoscopies on 17 asymptomatic patients. When multiple specimens were obtain from the same subject, repeat bronchoscopy was performed either due to a change in clinical status (e.g., new suspicion for infection or rejection) or because of scheduled posttransplant surveillance bronchoscopies (performed posttransplant at 6 weeks, 3 months, 6 months, and 1 year). Most (29/33, 79%) subjects were male, and most bronchoscopies (31/46, 67%) were performed within 1 year of transplantation. The most common pretransplant diagnosis was pulmonary fibrosis, followed by cystic fibrosis (CF) and chronic obstructive pulmonary disease (COPD). Patients were receiving antibiotics (beyond routine anti-Pneumocystis prophylaxis) at the time of 16 (35%) bronchoscopies. All specimens were tested by PCR for common respiratory viruses (influenza, respiratory syncytial virus, adenovirus, parainfluenza virus, and human metapneumovirus) and were negative; all specimens were studied using fungal and acid-fast bacillus (AFB) culture, and no respiratory pathogens were identified. Further clinical and demographic details, as well as comparison of specimens from symptomatic and asymptomatic subjects, have been previously reported (8).
Sample acquisition and processing.
Patients received conscious sedation and nebulized lidocaine. The bronchoscope was advanced via the mouth or nose and through the vocal cords. As has been previously reported, despite the widely divergent microbiota of the nose and mouth (9), the route of bronchoscope insertion (oral or nasal) had no detectable influence on BAL fluid microbiota (8), implying minimal contribution to BAL fluid communities from upper respiratory tract microbiota. After a brief airway exam, the bronchoscope was wedged in the right middle lobe or lingula of the allograft (for surveillance bronchoscopies) or, in the case of symptomatic patients with available imaging, in the segment with the most evidence of radiographic abnormality. Collection of BAL fluid specimens was performed with instillation of between 120 and 300 ml of sterile isotonic saline. Samples were fractionated into two aliquots, with one processed by the University of Michigan Clinical Microbiology Laboratory for bacterial culture. The other was stored on ice, centrifuged at 13,000 rpm (22,500 × g) for 30 min (Hermle Z 231 M microcentrifuge), separated from its supernatant, and stored at −80°C until the time of DNA extraction.
Bacterial culture.
Bacterial culture was performed according to routine clinical protocol. BAL fluid was plated on chocolate, sheep blood, and MacConkey agar plates and incubated for 72 h. Bacteria were identified and reported if they grew >104 CFU per ml or grew <104 CFU/ml but were identified as a single Gram-negative bacillus that was the only reportable pathogen. The following organisms, when identified, were reported as oral flora: coagulase-negative Staphylococcus spp., alpha-hemolytic Streptococcus spp., gamma-hemolytic Streptococcus spp., Micrococcus spp., Enterococcus spp., Corynebacterium spp., Lactobacillus spp., Bacillus spp. (other than B. anthracis), Neisseria spp., Haemophilus spp. (other than Haemophilus influenzae), Eikenella spp., Capnocytophaga spp., and yeast (other than Cryptococcus spp.).
DNA isolation, quantitative PCR, and 454 pyrosequencing.
Genomic DNA was extracted from BAL fluid pellets, resuspended in 360 μl animal tissue lysis (ATL) buffer (Qiagen DNeasy blood and tissue kit) and homogenized in UltraClean fecal DNA bead tubes (MO-BIO, Carlsbad, CA) using a modified protocol previously demonstrated to isolate bacterial DNA (10). Quantification of bacterial 16S rRNA genes was performed by real-time PCR utilizing TaqMan hydrolysis probes on a Roche 480 LightCycler, as described previously (8, 11–13). The level of detection (LOD) was determined using a standard curve for the quantitative PCR (qPCR) assay and was based on the number of copies present in the lowest 16S qPCR standard that is different from the no-DNA standard and falls within the linear range of the analysis. For pyrosequencing, the V3-to-V5 hypervariable regions of the bacterial 16S rRNA gene were sequenced in the V5-to-V3 direction using bar-coded primer sets corresponding to 357F (forward) and 929R (reverse) (8). Amplicon libraries were generated as previously described (8). Primary PCR cycling conditions were 95°C for 2 min followed by 20 cycles of touchdown PCR (95°C for 20 s, followed by annealing for 30 s beginning at 60°C and decreasing 1°C every 2 cycles until 50°C, and an elongation of 72°C for 45 s) and 20 cycles of standard PCR (95°C for 20 s, 50°C for 30 s, and 72°C for 45 s), and then finished with 72°C for 5 min. This protocol has been optimized for low biomass samples and produces a low fraction of spurious priming while simultaneously not biasing the results from high-biomass communities (14). Amplicon libraries were sequenced using a Roche 454 GS Junior according to established protocols (15). The mean number of high-quality reads per specimen was 1,633 ± 650.
Sequences are available online at the NIH Sequence Read Archive (accession number SRP041659).
Positive control standards, preprocedure bronchoscope rinse controls, and reagent water controls were analyzed with each sequencing run as quality controls. Serial positive-control sequencing results are shown in Fig. 1. According to qPCR, negative-control specimens contained between 10-fold and 105-fold less bacterial 16S DNA than BAL fluid specimens. Bacterial communities detected in negative-control specimens were significantly distinct from those detected in the BAL fluid of symptomatic and asymptomatic subjects (see Fig. S1 in the supplemental material) (P ≤ 0.001) (PERMANOVA [adonis]).
FIG 1.

Reproducibility of pyrosequencing protocol. Positive control mixtures of fixed amounts and types of bacterial 16S rRNA gene amplicons (3.3 ng of total DNA comprising equal parts from each listed plasmid) were serially resequenced using the same GS Junior system. The run corresponding to the current study is identified (run 10).
Data analysis.
Sequence data were processed using the software mothur v.1.27.0 according to the standard operating procedure for 454 sequence data (http://www.mothur.org) using a minimum sequence length of 250 base pairs (16). A shared community file and a phylotyped (genus-level grouping) file were generated using operational taxonomic units (OTUs) binned at 97% identity. OTUs detected in controls were removed from all BAL fluid specimens prior to analysis. OTU numbers were assigned in the binning process and classification was carried out using the mothur implementation of the Ribosomal Database Project (RDP) Classifier and the RDP taxonomy training set (http://rdp.cme.msu.edu). Using multiple complementary techniques (culture, microbe-specific PCR, NCBI BLAST, and phylogenetic tree generation), we have previously identified two prominent Pseudomonas-classified OTUs in this data set as Pseudomonas aeruginosa (0153) and Pseudomonas fluorescens (0969) (8). Comparison of group proportions was performed using Fisher's exact test. Odds ratios were determined using univariable and multivariable logistic regression in R (17). Group means were compared using t test and analysis of variance (ANOVA) with Tukey's multiple-comparison test (17, 18). All analyses were performed in R and GraphPad Prism 6.
RESULTS
Are more bacteria in BAL fluid specimens identified by pyrosequencing than by culture?
By culture, one or more bacterial species were identified and reported in 18 of 46 (39.1%) BAL fluid specimens. In another 19 (41.3%) samples, bacterial growth was positive but only oral flora were reported. In contrast, bacterial DNA was detected by pyrosequencing in 44 (95.7%) specimens, a significantly greater percentage than had bacteria detected via any culture growth (P ≤ 0.05) or with species reported (excluding oral flora specimens) (P ≤ 0.0001) (Fig. 2). Stratification of patients by clinical status at the time of bronchoscopy did not significantly alter these results (Table 1), nor did restriction of analysis to the initial bronchoscopy performed for each subject. Thus, pyrosequencing identified bacteria in more specimens than did culture.
FIG 2.

Detection of bacteria in BAL fluid specimens by pyrosequencing and conventional culture techniques. BAL fluid specimens with bacteria detected via culture (any culture growth) are divided into those with specific species identified and reported (bacterial species reported) and those for which only oral flora was reported (“oral flora” only). Proportions compared using Fisher's exact test.
TABLE 1.
Sensitivity of pyrosequencing and culture in detecting bacteria stratified by patient clinical status
| Patient clinical status (n) | No. (%) of BAL specimens with bacteria identified |
|||
|---|---|---|---|---|
| Pyrosequencing | Culture growth: any | Culture growth: species identified | Culture growth: oral flora only | |
| Symptomatic (22) | 21 (95.4) | 18 (81.8) | 12 (54.5) | 6 (27.3) |
| Asymptomatic (24) | 23 (95.8) | 19 (79.2) | 6 (25.0) | 13 (54.2) |
What factors predict identification of bacteria via culture?
To identify factors associated with bacterial identification via culture, we performed univariable and multivariable logistic regression analyses using host and microbial community factors to predict two main outcomes for each specimen, (i) any bacterial growth via culture and (ii) bacterial species reported (excluding oral flora specimens) (Table 2). Bacterial identification by culture (i.e., reporting of a respiratory “pathogen”) was positively associated with total bacterial DNA burden (P < 0.01) and low community diversity (P = 0.01) and inversely associated with relative abundance of Bacteroidetes at the phylum level (P = 0.03), though the latter association was not significant when controlled via multivariable logistic regression for total bacterial DNA and community diversity (P > 0.05). The presence of any bacterial growth was negatively associated with relative abundance of the Proteobacteria phylum (P = 0.04), driven by two prominent OTUs. Specifically, the relative abundance of Escherichia sp. (1087) and P. fluorescens (0969) were negatively associated with any culture growth (P < 0.01 for each). As reported previously, OTU 0969 was identified as P. fluorescens and was taxonomically distinct from P. aeruginosa (OTU 1053), by multiple complementary techniques (culture, microbe-specific PCR, NCBI BLAST, and phylogenetic tree generation) (8). The negative association between Escherichia sp. and bacterial growth remained significant (P = 0.04) even after controlling for total bacterial DNA and community diversity via multivariable logistic regression. All reported associations remained significant when controlled via multivariate logistic regression for antibiotic exposure. Altogether, detection and identification of bacteria via culture were dependent on both indices of acute infection (total bacterial DNA and low community diversity) and specific features of community membership, including a negative association with the relative abundance of the Proteobacteria phylum and two prominent Gammaproteobacteria OTUs.
TABLE 2.
Univariable logistic regression of predictors of bacterial identification
| Predictor(s) | Outcome: bacterial growth (any) |
Outcome: bacterial species reported (excluding oral flora) |
||
|---|---|---|---|---|
| P value | Odds ratio (95% CI)a | P value | Odds ratio (95% CI) | |
| BAL fluid feature(s) | ||||
| Bacterial DNA (16S rRNA genes) | 0.025 | 12.61 (2.06–175.7) | 0.007 | 3.58 (1.53–10.26) |
| % Neutrophils | 0.946 | 1.00 (0.97–1.04) | 0.148 | 1.02 (0.99–1.05) |
| % Lymphocytes | 0.053 | 0.94 (0.88–0.99) | 0.508 | 0.98 (0.91–1.03) |
| Antibiotics | ||||
| Prior 30 days | 0.151 | 0.20 (0.01–1.29) | 0.595 | 1.42 (0.40–5.55) |
| Prior 7 days | 0.668 | 0.20 (0.01–1.29) | 0.566 | 0.69 (0.19–2.40) |
| At time of BAL fluid collection | 0.465 | 1.91 (0.38–14.30) | 0.906 | 1.08 (0.29–3.85) |
| Diversity | ||||
| Inverse Simpson | 0.280 | 0.94 (0.83–1.07) | 0.245 | 0.92 (0.77–1.04) |
| Shannon index | 0.114 | 0.44 (0.14–1.11) | 0.013 | 0.37 (0.15–0.77) |
| Phylum (% relative abundance) | ||||
| Bacteroidetes | 0.158 | 1.05 (0.99–1.15) | 0.034 | 0.94 (0.88–0.99) |
| Proteobacteria | 0.041 | 0.97 (0.93–0.99) | 0.179 | 1.01 (0.99–1.03) |
| Firmicutes | 0.102 | 1.05 (1.00–1.14) | 0.566 | 1.01 (0.98–1.03) |
| Family (% relative abundance) | ||||
| Enterobacteriaceae | 0.005 | 0.85 (0.74–0.94) | 0.157 | 0.95 (0.87–1.01) |
| Prevotellaceae | 0.115 | 1.13 (1.02–1.41) | 0.077 | 0.95 (0.89–0.99) |
| Pseudomonadaceae | 0.259 | 0.99 (0.96–1.01) | 0.118 | 1.02 (1.00–1.04) |
| Staphylococcaceae | 0.605 | 1.03 (0.98 to NA) | 0.317 | 1.06 (1.00–1.27) |
| Streptococcaceae | 0.142 | 1.24 (1.03–1.81) | 0.495 | 0.98 (0.93–1.03) |
| Veillonellaceae | 0.180 | 1.63 (1.09–5.35) | 0.166 | 0.92 (0.81–1.02) |
| OTU (% relative abundance) | ||||
| 0969 (P. fluorescens) | 0.008 | 0.94 (0.88–0.97) | 0.053 | 0.95 (0.89–0.99) |
| 1053 (P. aeruginosa) | 0.525 | 1.06 (0.99 to NA) | 0.055 | 1.70 (1.12–3.36) |
| 1054 (Bordetella) | 0.868 | 0.99 (0.93–1.08) | 0.660 | 1.01 (0.95–1.07) |
| 1072 (Streptococcus) | 0.145 | 1.49 (1.07–3.53) | 0.422 | 0.97 (0.90–1.03) |
| 1077 (Veillonella) | 0.159 | 1.53 (1.07–4.21) | 0.181 | 0.93 (0.81–1.02) |
| 1087 (Escherichia) | 0.005 | 0.85 (0.74–0.93) | 0.160 | 0.95 (0.88–1.01) |
| 1095 (Prevotella) | 0.121 | 1.24 (1.03–1.91) | 0.153 | 0.96 (0.89–1.00) |
| 1098 (Staphylococcus) | 0.604 | 1.02 (0.98 to NA) | 0.315 | 1.06 (1.00–1.27) |
CI, confidence interval; NA, not applicable.
How do the bacterial communities detected in BAL fluid specimens with culture growth of only oral flora differ from those with no culture growth?
The designation of BAL fluid culture results as oral flora, common both in our study and in clinical practice, is of uncertain clinical significance. We compared pyrosequencing results of specimens with only oral flora reported and specimens with no bacterial growth (“culture negative”). The two groups did not differ from each other in total bacterial DNA nor in community diversity (P > 0.05), while each contained significantly less bacterial DNA (P < 0.05) and greater community diversity (P < 0.05) than specimens for which one or more species were reported (Fig. 3A and B). Both groups had greater bacterial DNA levels than reagent water and bronchoscope rinse controls (P < 0.01). Oral flora and culture-negative specimens differed greatly in their bacterial community composition. At the phylum level, culture-negative specimens contained significantly more Proteobacteria and less Bacteroidetes than did oral flora specimens (P < 0.05) (Fig. 3C and D). Among the culture-negative specimens, all but one (seven of eight) contained more than 70% Proteobacteria (Fig. 3C). Families with increased relative abundance among oral flora specimens included Prevotellaceae, Streptococcaceae, and Veillonellaceae (P < 0.05 for all). Table 3 lists the five most prominent OTUs detected via pyrosequencing according to culture results. Among prominent OTUs, Escherichia sp. (1087) and P. fluorescens (0969) were found in greater abundance among culture-negative specimens than among oral flora specimens (P < 0.001 and P < 0.05, respectively). These two Gammaproteobacteria OTUs comprised nearly 60% of all OTUs in this group and were responsible for the marked Proteobacteria dominance of the culture-negative group seen in Fig. 3C and Table 3. Thus, BAL fluid specimens with oral flora growth were, on average, comparable to specimens with no culture growth with regard to culture-independent indices of infection, but contained markedly divergent bacterial communities. Specifically, oral flora specimens contained greater abundances of bacteria typically detected in the pharynx, while specimens with no growth were markedly dominated by select Gammaproteobacteria, including Escherichia sp. and P. fluorescens (Table 3).
FIG 3.

Culture-independent analysis of BAL fluid specimens according to culture results. BAL fluid specimens were separated and analyzed according to their culture results: oral Flora only, no growth via culture, and bacterial species identified and reported. Specimens were compared for (A) bacterial DNA burden, (B) Shannon diversity index, and relative abundance of bacterial phyla for (C) Proteobacteria and (D) Bacteroidetes. Group means compared using unpaired ANOVA with Tukey's multiple-comparison test. NS, not significant; LOD, limit of detection.
TABLE 3.
Most abundant OTUs in BAL specimens separated by culture results
| Culture result (n) | Rank (mean overall relative abundance) | OTU | Specimens in which OTU was detected (no. [%]) | Relative abundance (when present) (mean ± SD) |
|---|---|---|---|---|
| Oral flora reported (19) | 1 | Prevotella sp. (1095) | 15 (78.9) | 26.9 ± 25.1 |
| 2 | Streptococcus sp. (1072) | 16 (84.2) | 13.8 ± 12.9 | |
| 3 | Pseudomonas fluorescens (0969) | 11 (57.9) | 19.7 ± 15.3 | |
| 4 | Veillonella sp. (1077) | 14 (73.7) | 11.6 ± 7.3 | |
| 5 | Escherichia sp. (1087) | 13 (68.4) | 10.6 ± 9.4 | |
| No growth (8) | 1 | Escherichia sp. (1087) | 8 (100.0) | 30.1 ± 26.2 |
| 2 | Pseudomonas fluorescens (0969) | 7 (87.5) | 30.8 ± 17.5 | |
| 3 | Bordetella sp. (1054) | 6 (75.0) | 9.1 ± 6.9 | |
| 4 | Pseudomonas sp. (0776) | 7 (87.5) | 6.2 ± 2.6 | |
| 5 | Aquabacterium sp. (0908) | 3 (37.5) | 11.2 ± 13.9 | |
| Species identified (17) | 1 | Pseudomonas aeruginosa (1053) | 9 (52.9) | 47.9 ± 39.2 |
| 2 | Staphylococcus sp. (1098) | 7 (41.2) | 30.8 ± 40.8 | |
| 3 | Stenotrophomonas sp. (1039) | 4 (23.5) | 44.5 ± 36.3 | |
| 4 | Bordetella sp. (1054) | 8 (47.1) | 18.5 ± 18.0 | |
| 5 | Escherichia sp. (1087) | 9 (52.9) | 11.3 ± 9.5 |
Can pyrosequencing identify cases of pneumonia missed by conventional culture techniques?
While our results confirmed that BAL fluid culture growth and species identification were strongly associated with evidence of acute infection (BAL fluid neutrophilia, high bacterial DNA burden, and low community diversity), implying that current culture-based techniques are effective in identifying instances of respiratory infection, we sought to determine whether pyrosequencing identified any cases of acute infection missed by conventional culture-based techniques.
Figure 4A is a case illustration of BAL fluid acquired from a patient with clinical evidence of pneumonia (cough, decreased lung function, and radiographic lung infiltrate), no culture growth via BAL fluid culture (including negative fungal, AFB, and viral testing), but overwhelming community dominance by Escherichia sp. (1087) demonstrated by pyrosequencing (“BAL 1”). Based on the lack of culture growth, the patient's clinicians did not initially treat him with antibiotics. After the patient received fluoroquinolone therapy for an unrelated indication, his respiratory symptoms improved. A subsequent BAL fluid specimen obtained 1 month later (performed for rejection surveillance) grew oral flora by culture, and pyrosequencing revealed near-eradication of Escherichia sp. (“BAL 2”). Even via culture-based studies, E. coli is among the more common etiologies of health care-associated pneumonia (19). Our findings raise the possibility that the prevalence of Escherichia sp. respiratory infections may be underappreciated.
FIG 4.

Case illustrations of the limitations of bacterial culture. (A) Two years after bilateral lung transplant for pulmonary fibrosis, a 52-year-old man developed cough and decreased lung function. Computed tomography (CT) scan revealed basilar ground-glass opacities. Bronchoscopy was performed (BAL 1). Bacterial culture revealed no bacterial growth, but subsequent analysis with pyrosequencing revealed overwhelming abundance of Escherichia sp. In following weeks, treatment with a fluoroquinolone for an unrelated indication resulted in improved respiratory symptoms. A repeat BAL fluid specimen obtained 1 month later (BAL 2) resulted in oral flora reported via culture; subsequent pyrosequencing revealing increased community diversity and near absence of Escherichia sp. (B) Five years after bilateral lung transplant for COPD, a 59-year-old woman developed dyspnea, cough, and sputum production. CT scan revealed multifocal infiltrates. Bronchoscopy revealed purulent secretions with a predominantly neutrophilic BAL fluid cell count, but culture results were reported only as oral flora. Subsequent analysis of the BAL fluid via pyrosequencing revealed overwhelming abundance of Corynebacterium sp., with low community diversity and high bacterial DNA burden.
Figure 4B is a case illustration of a separate patient with clinical evidence of pneumonia (dyspnea, sputum production, and radiographic lung infiltrate) whose BAL fluid culture results were reported exclusively as oral flora with no further identification to the species level; fungal, AFB, viral, and Pneumocystis studies were negative. Given these results, the patient's clinicians withheld antibiotic therapy. Our subsequent pyrosequencing analysis revealed extremely low community diversity and overwhelming abundance of Corynebacterium sp. Although Corynebacterium spp. are found among pharyngeal microbes, the extremely low community diversity shown by pyrosequencing in this case is inconsistent with that of an oral microbial community and instead represents an acute infectious state. Corynebacterium spp. are uncommon but well-documented causes of respiratory infection (20), and our findings raise the possibility that they and other pharynx-associated microbes may be underappreciated as respiratory pathogens due to occasional misdesignation as oral flora in respiratory cultures.
Thus, these two cases illustrate that pyrosequencing identifies cases of bacterial pneumonia missed or unappreciated by standard culture techniques, by both identification of an uncultured organism (as in the Escherichia sp.) and determining an overall change in bacterial community structure that can clarify whether a cultured species reflects contamination, normal colonization, or infection (as in the Corynebacterium sp.).
Do quantitative bacterial culture results correlate with culture-independent evidence of acute P. aeruginosa pneumonia?
The threshold of 104 CFU/ml is commonly applied to BAL fluid cultures to distinguish acute infection from colonization, but its utility is controversial (7). We designed an analysis to determine whether this threshold accurately discriminates between patients with and without culture-independent evidence of acute pneumonia (total bacterial DNA burden, low community diversity, and high relative abundance of the dominant OTU). We compared the six specimens that grew >104 CFU/ml P. aeruginosa with the three specimens that grew P. aeruginosa <104 CFU/ml and the eight specimens without any bacterial growth. Specimens above the 104 CFU/ml threshold had significantly higher amounts of bacterial DNA (P ≤ 0.01), lower community diversity (P ≤ 0.05), and greater relative abundance of P. aeruginosa (P ≤ 0.001) than specimens below the threshold (Fig. 5). By all of these indices, specimens below the 104 CFU/ml threshold were indistinguishable from specimens without bacterial growth via culture (P > 0.05). These data provide culture-independent support for the threshold value of 104 CFU/ml for use in the diagnosis of P. aeruginosa pneumonia.
FIG 5.
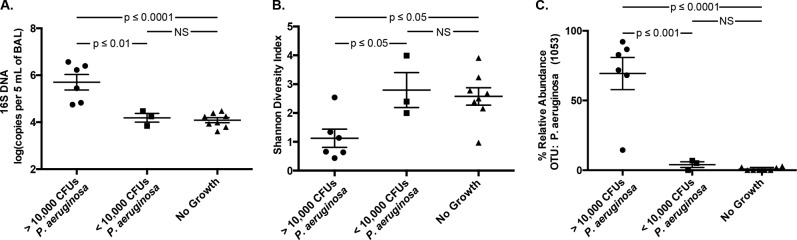
Culture-independent analysis of quantitative BAL fluid cultures. BAL fluid specimens were divided into three groups based upon quantitative culture results as follows: P. aeruginosa ≥104 CFU/ml, P. aeruginosa <104 CFU/ml, and no bacterial growth. Specimens were compared by (A) bacterial DNA burden, (B) Shannon diversity index, and (C) relative abundance of OTU 1053 (P. aeruginosa). Group means compared by unpaired ANOVA with Tukey's multiple-comparison test.
DISCUSSION
In this study, we used a culture-independent technique of bacterial identification, pyrosequencing of 16S rRNA amplicon libraries from metagenomic DNA samples, to systematically identify the strengths and limitations of current clinical microbiology techniques. While culture-independent pyrosequencing successfully identified bacterial communities in a greater percentage of specimens, conventional bacterial culture was largely successful in identifying the dominant microbe present in instances of acute infection, as confirmed via novel culture-independent indices of acute infection (high total bacterial DNA burden, low bacterial community diversity, and predominance of specific taxonomic groups). We did identify specific instances in which bacterial respiratory pathogens were not identified by culture, due either to a complete lack of bacterial growth (as with Escherichia sp.) or to misclassification of pathogen growth as oral flora (as with Corynebacterium sp.). These case illustrations demonstrate the potential utility of incorporating features of microbial community composition into the discrimination of acute infection from colonization, contamination, or apparent sterility. Finally, our analysis is the first to provide culture-independent support for the threshold value of 104 CFU/ml for use in the diagnosis of bacterial pneumonia.
This is the first culture-independent analysis of the quantitative BAL fluid culture approach for the diagnosis of pneumonia. Use of quantitative BAL fluid cultures is both widespread and controversial (7). A frequent criticism of quantitative BAL fluid cultures is the uncorrected dilution effect introduced by the variable amount of saline instilled and collected in the BAL fluid procedure and the unknown alveolar surface area lavaged. Our analysis of specimens with P. aeruginosa growth revealed that the total bacterial DNA detected in specimens above the 104 CFU/ml threshold is, on average, more than 30-fold greater than that detected in specimens with growth below the threshold, a difference far greater than would be expected given procedural variation in saline instillation and return. Moreover, variable dilution between BAL fluid samples should have no impact on the relative abundance of bacterial species within a community, and our results demonstrate that specimens with growth above the 104 CFU/ml threshold have decreased community diversity and higher predominance of the cultured organism by a factor of greater than 15. Our analysis focused on a limited number of specimens containing one pathogen (P. aeruginosa) in one clinical setting. We have provided a proof-of-principle analysis demonstrating how culture-independent findings can complement conventional culture-based techniques in the discrimination of infection from its absence. Future studies of quantitative BAL fluid cultures should consider incorporating culture-independent techniques into the reference standard of infection.
A surprising and novel observation in this study is the stark predominance of Gammaproteobacteria spp. among culture-negative BAL fluid specimens. Most notably, the combination of two OTUs, Escherichia sp. (1087) and P. fluorescens (0969), comprised the majority of bacteria detected in culture-negative specimens. Neither OTU was abundant in the pyrosequencing results of reagent and bronchoscope rinse control specimens, and these control specimens had significantly less bacterial 16S DNA than culture-negative specimens. Furthermore, these OTUs were rarely found in the healthy oral flora-positive samples or in samples from healthy non-transplant recipients, as we have previously reported (8). Thus, while we cannot comment on the viability of these bacteria, they are clearly not attributable to background contamination in low-biomass specimens. A previous study of BAL fluid specimens obtained from patients with ventilator-associated pneumonia similarly detected Escherichia sp. and P. fluorescens via a culture-independent approach but not via culture of the same specimen (5). These results raise the provocative hypothesis that the absence of culture growth, rather than indicating the absence of bacteria, may sometimes reflect the active inhibition of growth by prominent community members. P. fluorescens actively inhibits in vitro growth of organisms via production of numerous antimicrobial metabolites (21, 22), and in one reported study was cultured from specimens only after samples were dialyzed (23). Thus, culture negativity may reflect the presence of active culture inhibitors in the samples. Alternately, these results might reflect the adaptation of bacteria to a specific host niche that is not replicated by routine in vitro culture conditions. P. fluorescens and Escherichia spp. are both well documented to persist in a viable but not culturable state in the environment (24–26). We have previously observed that P. fluorescens and an Escherichia sp. exhibit a strongly positive association with each other (8), raising the possibility of indirect growth inhibition via co-occurrence of two species. As pyrosequencing identifies bacteria via DNA sequencing rather than reproduction, this technique alone is unable to discriminate viable from nonviable community members.
Our studies reflected the standard practices of a clinical microbiological laboratory and did not use exhaustive culture techniques for the identification of bacteria. The detection of bacteria via BAL fluid culture in our study most certainly might have been increased using alternate media and culture conditions, but the objective of our study was to investigate the question through the use of BAL fluid culture protocols as currently practiced. We believe that this context and the comparison are of greater relevance to practicing microbiologists and clinicians. Next-generation sequencing platforms are, in their current versions, too expensive, impractical, and unvalidated for use in clinical microbiology laboratories, but they do offer a means of investigating, in a targeted and rational manner, potential specific improvements in our current culture-based protocols as well as development of potential culture-independent diagnostic adjuncts. Finally, our BAL fluid specimens were obtained from a limited number of lung transplant recipients; the generalizability of our findings should be explored in subsequent studies utilizing BAL fluid acquired patients in other disease states.
Supplementary Material
ACKNOWLEDGMENTS
Funding was provided by NIH (grants T32HL00774921 [to R.P.D. and H.C.P.], U01HL098961 [to J.L.C. and G.B.H.], R01HL094622 [to V.N.L.], and R01HL114447 [to G.B.H. and F.J.M.]) and the Biomedical Laboratory and Clinical Science Research & Development Services, Department of Veterans Affairs (to J.L.C.). Support was provided by the Host Microbiome Initiative of the University of Michigan.
We thank Natalie Walker, Zachary Britt, Nicole Falkowski, Dayana Rojas, and Brittan Scales for assistance in tissue processing. We thank Rick Bushman and his lab at the University of Pennsylvania for providing the 16S qPCR protocol and Duane Newton for providing information regarding UM Clinical Microbiology Laboratory protocols.
Footnotes
Published ahead of print 30 July 2014
Supplemental material for this article may be found at http://dx.doi.org/10.1128/JCM.01028-14.
REFERENCES
- 1.Hoyert DL, Xu J. 2012. Deaths: preliminary data for 2011. Natl. Vital Stat. Rep. 61:1–65 [PubMed] [Google Scholar]
- 2.Mizgerd JP. 2006. Lung infection—a public health priority. PLoS Med. 3:e76. 10.1371/journal.pmed.0030076 [DOI] [PMC free article] [PubMed] [Google Scholar]
- 3.Murdoch DR, O'Brien KL, Scott JA, Karron RA, Bhat N, Driscoll AJ, Knoll MD, Levine OS. 2009. Breathing new life into pneumonia diagnostics. J. Clin. Microbiol. 47:3405–3408. 10.1128/JCM.01685-09 [DOI] [PMC free article] [PubMed] [Google Scholar]
- 4.Dickson RP, Erb-Downward JR, Huffnagle GB. 2013. The role of the bacterial microbiome in lung disease. Expert Rev. Respir. Med. 7:245–257. 10.1586/ers.13.24 [DOI] [PMC free article] [PubMed] [Google Scholar]
- 5.Bahrani-Mougeot FK, Paster BJ, Coleman S, Barbuto S, Brennan MT, Noll J, Kennedy T, Fox PC, Lockhart PB. 2007. Molecular analysis of oral and respiratory bacterial species associated with ventilator-associated pneumonia. J. Clin. Microbiol. 45:1588–1593. 10.1128/JCM.01963-06 [DOI] [PMC free article] [PubMed] [Google Scholar]
- 6.Iwai S, Fei M, Huang D, Fong S, Subramanian A, Grieco K, Lynch SV, Huang L. 2012. Oral and airway microbiota in HIV-infected pneumonia patients. J. Clin. Microbiol. 50:2995–3002. 10.1128/JCM.00278-12 [DOI] [PMC free article] [PubMed] [Google Scholar]
- 7.Baselski V, Klutts JS, Baselski V, Klutts JS. 2013. Quantitative cultures of bronchoscopically obtained specimens should be performed for optimal management of ventilator-associated pneumonia. J. Clin. Microbiol. 51:740–744. 10.1128/JCM.03383-12 [DOI] [PMC free article] [PubMed] [Google Scholar]
- 8.Dickson RP, Erb-Downward JR, Freeman CM, Walker N, Scales BS, Beck JM, Martinez FJ, Curtis JL, Lama VN, Huffnagle GB. 2014. Changes in the lung microbiome following lung transplantation include the emergence of two distinct pseudomonas species with distinct clinical associations. PLoS One 9:e97214. 10.1371/journal.pone.0097214 [DOI] [PMC free article] [PubMed] [Google Scholar]
- 9.The Human Microbiome Project Consortium. 2012. Structure, function and diversity of the healthy human microbiome. Nature 486:207–214. 10.1038/nature11234 [DOI] [PMC free article] [PubMed] [Google Scholar]
- 10.Mason KL, Erb Downward JR, Mason KD, Falkowski NR, Eaton KA, Kao JY, Young VB, Huffnagle GB. 2012. Candida albicans and bacterial microbiota interactions in the cecum during recolonization following broad-spectrum antibiotic therapy. Infect. Immun. 80:3371–3380. 10.1128/IAI.00449-12 [DOI] [PMC free article] [PubMed] [Google Scholar]
- 11.Charlson ES, Bittinger K, Haas AR, Fitzgerald AS, Frank I, Yadav A, Bushman FD, Collman RG. 2011. Topographical continuity of bacterial populations in the healthy human respiratory tract. Am. J. Respir. Crit. Care Med. 184:957–963. 10.1164/rccm.201104-0655OC [DOI] [PMC free article] [PubMed] [Google Scholar]
- 12.Hill DA, Hoffmann C, Abt MC, Du Y, Kobuley D, Kirn TJ, Bushman FD, Artis D. 2010. Metagenomic analyses reveal antibiotic-induced temporal and spatial changes in intestinal microbiota with associated alterations in immune cell homeostasis. Mucosal Immunol. 3:148–158. 10.1038/mi.2009.132 [DOI] [PMC free article] [PubMed] [Google Scholar]
- 13.Wilmotte A, Van der Auwera G, De Wachter R. 1993. Structure of the 16 S ribosomal RNA of the thermophilic cyanobacterium Chlorogloeopsis HTF (‘Mastigocladus laminosus HTF’) strain PCC7518, and phylogenetic analysis. FEBS Lett. 317:96–100. 10.1016/0014-5793(93)81499-P [DOI] [PubMed] [Google Scholar]
- 14.Don R, Cox P, Wainwright B, Baker K, Mattick J. 1991. “Touchdown” PCR to circumvent spurious priming during gene amplification. Nucleic Acids Res. 19:4008. 10.1093/nar/19.14.4008 [DOI] [PMC free article] [PubMed] [Google Scholar]
- 15.Daigle D, Simen BB, Pochart P. 2011. High-throughput sequencing of PCR products tagged with universal primers using 454 Life Sciences systems. Curr. Protoc. Mol. Biol. Chapter 7:Unit 7.5. 10.1002/0471142727.mb0705s96 [DOI] [PubMed] [Google Scholar]
- 16.Schloss PD, Westcott SL, Ryabin T, Hall JR, Hartmann M, Hollister EB, Lesniewski RA, Oakley BB, Parks DH, Robinson CJ, Sahl JW, Stres B, Thallinger GG, Van Horn DJ, Weber CF. 2009. Introducing mothur: open-source, platform-independent, community-supported software for describing and comparing microbial communities. Appl. Environ. Microbiol. 75:7537–7541. 10.1128/AEM.01541-09 [DOI] [PMC free article] [PubMed] [Google Scholar]
- 17.Core Team R. 2013. R: a language and environment for statistical computing. R Foundation for Statistical Computing, Vienna, Austria [Google Scholar]
- 18.Oksanen J, Blanchet FG, Kindt R, Legendre P, Minchin PR, O'Hara RB, Simpson GL, Solymos P, Stevens MHH, Wagner H. 2013. vegan: community ecology package, vol R package version 2.0-9. Creative Commons, San Francisco, CA [Google Scholar]
- 19.Jones RN. 2010. Microbial etiologies of hospital-acquired bacterial pneumonia and ventilator-associated bacterial pneumonia. Clin. Infect. Dis. 51(Suppl 1):S81–S87. 10.1086/653053 [DOI] [PubMed] [Google Scholar]
- 20.Diez-Aguilar M, Ruiz-Garbajosa P, Fernandez-Olmos A, Guisado P, Del Campo R, Quereda C, Canton R, Meseguer MA. 2013. Non-diphtheriae Corynebacterium species: an emerging respiratory pathogen. Eur. J. Clin. Microbiol. Infect. Dis. 32:769–772. 10.1007/s10096-012-1805-5 [DOI] [PubMed] [Google Scholar]
- 21.Baader A, Garre C. 1887. Über antagonisten unter den bacterien. Correspondenz-Blatt für Schweizer Ärzte 13:385–392 [Google Scholar]
- 22.Gross H, Loper JE. 2009. Genomics of secondary metabolite production by Pseudomonas spp. Nat. Prod. Rep. 26:1408–1446. 10.1039/b817075b [DOI] [PubMed] [Google Scholar]
- 23.Bernstein DI, Lummus ZL, Santilli G, Siskosky J, Bernstein IL. 1995. Machine operator's lung. A hypersensitivity pneumonitis disorder associated with exposure to metalworking fluid aerosols. Chest 108:636–641 [DOI] [PubMed] [Google Scholar]
- 24.Lowder M, Unge A, Maraha N, Jansson JK, Swiggett J, Oliver JD. 2000. Effect of starvation and the viable-but-nonculturable state on green fluorescent protein (GFP) fluorescence in GFP-tagged Pseudomonas fluorescens A506. Appl. Environ. Microbiol. 66:3160–3165. 10.1128/AEM.66.8.3160-3165.2000 [DOI] [PMC free article] [PubMed] [Google Scholar]
- 25.Oliver JD. 2005. The viable but nonculturable state in bacteria. J. Microbiol. 43(Spec No):93–100 [PubMed] [Google Scholar]
- 26.Pommepuy M, Butin M, Derrien A, Gourmelon M, Colwell RR, Cormier M. 1996. Retention of enteropathogenicity by viable but nonculturable Escherichia coli exposed to seawater and sunlight. Appl. Environ. Microbiol. 62:4621–4626 [DOI] [PMC free article] [PubMed] [Google Scholar]
Associated Data
This section collects any data citations, data availability statements, or supplementary materials included in this article.