

Abstract
Stationary-phase bacteria are important in disease. The σs-regulated general stress response helps them become resistant to disinfectants, but the role of σs in bacterial antibiotic resistance has not been elucidated. Loss of σs rendered stationary-phase Escherichia coli more sensitive to the bactericidal antibiotic gentamicin (Gm), and proteomic analysis suggested involvement of a weakened antioxidant defense. Use of the psfiA genetic reporter, 3′-(p-hydroxyphenyl) fluorescein (HPF) dye, and Amplex Red showed that Gm generated more reactive oxygen species (ROS) in the mutant. HPF measurements can be distorted by cell elongation, but Gm did not affect stationary-phase cell dimensions. Coadministration of the antioxidant N-acetyl cysteine (NAC) decreased drug lethality particularly in the mutant, as did Gm treatment under anaerobic conditions that prevent ROS formation. Greater oxidative stress, due to insufficient quenching of endogenous ROS and/or respiration-linked electron leakage, therefore contributed to the greater sensitivity of the mutant; infection by a uropathogenic strain in mice showed this to be the case also in vivo. Disruption of antioxidant defense by eliminating the quencher proteins, SodA/SodB and KatE/SodA, or the pentose phosphate pathway proteins, Zwf/Gnd and TalA, which provide NADPH for ROS decomposition, also generated greater oxidative stress and killing by Gm. Thus, besides its established mode of action, Gm also kills stationary-phase bacteria by generating oxidative stress, and targeting the antioxidant defense of E. coli can enhance its efficacy. Relevant aspects of the current controversy on the role of ROS in killing by bactericidal drugs of exponential-phase bacteria, which represent a different physiological state, are discussed.
INTRODUCTION
Stationary-phase bacteria play critical roles in disease causation (1–4). Due to a dearth of nutrients and/or other factors, bacteria in the host often experience this late growth phase (5–8), and it is in this phase that many of their virulence traits are primarily expressed (9–11). For example, in pathogenic strains of Escherichia coli, the csgBA genes, encoding curli which mediate host invasion (12), and the fim genes, encoding type I fimbriae which are involved in bladder colonization, are expressed in stationary phase (13, 14). Stationary-phase bacteria become highly resistant to disinfectants, are difficult to eradicate, and play a key role in the heightened resistance of bacterial biofilms (15, 16); it is therefore important to explore means for their control (17, 18).
The bacterial general stress response (GSR), regulated by σS (product of the rpoS gene), is activated in the stationary phase of E. coli bacteria (7, 8, 19) and is responsible for their high degree of resistance, which is due to the expression of a core set of proteins that protect vital cell biomolecules, i.e., proteins, DNA, and the cell envelope (7, 8, 20). Since bactericidal antibiotics exert their toxic effects in bacteria by damaging these molecules, we along with others postulated that σS is likely to have a role in protecting bacteria against these drugs as well, and it has been shown that constitutive expression of rpoS can minimize antibiotic sensitivity in a multidrug-resistant strain of E. coli and that an rpoS mutant of Pseudomonas aeruginosa becomes more sensitive to carbapenems in stationary phase (8, 21). However, the mechanistic basis of this role has as yet remained unexplored.
We have discovered that in stationary-phase E. coli, the loss of σS does indeed result in rendering the bacterium markedly more sensitive to three bactericidal antibiotics that target different macromolecules: gentamicin ([Gm] ribosomes), ampicillin (peptidoglycan), and ciprofloxacin (DNA). Here, we present in-depth analysis of the biochemical basis that renders the ΔrpoS mutant sensitive to Gm; a future report will deal with the other two antibiotics. We show that the efficacy of Gm in killing stationary-phase E. coli is enhanced by the absence of not only σS but also of several σS-dependent proteins of antioxidant defense, that this loss leads to higher levels of reactive oxygen species (ROS) and oxidative stress upon Gm treatment, and that the antioxidant defense contributes to Gm resistance of E. coli also in vivo. In identifying new targets for enhancing the effectiveness of a widely used antibiotic, we address the worldwide public health threat posed by the increasing bacterial antibiotic resistance (22, 23).
σs has been implicated in resistance of stationary-phase E. coli to bacteriostatic drugs by Kolodkin-Gal and Engelberg-Kulka but only in strains also missing the MazEF toxin-antitoxin system (24), which is not the case with the mechanism reported here. The MazF toxin was implicated as being responsible for the killing, but whether this toxin actually kills bacteria is controversial (25). Regardless, their studies dealt with a different class of antibiotics.
There is currently a strong controversy concerning the role of oxidative stress in the toxicity of bactericidal drugs in exponential-phase E. coli (26–29). The stationary-phase bacteria differ from their exponential-phase counterparts not only as regards the σs-mediated changes noted above but also in other respects (30–32). Thus, as stationary-phase bacteria represent a physiological state very different from exponential-phase cells, this controversy is not germane to this study and is noted only in relevant contexts.
MATERIALS AND METHODS
Bacterial strains and experimental design.
The E. coli K-12 BW25113 strain and several of its isogenic gene knockout mutants from the Keio collection (33) were used, as well as our clinical isolate of uropathogenic E. coli (UPEC strain AMG1) (34); its isogenic ΔrpoS mutant and double mutants of the Keio strain were generated as described previously (35). The knockouts were confirmed by PCR. To construct strains bearing a single copy of an sfiA-lacZ fusion to monitor oxidative stress intracellularly, bacteria were transfected with the sfiA-lacZ fusion cassette from the E. coli SY2 strain by P1vir (Coli Genetic Stock Center [CGSC], Yale University) transduction according to established protocols (36). Activation of the sfiA promoter (psfiA) was measured using a chlorophenol red-β-d-galactopyranoside (CPRG) β-galactosidase assay kit (G-Biosciences, St. Louis, MO) according to the manufacturer's protocol with modifications in the cell lysis procedure for bacteria (37). β-Galactosidase activity was normalized to the CFU/ml value.
Bacteria were grown overnight to late stationary phase at 37°C in Luria-Bertani (LB) broth with shaking (200 rpm); the following morning, they were diluted to an A600 of 0.45 (1.3 × 10⁹ cells/ml) in M9 minimal medium without glucose (34, 35) (referred to as M9 salts). Gm was added at 16 μg/ml; parallel controls were run without the drug. This drug concentration was chosen because in the experimental period, it had minimal effect on the viability of the wild type and clearly revealed the effect of various mutations on drug sensitivity. Gm at 16 μg/ml represents the MIC for resistant (R) Gram-negative bacteria. (Gm MICs for intermediate [I] and sensitive [S] strains are 8 and 4 μg/ml, respectively.) MIC values are determined for growing bacteria and represent concentrations that inhibit growth; in contrast, our work concerns stationary-phase bacteria, which are well known to be more resistant, and deals with bactericidal effects, which occur at higher concentrations than the MIC values (38). The suspensions were incubated aerobically at 37°C for 24 h without shaking (unless otherwise indicated). Samples were drawn at specified times (as indicated in the text and in Table S1 in the supplemental material), serially diluted in M9 salts, and cultured on LB agar to determine CFU counts. For determining drug sensitivity under anoxic conditions, cell suspensions were incubated anaerobically in a GasPak EZ gas kit (Becton Dickinson, Sparks, MD).
In vivo studies in mice, conducted according to Stanford University protocols, were done as described previously (39). Seven-week-old CBA/J mice (Jackson Laboratories, Bar Harbor, ME) were acclimated to our animal facility for 1 week prior to the experiments. Transurethral inoculation of 107 CFU/50 μl/mouse was performed using wild-type UPEC AMG1 or its isogenic ΔrpoS mutant. LB-grown cultures of the two strains were diluted to 107 CFU/50 μl using phosphate-buffered saline (PBS). Mice were anesthetized with inhaled isoflurane, and their perinea were cleaned with 70% ethanol. To ensure that mouse bladders did not overflow during transurethral inoculation and to reduce urine output, the animals were deprived of water for 30 min prior to anesthesia administration and encouraged to void by scruffing and gentle pressure on the lower abdomen. Using PE10 polyethylene tubing-covered 30-gauge needles (BD Biosciences, San Jose, CA), the mice were transurethrally catheterized, and the inoculum was injected over 5 s. Immediately thereafter, mice were administered PBS alone or PBS with 50, 5, or 0.5 μg of Gm by subcutaneous injection, followed by four more doses every 2 h (total of five doses). Two days after infection, the animals were sacrificed by a combination of isoflurane overdose and cervical dislocation. Mouse bladders were removed aseptically and homogenized using sterile 1.6-mm stainless steel beads and a Bullet Blender homogenizer (Next Advance, Averill Park, NY). Suitably diluted samples of the bladder homogenate were used in CFU determinations on MacConkey agar.
Proteomic analysis.
Two-dimensional gel electrophoresis (2D-DiGE) was performed by Applied Biomics, Hayward, CA. Cells were grown and treated with Gm (48 h) as for viability determination. Frozen cell pellets were supplied to Applied Biomics. The company's protein extraction procedure entails use of 2D lysis buffer [7 M urea, 2 M thiourea, 4% CHAPS (3-[(3-cholamidopropyl)-dimethylammonio]-1-propanesulfonate), 30 mM Tris-HCl, pH 8.8]. Equal amounts of samples of Gm-treated or untreated cells were labeled by CyDye Difference in DiGE fluorophores (size and charge matched). Isoelectric focusing was used in the first dimension, and SDS-polyacrylamide gel electrophoresis was used in the second. The gels were scanned using a Typhoon image scanner to reveal CyDye signals. ImageQuant software was used to generate single and overlay images, which were then subjected to DeCyder software analysis to determine differentially expressed protein spots. An Ettan Spot Picker was used to pick spots of interest, which were subsequently identified by tandem mass spectrometry (MS/MS) (protein or total ion confidence interval of 95% or higher). Only protein spots exhibiting >1.4-fold change under at least one of the conditions (e.g., treated/untreated wild type or the mutant) are included in Table 1.
TABLE 1.
Effect of gentamicin treatment on rpoS-regulated proteins in stationary-phase E. coli
| Protein group and name | Function [reference(s)] | Relative fold change in expression in:a |
|||
|---|---|---|---|---|---|
| ΔrpoS mutant vs wild type | Wild type + Gm vs wild type w/o Gm | ΔrpoS mutant + Gm vs ΔrpoS mutant w/o Gm | ΔrpoS mutant + Gm vs wild type + Gm | ||
| Antioxidative and other antistress proteins | |||||
| Hydroperoxidase HPII (catalase) (KatE) | Decomposes H2O2 (48) | −2.39 | 1.27 | 1.78 | −1.70 |
| Superoxide dismutase A and B | Converts superoxide into oxygen and hydrogen peroxide (48) | −2.0 | 1.42 | −1.11 | −3.14 |
| Starvation protein Dps (PexB) | Protects DNA against oxidative stress (87) | 1.44 | −1.08 | −1.46 | 1.06 |
| Dihydrolipoamide dehydrogenase (DLD) | L protein of glycine cleavage system; glycine can cause lipid oxidative damage (88, 89) | 1.65 | 2.15 | −1.51 | −1.96 |
| Glycine cleavage system protein H (GcvH) | Along with dihydrolipoamide dehydrogenase (DLD) cleaves glycine (89, 90) | 40.76 | 4.39 | 2.45 | −79.95 |
| Alkyl hydroperoxide reductase subunit C (AhpC) | Reduces organic peroxides (91, 92) | −1.65 | 1.44 | −1.06 | −2.52 |
| dITP/XTP pyrophosphatase (RdgB) | Removes the toxic nucleotides resulting from oxidative stress (93) | 1.19 | 1.41 | −1.14 | −1.35 |
| Bacterioferritin (Bfr) | Iron-storage proteins; prevents Fenton reaction (94) | 1.98 | −1.83 | −1.32 | 2.75 |
| Ferritin-1 (FtnA) | Iron storage proteins; prevents Fenton reaction (94, 95) | −1.61 | −1.34 | 3.34 | 2.79 |
| Molybdopterin biosynthesis, protein B (MoaB) | Synthesizes antioxidant molybdopterin (96, 97) | −4.69 | 1.59 | 1.16 | −6.41 |
| Osmotically induced protein (OsmC) | Reduce peroxides (98) | −6.86 | 1.45 | 1.14 | −8.77 |
| Serine kinase family protein (HipA) | Oxidative response proteins; likely signals oxidative stress (99, 100) | −8.44 | −2.58 | 2.73 | −4.90 |
| Glutamate decarboxylase α (Gad) | Required for oxidative and acidic stress tolerance (101) | −21.86 | 2.16 | 2.93 | −16.12 |
| Tryptophanase (TnaA) | Synthesizes the antioxidant indole (102) | 1.65 | 2.52 | -0.52 | 0.70 |
| Phage shock protein (PspA) | Counter cell membrane damage from oxidative and other stresses (103) | 1.91 | −1.04 | −2.03 | −1.02 |
| Universal stress protein G (UspG) | Protects against oxidative and other stresses (104) | 1.12 | 1.47 | 2.13 | 1.62 |
| Universal stress protein F (UspF) | Protects against oxidative and other stresses (104) | 1.69 | −1.26 | −1.53 | 0.16 |
| Transketolase (TktB) | PPP enzyme: converts d-xylulose-5-P + d-ribose-5-P into sedoheptulose-7-P + glyceraldehyde-3-P (48) | −34.34 | 3.35 | −6.72 | −74.76 |
| Transaldolase A (TalA) | PPP enzyme: converts sedoheptulose 7-phosphate + glyceraldehyde 3-phosphate into erythrose 4-phosphate + fructose 6-phosphate (48) | −92.89 | −0.11 | 1.71 | −33.38 |
| UTP-glucose-1-phosphate uridylyltransferase (GalU) | Catalyzes UDP-glucose formation for stress adaptation (105) | −2.61 | −1.09 | −1.45 | −3.45 |
| Class II aldolase, tagatose bisphosphate family (KbaY/GatY) | Acid stress response protein (106) | 4.8 | 1.44 | −1.03 | 3.24 |
| d-Tagatose 1,6-bisphosphate aldolase 2 (KbaY/GatY) | Acid stress response protein (106) | 2.76 | −1.44 | −1.31 | 3.04 |
| Two-component system response regulator (PhoQ) | Component of PhoP/PhoQ system; controls stress responses and virulence (107) | −1.22 | −1.43 | 1.09 | 1.28 |
| Acyl carrier protein (AcpP) | Likely involved in SpoT-dependent stress response (108, 109) | −1.93 | 1.21 | 1.53 | −1.53 |
| Chain A, Apo acyl carrier protein (AcpP) | Likely involved in SpoT-dependent stress response (108, 109) | −1.59 | 1.63 | 1.1 | −2.36 |
| Other proteins | |||||
| Pyruvate dehydrogenase (PDH) | Converts pyruvate into acetyl-CoA (48) | −21.14 | 0.05 | -1.61 | −35.62 |
| Chain A Pyruvate Dehydrogenase (PDH) | Converts pyruvate into acetyl-CoA (48) | 1.06 | −1.45 | 1.26 | 1.27 |
| Fumarate reductase flavoprotein subunit (FrdA) | Krebs cycle enzyme: catalyzes fumarate and succinate interconversion (48) | −2.25 | 1.15 | −1.52 | −3.93 |
| Malate dehydrogenase (Mdh) | Krebs cycle enzyme: catalyzes oxidation of malate to oxaloacetate (48) | 1.64 | 1.69 | −1.17 | 1.64 |
| Histidinol dehydrogenase (HisD) | Generates l-histidine from l-histidinol (48) | 1.19 | 1.36 | −1.76 | −2.02 |
| Erythronate-4-phosphate dehydrogenase (PdxB) | De novo synthesis of vitamin B6 (110) | −1.59 | −1.49 | 1.00 | −1.06 |
| Soluble pyridine nucleotide transhydrogenase (STH) | Catalyzes hydride transfer between NAD(H) and NADP(H) (111) | 1.11 | 1.25 | −1.63 | −1.84 |
| Methionyl-tRNA synthetase (MetG) | Protein synthesis (48) | 1.2 | 1.55 | −1.23 | −1.59 |
| Translation elongation factor EF-Tu (EF-Tu) | Protein synthesis (48) | −2.03 | 1.43 | 1.26 | −2.31 |
| Chain K, Ternary Complex-bound E. Coli 70s Ribosome | Protein synthesis (48) | −2.71 | 1.61 | −1.07 | −4.69 |
| Ribosomal protein S6 (RpsF) | Protein synthesis (48) | 1.44 | 1.48 | −1.06 | −1.09 |
| UDP-galactopyranose mutase (UDP-Galf) | Generates UDP-d-galactofuranose (105, 112) | 1.78 | 1.63 | 1.36 | 1.48 |
| Predicted enzyme | Unknown (113, 114) | 1.69 | 1.34 | −2.2 | −1.74 |
| Conserved hypothetical protein | Unknown (113, 114) | −2.19 | 1.15 | −1.44 | −3.63 |
| Chain A, Molybdate transport protein (ModA) | Molybdate transport (113, 114) | −5.18 | −1.03 | 1.43 | −3.53 |
| Predicted enzyme, YhbW | Unknown (113, 114) | 1.69 | 1.34 | −2.2 | −1.74 |
| Stress-induced protein, ATP-binding protein (UspF) | Unknown (113, 114) | 1.69 | −1.26 | −1.53 | 1.39 |
Plus and minus signs indicate up- and downregulation, respectively, of the first strain named in each comparison relative to the second strain. Thus, for the comparison of the ΔrpoS mutant versus the wild type, a negative number means that the concentration of the protein was lower in the mutant by the fold indicated. Where indicated, Gm was added at 16 μg/ml (+ Gm). Boldface indicates proteins that were upregulated in the wild type by Gm treatment compared to the mutant. Underlining indicates proteins that were downregulated in the mutant compared to the wild type upon Gm treatment. w/o, without.
ROS determination.
To measure ROS by 3′-(p-hydroxyphenyl) fluorescein (HPF) (490-nm excitation and 515-nm emission; Invitrogen, Carlsbad, CA), suitably diluted stock solution of the dye with or without the antibiotic was added to cell suspensions (final HPF concentration, 5 μM) and incubated in the dark at 37°C. After 48 h, samples were vortexed, washed in ice-cold M9 salts, redissolved in 1/10 volume of M9 salts, and loaded in a 96-well black plate (Corning Costar, Tewksbury, MA). Fluorescence was measured in a Gemini SpectraMax fluorescent plate reader (Molecular Devices, Sunnyvale, CA). Controls without HPF were used to correct for background fluorescence. See the Results section for further information.
To measure H2O2, an Amplex Red hydrogen peroxide assay kit (Molecular Probes, Inc., Eugene, OR) was used according to the manufacturer's protocol. Cell suspensions in the presence of Amplex Red reagents with or without Gm were loaded onto a black 96-well plate as described above. The samples were incubated at 37°C in a light shield enclosure. Fluorescence (excitation, 560; emission, 590 nm) of the suspension was measured at 2, 4, and 6 h.
Visualization of cell dimensions.
Antibiotic-treated and untreated cell suspensions were pelleted by centrifugation, washed in PBS, and resuspended in 1/10 volume of ice-cold PBS. Five microliters of the samples was spotted on glass slides and allowed to air dry in a flow hood, followed by an overlay of the mounting medium (SouthernBiotech, Birmingham, AL). A glass coverslip was placed on the samples, and its edges were sealed with nail polish. Differential interference contrast (DIC) images were visualized in a Zeiss AxioImager DIC microscope (Stanford Neuroscience Microscopy Service) at magnification settings of ×63, ×1.6, and ×10 (objective, Optovar, and eyepiece, respectively) and captured by an AxioCam HRm Rev 3 camera.
NADP/NADPH ratio determination.
NADP and NADPH levels were measured using a Fluoro NADP/NADPH Detection Kit (Cell Technology, Inc., Mountain View, CA). The cultures were prepared as described for antibiotic treatment. After incubation with gentamicin, NADP and NADPH were extracted according to the manufacturer's instructions; cells not treated with the drug were used as controls. A nonfluorescent reagent becomes reduced in the presence of NADPH to form NADP and a fluorescent analog. NADP is converted back to NADPH via an enzyme-coupled reaction, and the reaction proceeds back to the first step. Fluorescence was measured using a SpectraMax fluorescence plate reader (550-nm excitation; 595-nm emission). The protein concentration of each sample was determined after the fluorescence measurement for normalization.
Protein carbonylation.
Protein carbonylation was done as described before (40). Cells were pelleted by centrifugation, the pellets were suspended in lysis buffer (150 μl; 200 mM sodium phosphate, pH 6.5, 1% SDS), vortexed, and boiled (5 min); protein concentrations were determined using a Bio-Rad detergent-compatible (DC) protein assay kit (Bio-Rad, Hercules, CA) and adjusted to 100 μg/ml. Samples were derivatized by the addition of 1 volume of 12% SDS, followed by 2 volumes of 20 mM 2,4-dinitrophenylhydrazine, mixed, and incubated at room temperature (30 min). Derivatization was stopped by the addition of 1.5 volumes of 2 M Tris in 30% glycerol. Samples were loaded onto a slot blot apparatus (Bio-Rad, Hercules, CA) and vacuum transferred onto a nitrocellulose membrane according to the manufacturer's protocol. The membrane was blocked using 5% milk in Tris-buffered saline, pH 7.4, plus 0.5% Tween 20 (TBST) at 4°C overnight, followed by incubation (1 h) with rabbit anti-dinitrophenol antibody (1:500; Abcam, Cambridge, MA). The membrane was washed with TBST and incubated with mouse anti-rabbit IgG conjugated with horseradish peroxidase (at 1:2,000 for 1 h) (Cell Signaling Technologies, Danvers, MA). Bands were visualized using Kodak BioMax chemiluminescent film (Sigma-Aldrich, St. Louis, MO) after incubation of the membrane with an ECL kit (Thermo Fisher Scientific, Rockford, IL). Band intensity on the exposed film was quantified by ImageJ software (NIH).
alamarBlue reduction.
Membrane fractions of cell extracts were prepared as described previously (41). Cells were grown overnight as described above and harvested by centrifugation (4,200 × g for 30 min at 4°C). The cell pellet was washed with ice-cold 6 mM potassium phosphate buffer (pH 7.0), resuspended in buffer of the same composition to an A600 of 75, and broken in a French press (20,000 lb/in2). Cell debris was removed by a low spin (11,000 × g for 50 min at 4°C). The supernatant was ultracentrifuged (165,000 × g for 1 h at 4°C) to pellet the membrane fraction, which was suspended in potassium phosphate buffer (6 mM, pH 7.0), and protein concentration was determined (Bradford method). The reaction mixture for alamarBlue (AB) reduction (250 μl) contained 100 μg of the membrane fraction protein, 10% AB, 0.1 μmol of NADH, 6 mM potassium phosphate buffer (pH 7.0), and rotenone (1 μM; Sigma-Aldrich, St. Louis, MO) with or without Gm. The mixtures were incubated at 37°C in the dark for 20 min, followed by measurement of fluorescence (560-nm excitation and 590-nm emission wavelengths). Controls were devoid of cell extracts and generated no change in AB fluorescence.
Statistical analyses.
All experiments were done at least in triplicate. Statistical analyses were carried out by Student's t test.
RESULTS
Gm treatment is more lethal to, and causes greater oxidative stress in, the rpoS mutant of E. coli.
Results presented throughout this paper refer to stationary-phase cells. As stated in the previous section, to determine viability, 16 μg/ml Gm was added to cell suspensions in M9 salts (without glucose) (34, 35, 42), and cells were incubated aerobically, followed by counting the CFU. (As stated in Materials and Methods, this drug concentration had minimal effect on the viability of the wild type and thus clearly revealed the drug's differential effects in the mutants.) Deletion of the rpoS gene (absence of σs) rendered E. coli (K-12 BW25113) (33) more sensitive to Gm: at 24 h of treatment, mutant survival was more than 2 logs less than that of the wild type (Fig. 1). As noted in the introduction, σs regulates GSR, which protects against diverse stresses (5–8), and since protein synthesis continued in the Gm-treated cells, we conducted proteomic analysis to attempt to determine the identity of the σs-controlled stress involved in protection against Gm. As expected (43), the loss of σs altered the level of several proteins (Table 1, control strains, ΔrpoS mutant versus wild type; see also Fig. S1 in the supplemental material). Gm affected these proteins differently in the wild type (Table 1, wild type with Gm versus wild type without Gm) and the mutant (Table 1, ΔrpoS mutant with Gm versus ΔrpoS mutant without Gm), with a large majority (in boldface) being upregulated in the wild type compared to the mutant, indicating that the former is more competent at activating the stress response upon Gm treatment. Furthermore, the data in Table 1 showing the differential effect of Gm treatment on the mutant compared to the wild type (Table 1, ΔrpoS mutant with Gm versus wild type with Gm) indicate that, among the proteins showing greater downregulation in the mutant, over 10 concerned antioxidant defense (underlined). We therefore examined if Gm treatment generated greater oxidative stress in the rpoS strain than in the wild type.
FIG 1.
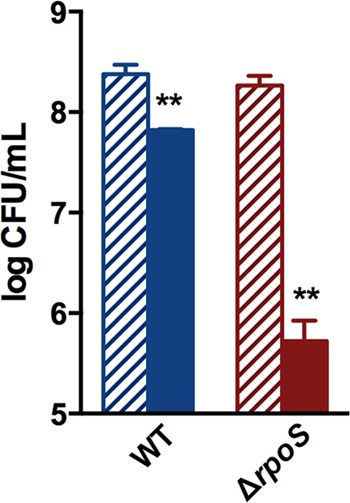
The ΔrpoS mutant of E. coli is more sensitive to Gm than the wild type (WT). Data presented here and subsequently are for stationary-phase cells. E. coli K-12, strain BW25113 was used, except where otherwise indicated. Gm was used at a concentration of 16 μg/ml with incubation at 37°C. Solid bars show mean log CFU counts per ml after Gm treatment for 24 h; striped bars represent untreated controls. The Student t test comparison is between drug-treated and untreated cells of the same strain. **, P < 0.01.
Oxidative stress activates the bacterial SOS response, and this activation can be detected by the induction of the SOS-regulated promoter of the sfiA gene (psfiA) (44, 45). psfiA activation thus provides a means of detecting oxidative stress within the cell and can be monitored by the use of an sfiA-lacZ transcriptional fusion. We measured β-galactosidase activity in untreated controls and drug-treated cells. In both the wild-type and the ΔrpoS strains, psfiA showed a basal level of expression, which was greater in the mutant (Fig. 2A), indicating intrinsic oxidative stress that was more marked in the latter. This is consistent with the fact that ROS and oxidative stress are generated in the course of normal metabolism (due, for instance, to the leakage of O from the respiratory chain [46, 47]) and that the rpoS mutant is compromised in mitigating this innate stress (25). Gm treatment activated psfiA in both strains but to a much greater extent in the mutant, indicating that the latter experienced greater drug-mediated oxidative stress.
FIG 2.

Gm treatment results in greater ROS levels in the ΔrpoS mutant. Solid bars represent Gm-treated cells, and striped bars represent untreated controls. (A) Activation of SOS response with and without Gm treatment in the wild type and the ΔrpoS mutant containing a single copy of the sfiA-lacZ fusion at 24 h, as monitored by β-galactosidase activity. (B) Representative differential interference contrast micrographs of cells of the two strains with and without 24-h Gm treatment (magnification, ×1,000; number of cells examined, ca. 10,000 of each strain). (C) Effect of 24-h Gm treatment on mean relative fluorescence units (RFU) of 3′-(p-hydroxyphenyl) fluorescein (HPF) in cells of the two strains. (D) Effect of Gm treatment on H2O2 production by the two strains. H2O2 was measured in Gm-treated cells by Amplex Red at 2, 4, and 6 h; the area under the concentration-time curve for H2O2 at these time points is plotted and represents total cellular H2O2 generation during this time; a shorter treatment time was used for this measurement because intracellular H2O2 may be subject to decomposition (26). (E) Effect of 24-h Gm treatment on protein carbonylation in the two strains, as detected by slot blot analysis. Student's t test was used to compare Gm-treated and untreated cells of the same strain (*, P < 0.05; **, P < 0.01; ***, P < 0.001) and untreated cells of the wild type and the mutant (††, P < 0.01; †††, P < 0.001).
In exponential-phase cells, activation of the SOS response results in generation of elongated cells because it inhibits cell division (48). As stationary-phase bacteria are in stasis, the SOS response is unlikely to result in cell elongation, and indeed we found that the Gm-mediated activation of this response in the stationary-phase wild-type and the mutant strains did not alter cell morphology; differential interference contrast micrographs showed similar dimensions in treated and untreated cells (Fig. 2B). This was of interest to us for the following reason. The cell-penetrating dye 3′-(p-hydroxyphenyl) fluorescein (HPF) is used in detecting oxidative stress, as it responds to HO· (49, 50), but recent studies have shown that it may give erroneous results in situations where cell size is increased as elongated cells have greater autofluorescence (51, 52). Since cell morphology did not change by Gm treatment, we used HPF as an additional method for comparing Gm-caused oxidative stress in the wild type and the ΔrpoS mutant. The results (Fig. 2C) agreed with the psfiA induction-based findings (Fig. 2A). There was HO· generation in the untreated cells, which was greater in the mutant, and the drug treatment increased its levels in both strains but to a greater extent in the latter. We also used Amplex Red, which measures H2O2 (29, 40), to further assess the Gm-caused oxidative stress. The results agreed with the above findings. That is, a basal level was seen in the untreated cells, which was greater in the mutant; it increased, also to a larger extent in the mutant, upon Gm treatment (Fig. 2D). A consequence of oxidative stress is protein carbonylation (53, 54), which we also examined to assess this stress in the two strains; Gm-mediated protein carbonylation was more pronounced in the mutant (Fig. 2E). Inaccuracy of ribosome function, which may result from Gm treatment, could conceivably also cause protein carbonylation (55), but this aspect would be the same in the wild type and the mutant. So it is reasonable to see enhanced carbonylation in the latter as due to greater oxidative stress.
Use of an antioxidant and treatment under anoxia mitigate Gm lethality.
If oxidative stress contributes to Gm lethality, it should be minimized by coadministration of an antioxidant. We used N-acetyl cysteine (NAC) to test this. Both the wild-type and the ΔrpoS strains were more tolerant of Gm when NAC was also administered, indicating that countering the oxidative stress was protective. The protection was more marked in the mutant (Fig. 3A), consistent with the greater oxidative stress that the drug generated in this strain (Fig. 2 and 3A).
FIG 3.
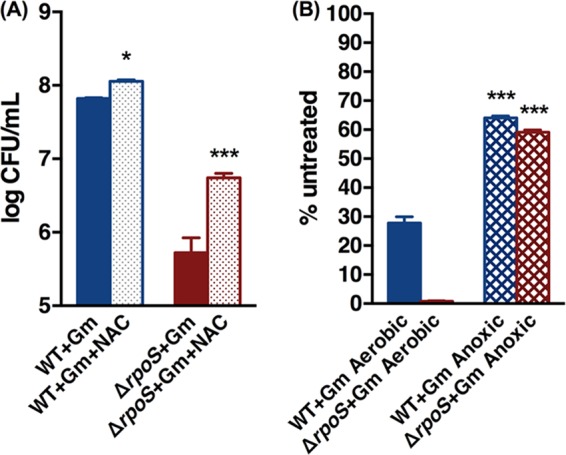
Coadministration of N-acetyl cysteine (5 mg/ml) (A) and anaerobiosis (B) decrease Gm lethality in stationary-phase cells in both the wild type and the ΔrpoS mutant but to a greater extent in the latter. Bars show survival after 24 h of Gm treatment under the specified conditions. Asterisks indicate P values in comparisons of NAC treatment or anoxic effects within the same strains. *, P < 0.05; ***, P < 0.001.
Anaerobiosis prevents ROS formation. Would it also mitigate Gm toxicity? Gm uptake is mediated by the proton motive force (PMF), but PMF is decreased, not eliminated, under anaerobiosis as the ATP synthetase continues to extrude protons (56), and Gm retains lethality under these conditions (26). Gm exposure under anoxia had an effect similar to that of aerobic coadministration of NAC and Gm (Fig. 3B): the drug tolerance increased in both the wild type and the mutant but to a far greater extent in the latter (74-fold versus 2.3-fold in the wild type). Both strains retained sensitivity to the drug under these conditions, indicating the drug's ability to kill the bacteria by means other than the oxidative stress; this stress therefore augments, and does not replace, Gm killing by inhibition of protein synthesis.
Absence of antioxidant proteins also renders E. coli more sensitive to Gm and prone to greater drug-mediated oxidative stress.
Results with the rpoS mutant show that oxidative stress contributes to Gm toxicity. We wanted to determine whether compromising the E. coli antioxidant defense by other means would also result in greater drug sensitivity. We used mutants lacking the antioxidant proteins KatE (hydroperoxidase HPII [catalase]) and superoxide dismutase (SOD); these proteins decompose ROS (48) and were selectively downregulated in the drug-treated rpoS mutant (Table 1, ΔrpoS mutant with Gm versus wild type with Gm). The stationary-phase ΔkatE and ΔsodA mutants were not more sensitive to Gm (data not shown), possibly because of the redundancy of the antioxidant defense, where the absence of a protein can be functionally compensated by others (44, 46, 47, 57, 58). When the double mutants ΔsodA ΔsodB and ΔkatE ΔsodA were tested, increased sensitivity to the drug was indeed found (Fig. 4).
FIG 4.
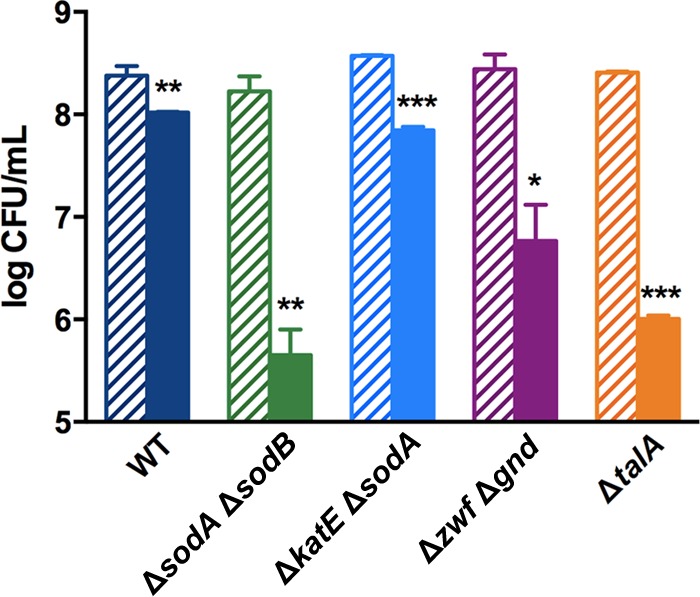
Deletion of ROS quencher proteins or PPP enzymes renders E. coli more sensitive to Gm. Effect of Gm treatment was determined as described in the legend of Fig. 1 on strains lacking ROS quencher proteins (ΔkatE ΔsodA and ΔsodA ΔsodB mutants) or PPP enzymes (Δzwf Δgnd and ΔtalA mutants). Solid bars represent the effect of Gm treatment; bars with stripes represent untreated controls. The effect of the drug on the wild type is reproduced from Fig. 1 for reference. Asterisks indicate P values for Gm-treated and untreated cells of the same strain. *, P < 0.05; **, P < 0.01; ***, P < 0.001.
Catalase and SOD decompose ROS and require the reductant NADPH for their activity (48). A major source of NADPH in biological entities is the pentose phosphate pathway (PPP), and disruption of this pathway results in increased sensitivity to oxidative stress (59, 60). Two enzymes of this pathway, transketolase B (TktB) and transaldolase A (TalA), were also selectively downregulated by Gm in the ΔrpoS mutant (Table 1, ΔrpoS mutant with Gm versus the wild type with Gm), suggesting that a dearth of NADPH from inhibition of the PPP may have reinforced the greater Gm sensitivity of this strain. This possibility was supported by the fact that the NADP/NADPH ratio in the drug-treated rpoS mutant was higher than in the similarly treated wild type, with values of (3.00 ± 0.82)-fold versus (1.05 ± 0.04)-fold, respectively (n = 3; P < 0.05).
To directly test if the PPP plays a role in Gm tolerance of stationary-phase E. coli, we tested mutants lacking selected enzymes of this pathway. The Δzwf and Δgnd mutants, lacking glucose-6-phosphate dehydrogenase and phosphogluconate dehydrogenase, respectively, exhibited marginally increased sensitivity (data not shown), and since the activity of these enzymes also can be supplanted by other proteins (61, 62), we tested a Δzwf Δgnd double mutant. This mutant was markedly more sensitive (Fig. 4). The ΔtalA mutant, missing the PPP enzyme transaldolase A, likewise showed increased Gm sensitivity, which was decreased by coadministration of NAC (see Fig. S2 in the supplemental material), implicating the contribution of oxidative stress in the mutant's increased vulnerability.
That Gm treatment resulted in greater oxidative stress in the ΔsodA ΔsodB and Δzwf Δgnd mutants and the ΔtalA mutant was shown by psfiA induction and protein carbonylation results (Fig. 5). We note that whereas the activation of the SOS response appeared less intense in the Δzwf Δgnd mutant than in the ΔsodA ΔsodB mutant, the levels of protein carbonylation were similar in these strains. Such differences in expression of oxidative stress have been noted before and point to the complexity of the this stress: the different effectiveness levels of the radicals generated by these mutations in causing protein carbonylation, the fact that only some proteins are subject to carbonylation, and the downstream effects of the mutations on metabolic networks (26, 53, 54, 63).
FIG 5.
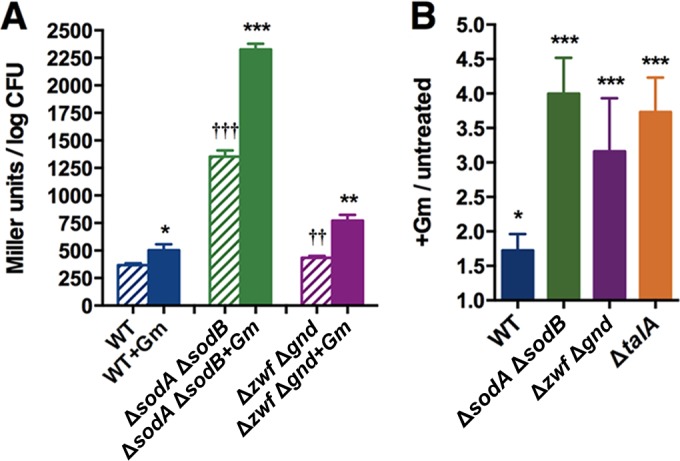
Gm treatment generates greater oxidative stress in mutants lacking quencher or PPP proteins than in the wild type. (A) Activation of SOS response at 24 h, as monitored by measuring β-galactosidase activity after Gm treatment in the quencher (ΔsodA ΔsodB mutant) or PPP (Δzwf Δgnd mutant) class of mutants containing a single copy of the sfiA-lacZ fusion. (B) Effect of 24-h Gm treatment on protein carbonylation in the ΔsodA ΔsodB, Δzwf Δgnd, and ΔtalA mutants as detected by slot blot analysis. Data on the wild type are reproduced from Fig. 2 for comparison. Asterisks indicate P values for Gm-treated and untreated cells of the same strain (*, P < 0.05; **, P < 0.01; ***, P < 0.001), and daggers represent comparisons between untreated cells of the wild type and the mutant (††, P < 0.01; †††, P < 0.001).
The rpoS mutant of the uropathogenic strain of E. coli (UPEC) is more sensitive to Gm in a mouse model of bladder infection.
To examine the clinical relevance of the above findings, we worked with the uropathogenic strain of E. coli (UPEC), AMG1 (34, 35), and its isogenic ΔrpoS mutant. UPEC causes infection of the urinary tract, and Gm is used in treating this disease. Gm caused greater killing and oxidative stress in the stationary-phase ΔrpoS mutant also of this strain in vitro (see Fig. S3 in the supplemental material). We used a mouse model (39) to examine whether this difference also occurred in vivo. As before, for these studies we sought a Gm concentration that would selectively affect the infective capability of the mutant and tested 50, 5, and 0.5 μg of the drug. Transurethrally injected stationary-phase wild-type and ΔrpoS mutant strains colonized the bladder of female CBA/J mice when no Gm was administered. Treatment with 50 or 5 μg of drug prevented colonization by both strains, but 0.5 μg prevented bladder colonization by the mutant only (Fig. 6A). Administration of NAC intraperitoneally 1 h before the bacterial injection enabled the mutant to colonize the bladder at this Gm concentration (Fig. 6B), showing that diminished oxidative stress made the mutant more resistant to the drug. (Controls receiving PBS instead of NAC showed no difference.) We interpret this to show that, at higher concentrations, the ability of Gm to disrupt protein synthesis is strong enough not to be affected by the defective antioxidant defense of the mutant, but at a low concentration, the drug relies also on the added effect of oxidative stress to be effective. A strong enough attack on elements of the E. coli antioxidant defense, for example, by small-molecule inhibitors of the proteins identified above, should therefore enhance Gm effectiveness in combating this disease and permit the use of lower drug concentrations, thereby minimizing drug side effects such as nephrotoxicity (64, 65).
FIG 6.
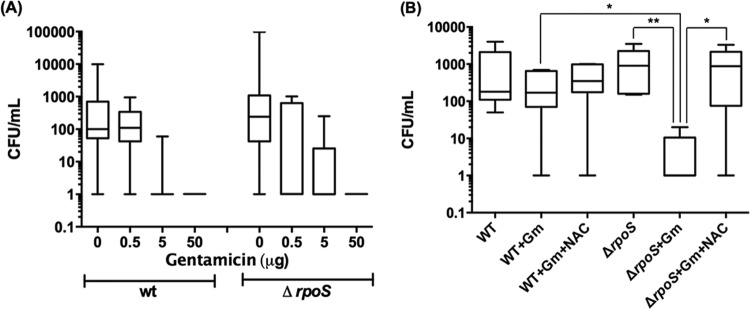
Gm compromises ability of the ΔrpoS mutant of UPEC (AMG1) to colonize female mouse bladder. Bladder infections in mice were initiated using stationary-phase wild-type or ΔrpoS mutant bacteria of the AMG1 strain. The mice were treated with 0, 0.5, 5, or 50 μg of Gm (A) or after N-acetyl cysteine (NAC; 10 mg/kg) administration (B). Data are presented as box-and-whisker plots which depict maximum, 75th percentile, median, 25th percentile, and minimum values of each group. For the experiment depicted in panel B, NAC was given as a single 10 mg/kg intraperitoneal dose 1 h before infection. Gm was administered at the time of infection and every 2 h thereafter for five doses of 0.5 μg. For statistical analysis, the data were transformed into log10 values to equalize group variance. Student's t test was performed using the transformed data (*, P < 0.05; **, P < 0.01, between groups as indicated).
Source of ROS.
The increase in ROS upon Gm treatment is accompanied by a diminished antioxidant defense, and this increase can result from the decreased quenching of ROS generated in the course of normal metabolism (46, 47, 66). In exponential-phase E. coli, Kohanski et al. (49) implicated bactericidal drug-mediated stimulation of respiration and the resulting increase in leakage of ROS from the respiratory chain and accompanying effects as the source of elevated ROS in drug-treated cells. This notion was challenged (28, 29), but recently Dwyer et al. (26) have presented strong evidence for this possibility, using a dynamic method for measuring the cellular oxygen consumption rate. To test whether Gm stimulates electron leakage from the respiratory chain in stationary phase, we used another approach. Rotenone inhibits electron transfer from iron-sulfur centers in complex I to quinone of the respiratory chain, causing accumulation of electrons in the intermembrane space, which results in ROS generation (67, 68). The redox indicator dye alamarBlue (AB) can accept these electrons and, due to the resulting change in its fluorescence, can act as a reporter of this accumulation (69). We used the particulate fraction of cell extracts of stationary-phase E. coli, which contains the cell membrane and the electron transport chain and is essentially devoid of soluble (nonmembrane) cell constituents (41), and measured AB reduction in reaction mixtures containing rotenone with and without Gm. There was a basal level of AB reduction without Gm, consistent with the other results presented here showing intrinsic ROS generation in cells not treated with the drug (Fig. 7). AB reduction was enhanced in the presence of Gm, which is consistent with the possibility that this drug stimulates electron leakage from the respiratory chain, leading to ROS formation.
FIG 7.
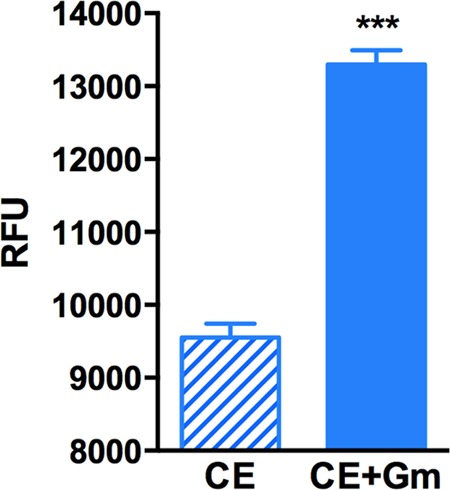
Gm increases electron leakage from the respiratory chain. Relative fluorescence units (RFU) of alamarBlue are shown for the membrane fraction of cell extracts of stationary-phase E. coli (BW25113) containing rotenone without (CE, for cell extract) and with (CE+Gm) Gm. ***, P < 0.001. See the text for further details.
DISCUSSION
As noted, stationary-phase bacteria play critical roles in disease causation, and it is important to develop means for their control (3, 4, 11–15, 17, 18, 70), which is addressed in this study. The rpoS mutant of the two E. coli strains examined here exhibited greater Gm sensitivity than the wild type (Fig. 1). Although this is reported so far only for 24 h of Gm treatment, we determined this for the rpoS mutant and selected other mutants after 48 and 72 h of Gm treatment. While increased drug exposure time generated greater killing of all strains, the mutants continued to show greater sensitivity (see Table S1 in the supplemental material).
Proteomic analysis (Table 1) suggested that the increased Gm sensitivity of the stationary-phase rpoS mutant to Gm was due to a compromised antioxidant defense. Three different methods of analysis were used: activation of the SOS response, which is a hallmark of the oxidative stress (48) that we monitored by a genetic reporter assay involving psfiA; the use of cell-penetrating dye HPF, which measures HO· (49, 50); and the use of Amplex Red, which responds to H2O2 (29, 40). The analysis did indeed show that Gm treatment resulted in greater ROS formation in the rpoS mutant than in the wild type, and this was backed up by the greater drug-mediated protein carbonylation in the mutant (Fig. 2), another indication of oxidative stress (25). The HPF method for assessing ROS generation by bactericidal drugs in exponential-phase bacteria has been deemed to be unsuitable as the alteration in cell dimensions distorts the results (51, 52); since Gm treatment had no such effect in stationary-phase cells, this is not relevant here. It was also reported that HPF fluorescence is reversible (29), but this is now shown not to be the case (26). Dwyer et al. (26) have advocated the use of the Amplex Red method to measure H2O2 within the cells rather than its excreted counterpart, which has been the standard approach (29, 40, 71, 72), but in the stationary-phase cells that were used here, the standard method was reliable and gave the same overall results as the other methods (Fig. 2).
That the increased oxidative stress in the ΔrpoS mutant contributed to increased Gm lethality of this strain is shown by the fact that the drug toxicity was significantly mitigated when Gm treatment accompanied the administration of the antioxidant NAC or when cells were exposed to Gm under anaerobic conditions that prevent ROS formation. Experiments with the uropathogenic strain of E. coli (AMG1) (34, 35) in a mouse urinary tract infection (UTI) model showed that this is the case also in vivo: Gm at a low concentration compromised the ability of the UPEC rpoS mutant to colonize female mouse bladder but not when the antioxidant NAC was also administered (Fig. 6).
Additional evidence bolsters the conclusion that an intact antioxidant defense is important in Gm tolerance of stationary-phase E. coli. Thus, disrupting this defense by the elimination of the quencher proteins SodA/SodB or KatE/SodA also subjected these bacteria to greater Gm-mediated oxidative stress (Fig. 5) and increased lethality (Fig. 4). It has been shown that the combined loss of SodA and SodB renders exponential-phase E. coli also more sensitive to certain bactericidal drugs (58), but it has not been previously shown in stationary-phase cells nor in the context of the σs-regulated stress response. The loss of Zwf/Gnd or of the TalA protein of the PPP, which supplies the NADPH that fuels the quencher proteins and is a well-established part of the antioxidant defense (59, 60), also imposed greater oxidative stress (Fig. 5) and rendered the cells more sensitive to the drug (Fig. 4); this sensitivity too was minimized by NAC coadministration (see Fig. S2 in the supplemental material). To our knowledge, this is the first time that the PPP has been implicated in resistance to a bactericidal drug. This pathway also supplies pentoses required in ribosome function, and its disruption and the resulting potential pentose scarcity may have also contributed to enhanced Gm lethality in these mutants by exacerbating inhibition of protein synthesis. The NAC effect, however, clearly affirms the role of oxidative stress. The mutants of both the quencher and PPP classes showed different degrees of increase in Gm sensitivity (Fig. 4). This is unsurprising, given that the quencher proteins involved likely differ in decomposing the major reactive species generated by Gm and that the mutational loss of a vital function can activate metabolic networks with different capacities to compensate for it (73, 74).
Other findings also point to the fact that Gm generates oxidative stress. Thus, in mice, this drug significantly increases kidney myeloperoxidase activity, lipid peroxidation, and protein carbonylation. It has been shown that the resulting acute renal failure is caused by ROS, and the use of M40403, which is a low-molecular-weight mimetic of superoxide dismutase, attenuates this damage (64, 65, 75). Similarly, proteomic analysis implicates Gm-mediated oxidative stress in Leishmania since the proteins affected by drug exposure included the thiol-redox control system (76). Furthermore, it was shown that Gm-mediated ROS production can enhance the effectiveness of drugs like camptothecin and digitoxin against the lung cancer cell line NCI-H460 (77).
It needs to be emphasized that the established mechanism of Gm action on bacteria is not questioned by these data; instead, they show that an additional mechanism—oxidative stress—has a role in the lethality of this drug in stationary-phase cells. It is clear that neither NAC nor anaerobiosis rendered the drug harmless (Fig. 3), and it was only at a low dose of Gm that the administration of NAC was needed to bolster the colonizing ability of the rpoS mutant (Fig. 6). Other factors were therefore involved, and it is logical to assume that inhibition of protein synthesis continued to have a key role in the toxicity of the drug. This study, however, has detected new targets to enhance the effectiveness of Gm. Even though some of the proteins implicated have mammalian orthologues, sufficient differences exist between the pro- and eukaryotic proteins that selective targeting of the former should be possible.
As regards the source of increased ROS in Gm-treated cells, our data implicate two possibilities. One is endogenous ROS. As stated, normal metabolic processes generate ROS; these species leak out of the electron transport chain during respiration, and many metabolic products, e.g., quinonoid compounds, are subject to redox cycling that generates these radicals (46, 49, 66, 78). A dynamic balance between the ROS so generated and their decomposition by the cellular antioxidant defense keeps the endogenous ROS at a low level (47, 78). As we have seen (Fig. 2), in non-drug-treated cells, compromising the antioxidant defense by the elimination of σS or the σS-dependent quencher proteins tilted this balance to a higher steady-state ROS level. The increased ROS in the drug-treated cells accompanied a weakened antioxidant defense; therefore, this increase may just reflect insufficient quenching of the endogenous ROS. An additional mechanism, indicated by the AB results, is stimulation of ROS leakage from the respiratory chain by Gm. This possibility is in agreement with the findings of the Dwyer et al. and Kohanski et al. in exponential-phase cells (26, 49). A third possibility that remains to be explored is that the bactericidal drugs themselves can redox cycle (79, 80), generating extra ROS.
A few comments on the current controversy on the role of ROS in bactericidal drug toxicity are in order. Several studies have hinted at the possibility that in bacteria in this phase, these drugs, in addition to damaging their established targets, also injure the cells by generating ROS (81–85), and a mechanistic basis for ROS generation by the drugs was presented for E. coli by the Kohanski et al. (49) involving as noted above, stimulation of respiration. Three subsequent studies not only questioned the proposed mechanism but also ruled out the contribution of ROS in the lethality of these drugs (27–29). This has evoked a response from Dwyer et al., by and large reinstating their original conclusions (26). One possible explanation for the conflicting findings relates to the growth stage. Liu and Imlay (29) used very early exponential-phase cells (optical density [OD] of 0.05 to 0.2), while Dwyer et al. (26) may have studied cells grown to a much higher density. It has been shown that the σs-mediated stress response begins already in advanced exponential phase (86), and it may be that the ROS role found by Dwyer et al. is due to some commonality with stationary-phase cells. Be that as it may, the disagreement is not relevant to this study, which deals with bacteria in confirmed stationary phase, representing, as stated, a very different physiological state than cells in the exponential phase (7–10, 13, 31, 32).
Supplementary Material
ACKNOWLEDGMENTS
We thank C. Miller and S. Cohen (Department of Genetics, Stanford University) for providing us with E. coli strain SY2.
This research was supported by NASA grants NNX09AH41G and NNX10AM90A to A.C.M. and by NIH DK087895 to M.H. R.S. was supported, in part, by a Fulbright-Nehru Postdoctoral Research Fellowship.
Neither NASA nor NIH had any role in study design, data collection and analysis, decision to publish, or preparation of the manuscript.
Footnotes
Published ahead of print 28 July 2014
Supplemental material for this article may be found at http://dx.doi.org/10.1128/AAC.03683-14.
REFERENCES
- 1.Sonenshein AL. 2005. CodY, a global regulator of stationary phase and virulence in Gram-positive bacteria. Curr. Opin. Microbiol. 8:203–207. 10.1016/j.mib.2005.01.001 [DOI] [PubMed] [Google Scholar]
- 2.Navarro Llorens JM, Tormo A, Martinez-Garcia E. 2010. Stationary phase in gram-negative bacteria. FEMS Microbiol. Rev. 34:476–495. 10.1111/j.1574-6976.2010.00213.x [DOI] [PubMed] [Google Scholar]
- 3.Cabeen MT. 2014. Stationary phase-specific virulence factor overproduction by a lasR mutant of Pseudomonas aeruginosa. PLoS One 9:e88743. 10.1371/journal.pone.0088743 [DOI] [PMC free article] [PubMed] [Google Scholar]
- 4.Mouslim C, Hughes KT. 2014. The effect of cell growth phase on the regulatory cross-talk between flagellar and Spi1 virulence gene expression. PLoS Pathog. 10:e1003987. 10.1371/journal.ppat.1003987 [DOI] [PMC free article] [PubMed] [Google Scholar]
- 5.Hengge-Aronis R. 2002. Signal transduction and regulatory mechanisms involved in control of the σS (RpoS) subunit of RNA polymerase. Microbiol. Mol. Biol. Rev. 66:373–395. 10.1128/MMBR.66.3.373-395.2002 [DOI] [PMC free article] [PubMed] [Google Scholar]
- 6.Kolter R, Siegele DA, Tormo A. 1993. The stationary phase of the bacterial life cycle. Annu. Rev. Microbiol. 47:855–874. 10.1146/annurev.mi.47.100193.004231 [DOI] [PubMed] [Google Scholar]
- 7.Matin A. 1991. The molecular basis of carbon-starvation-induced general resistance in Escherichia coli. Mol. Microbiol. 5:3–10. 10.1111/j.1365-2958.1991.tb01819.x [DOI] [PubMed] [Google Scholar]
- 8.Matin A. 2009. Stress, bacterial: general and specific, p 485–500 In Schaechter M. (ed), Encyclopedia of microbiology (3rd ed). Academic Press, Oxford, United Kingdom [Google Scholar]
- 9.Dalebroux ZD, Svensson SL, Gaynor EC, Swanson MS. 2010. ppGpp conjures bacterial virulence. Microbiol. Mol. Biol. Rev. 74:171–199. 10.1128/MMBR.00046-09 [DOI] [PMC free article] [PubMed] [Google Scholar]
- 10.Roop RM, II, Gee JM, Robertson GT, Richardson JM, Ng WL, Winkler ME. 2003. Brucella stationary-phase gene expression and virulence. Annu. Rev. Microbiol. 57:57–76. 10.1146/annurev.micro.57.030502.090803 [DOI] [PubMed] [Google Scholar]
- 11.Mangan MW, Lucchini S, Danino V, Croinin TO, Hinton JC, Dorman CJ. 2006. The integration host factor (IHF) integrates stationary-phase and virulence gene expression in Salmonella enterica serovar Typhimurium. Mol. Microbiol. 59:1831–1847. 10.1111/j.1365-2958.2006.05062.x [DOI] [PubMed] [Google Scholar]
- 12.Barnhart MM, Chapman MR. 2006. Curli biogenesis and function. Annu. Rev. Microbiol. 60:131–147. 10.1146/annurev.micro.60.080805.142106 [DOI] [PMC free article] [PubMed] [Google Scholar]
- 13.Kau AL, Hunstad DA, Hultgren SJ. 2005. Interaction of uropathogenic Escherichia coli with host uroepithelium. Curr. Opin. Microbiol. 8:54–59. 10.1016/j.mib.2004.12.001 [DOI] [PubMed] [Google Scholar]
- 14.Kau AL, Martin SM, Lyon W, Hayes E, Caparon MG, Hultgren SJ. 2005. Enterococcus faecalis tropism for the kidneys in the urinary tract of C57BL/6J mice. Infect. Immun. 73:2461–2468. 10.1128/IAI.73.4.2461-2468.2005 [DOI] [PMC free article] [PubMed] [Google Scholar]
- 15.Anderl JN, Zahller J, Roe F, Stewart PS. 2003. Role of nutrient limitation and stationary-phase existence in Klebsiella pneumoniae biofilm resistance to ampicillin and ciprofloxacin. Antimicrob. Agents Chemother. 47:1251–1256. 10.1128/AAC.47.4.1251-1256.2003 [DOI] [PMC free article] [PubMed] [Google Scholar]
- 16.Nguyen D, Joshi-Datar A, Lepine F, Bauerle E, Olakanmi O, Beer K, McKay G, Siehnel R, Schafhauser J, Wang Y, Britigan BE, Singh PK. 2011. Active starvation responses mediate antibiotic tolerance in biofilms and nutrient-limited bacteria. Science 334:982–986. 10.1126/science.1211037 [DOI] [PMC free article] [PubMed] [Google Scholar]
- 17.Hu Y, Shamaei-Tousi A, Liu Y, Coates A. 2010. A new approach for the discovery of antibiotics by targeting non-multiplying bacteria: a novel topical antibiotic for staphylococcal infections. PLoS One 5:e11818. 10.1371/journal.pone.0011818 [DOI] [PMC free article] [PubMed] [Google Scholar]
- 18.Podos SD, Thanassi JA, Leggio M, Pucci MJ. 2012. Bactericidal activity of ACH-702 against nondividing and biofilm staphylococci. Antimicrob. Agents Chemother. 56:3812–3818. 10.1128/AAC.00092-12 [DOI] [PMC free article] [PubMed] [Google Scholar]
- 19.Hengge-Aronis R. 2002. Stationary phase gene regulation: what makes an Escherichia coli promoter σS-selective? Curr. Opin. Microbiol. 5:591–595. 10.1016/S1369-5274(02)00372-7 [DOI] [PubMed] [Google Scholar]
- 20.Matin A, Auger EA, Blum PH, Schultz JE. 1989. Genetic basis of starvation survival in nondifferentiating bacteria. Annu. Rev. Microbiol. 43:293–316. 10.1146/annurev.mi.43.100189.001453 [DOI] [PubMed] [Google Scholar]
- 21.Poole K. 2012. Bacterial stress responses as determinants of antimicrobial resistance. J. Antimicrob. Chemother. 67:2069–2089. 10.1093/jac/dks196 [DOI] [PubMed] [Google Scholar]
- 22.Andersson DI, Hughes D. 2010. Antibiotic resistance and its cost: is it possible to reverse resistance? Nat. Rev. Microbiol. 8:260–271. 10.1038/nrmicro2319 [DOI] [PubMed] [Google Scholar]
- 23.Mazel D, Davies J. 1999. Antibiotic resistance in microbes. Cell Mol. Life Sci. 56:742–754. 10.1007/s000180050021 [DOI] [PMC free article] [PubMed] [Google Scholar]
- 24.Kolodkin-Gal I, Engelberg-Kulka H. 2009. The stationary-phase sigma factor σS is responsible for the resistance of Escherichia coli stationary-phase cells to mazEF-mediated cell death. J. Bacteriol. 191:3177–3182. 10.1128/JB.00011-09 [DOI] [PMC free article] [PubMed] [Google Scholar]
- 25.Nystrom T. 2004. Stationary-phase physiology. Annu. Rev. Microbiol. 58:161–181. 10.1146/annurev.micro.58.030603.123818 [DOI] [PubMed] [Google Scholar]
- 26.Dwyer DJ, Belenky PA, Yang JH, MacDonald IC, Martell JD, Takahashi N, Chan CT, Lobritz MA, Braff D, Schwarz EG, Ye JD, Pati M, Vercruysse M, Ralifo PS, Allison KR, Khalil AS, Ting AY, Walker GC, Collins JJ. 2014. Antibiotics induce redox-related physiological alterations as part of their lethality. Proc. Natl. Acad. Sci. U. S. A. 111:E2100–E2109. 10.1073/pnas.1401876111 [DOI] [PMC free article] [PubMed] [Google Scholar]
- 27.Ezraty B, Vergnes A, Banzhaf M, Duverger Y, Huguenot A, Brochado AR, Su SY, Espinosa L, Loiseau L, Py B, Typas A, Barras F. 2013. Fe-S cluster biosynthesis controls uptake of aminoglycosides in a ROS-less death pathway. Science 340:1583–1587. 10.1126/science.1238328 [DOI] [PubMed] [Google Scholar]
- 28.Keren I, Wu Y, Inocencio J, Mulcahy LR, Lewis K. 2013. Killing by bactericidal antibiotics does not depend on reactive oxygen species. Science 339:1213–1216. 10.1126/science.1232688 [DOI] [PubMed] [Google Scholar]
- 29.Liu Y, Imlay JA. 2013. Cell death from antibiotics without the involvement of reactive oxygen species. Science 339:1210–1213. 10.1126/science.1232751 [DOI] [PMC free article] [PubMed] [Google Scholar]
- 30.Sezonov G, Joseleau-Petit D, D'Ari R. 2007. Escherichia coli physiology in Luria-Bertani broth. J. Bacteriol. 189:8746–8749. 10.1128/JB.01368-07 [DOI] [PMC free article] [PubMed] [Google Scholar]
- 31.Rolfe MD, Rice CJ, Lucchini S, Pin C, Thompson A, Cameron AD, Alston M, Stringer MF, Betts RP, Baranyi J, Peck MW, Hinton JC. 2012. Lag phase is a distinct growth phase that prepares bacteria for exponential growth and involves transient metal accumulation. J. Bacteriol. 194:686–701. 10.1128/JB.06112-11 [DOI] [PMC free article] [PubMed] [Google Scholar]
- 32.Jozefczuk S, Klie S, Catchpole G, Szymanski J, Cuadros-Inostroza A, Steinhauser D, Selbig J, Willmitzer L. 2010. Metabolomic and transcriptomic stress response of Escherichia coli. Mol. Syst. Biol. 6:364. 10.1038/msb.2010.18 [DOI] [PMC free article] [PubMed] [Google Scholar]
- 33.Baba T, Ara T, Hasegawa M, Takai Y, Okumura Y, Baba M, Datsenko KA, Tomita M, Wanner BL, Mori H. 2006. Construction of Escherichia coli K-12 in-frame, single-gene knockout mutants: the Keio collection. Mol. Syst. Biol. 2:2006.0008. 10.1038/msb4100050 [DOI] [PMC free article] [PubMed] [Google Scholar]
- 34.Stone G, Wood P, Dixon L, Keyhan M, Matin A. 2002. Tetracycline rapidly reaches all the constituent cells of uropathogenic Escherichia coli biofilms. Antimicrob. Agents Chemother. 46:2458–2461. 10.1128/AAC.46.8.2458-2461.2002 [DOI] [PMC free article] [PubMed] [Google Scholar]
- 35.Lynch SV, Dixon L, Benoit MR, Brodie EL, Keyhan M, Hu P, Ackerley DF, Andersen GL, Matin A. 2007. Role of the rapA gene in controlling antibiotic resistance of Escherichia coli biofilms. Antimicrob. Agents Chemother. 51:3650–3658. 10.1128/AAC.00601-07 [DOI] [PMC free article] [PubMed] [Google Scholar]
- 36.Thomason LC, Costantino N, Court DL. 2007. E. coli genome manipulation by P1 transduction. Curr. Protoc. Mol. Biol. Chapter 1:Unit 1.17. 10.1002/0471142727.mb0117s79 [DOI] [PubMed] [Google Scholar]
- 37.Zhang X, Bremer H. 1995. Control of the Escherichia coli rrnB P1 promoter strength by ppGpp. J. Biol. Chem. 270:11181–11189. 10.1074/jbc.270.19.11181 [DOI] [PubMed] [Google Scholar]
- 38.Institute CaLS. 2011. Performance standards for antimicrobial susceptibility testing; twenty-first informational supplement. Document M100-S21 Clinical and Laboratory Standards Institute, Wayne, PA [Google Scholar]
- 39.Fu CL, Apelo CA, Torres B, Thai KH, Hsieh MH. 2011. Mouse bladder wall injection. J. Vis. Exp. 53:e2523. 10.3791/2523 [DOI] [PMC free article] [PubMed] [Google Scholar]
- 40.Gonzalez CF, Ackerley DF, Lynch SV, Matin A. 2005. ChrR, a soluble quinone reductase of Pseudomonas putida that defends against H2O2. J. Biol. Chem. 280:22590–22595. 10.1074/jbc.M501654200 [DOI] [PubMed] [Google Scholar]
- 41.Matin A, Rittenberg SC. 1970. Regulation of glucose metabolism in Thiobacillus intermedius. J. Bacteriol. 104:239–246 [DOI] [PMC free article] [PubMed] [Google Scholar]
- 42.Reeve CA, Amy PS, Matin A. 1984. Role of protein synthesis in the survival of carbon-starved Escherichia coli K-12. J. Bacteriol. 160:1041–1046 [DOI] [PMC free article] [PubMed] [Google Scholar]
- 43.Collet A, Cosette P, Beloin C, Ghigo JM, Rihouey C, Lerouge P, Junter GA, Jouenne T. 2008. Impact of rpoS deletion on the proteome of Escherichia coli grown planktonically and as biofilm. J. Proteome Res. 7:4659–4669. 10.1021/pr8001723 [DOI] [PubMed] [Google Scholar]
- 44.Ackerley DF, Barak Y, Lynch SV, Curtin J, Matin A. 2006. Effect of chromate stress on Escherichia coli K-12. J. Bacteriol. 188:3371–3381. 10.1128/JB.188.9.3371-3381.2006 [DOI] [PMC free article] [PubMed] [Google Scholar]
- 45.Miller C, Thomsen LE, Gaggero C, Mosseri R, Ingmer H, Cohen SN. 2004. SOS response induction by beta-lactams and bacterial defense against antibiotic lethality. Science 305:1629–1631. 10.1126/science.1101630 [DOI] [PubMed] [Google Scholar]
- 46.Imlay JA. 2008. Cellular defenses against superoxide and hydrogen peroxide. Annu. Rev. Biochem. 77:755–776. 10.1146/annurev.biochem.77.061606.161055 [DOI] [PMC free article] [PubMed] [Google Scholar]
- 47.Storz G, Imlay JA. 1999. Oxidative stress. Curr. Opin. Microbiol. 2:188–194. 10.1016/S1369-5274(99)80033-2 [DOI] [PubMed] [Google Scholar]
- 48.Berg JM, Tymoczko JL, Stryer L. 2012. Biochemistry, 7th ed. W. H. Freeman, New York, NY [Google Scholar]
- 49.Kohanski MA, Dwyer DJ, Hayete B, Lawrence CA, Collins JJ. 2007. A common mechanism of cellular death induced by bactericidal antibiotics. Cell 130:797–810. 10.1016/j.cell.2007.06.049 [DOI] [PubMed] [Google Scholar]
- 50.Setsukinai K, Urano Y, Kakinuma K, Majima HJ, Nagano T. 2003. Development of novel fluorescence probes that can reliably detect reactive oxygen species and distinguish specific species. J. Biol. Chem. 278:3170–3175. 10.1074/jbc.M209264200 [DOI] [PubMed] [Google Scholar]
- 51.Paulander W, Wang Y, Folkesson A, Charbon G, Lobner-Olesen A, Ingmer H. 2014. Bactericidal antibiotics increase hydroxyphenyl fluorescein signal by altering cell morphology. PLoS One 9:e92231. 10.1371/journal.pone.0092231 [DOI] [PMC free article] [PubMed] [Google Scholar]
- 52.Renggli S, Keck W, Jenal U, Ritz D. 2013. Role of autofluorescence in flow cytometric analysis of Escherichia coli treated with bactericidal antibiotics. J. Bacteriol. 195:4067–4073. 10.1128/JB.00393-13 [DOI] [PMC free article] [PubMed] [Google Scholar]
- 53.Dukan S, Nystrom T. 1999. Oxidative stress defense and deterioration of growth-arrested Escherichia coli cells. J. Biol. Chem. 274:26027–26032. 10.1074/jbc.274.37.26027 [DOI] [PubMed] [Google Scholar]
- 54.Levine RL, Williams JA, Stadtman ER, Shacter E. 1994. Carbonyl assays for determination of oxidatively modified proteins. Methods Enzymol. 233:346–357. 10.1016/S0076-6879(94)33040-9 [DOI] [PubMed] [Google Scholar]
- 55.Ballesteros M, Fredriksson A, Henriksson J, Nystrom T. 2001. Bacterial senescence: protein oxidation in non-proliferating cells is dictated by the accuracy of the ribosomes. EMBO J. 20:5280–5289. 10.1093/emboj/20.18.5280 [DOI] [PMC free article] [PubMed] [Google Scholar]
- 56.Kashket ER. 1981. Effects of aerobiosis and nitrogen source on the proton motive force in growing Escherichia coli and Klebsiella pneumoniae cells. J. Bacteriol. 146:377–384 [DOI] [PMC free article] [PubMed] [Google Scholar]
- 57.Demple B. 1991. Regulation of bacterial oxidative stress genes. Annu. Rev. Genet. 25:315–337. 10.1146/annurev.ge.25.120191.001531 [DOI] [PubMed] [Google Scholar]
- 58.Wang X, Zhao X. 2009. Contribution of oxidative damage to antimicrobial lethality. Antimicrob. Agents Chemother. 53:1395–1402. 10.1128/AAC.01087-08 [DOI] [PMC free article] [PubMed] [Google Scholar]
- 59.Grant CM. 2008. Metabolic reconfiguration is a regulated response to oxidative stress. J. Biol. 7:1. 10.1186/jbiol63 [DOI] [PMC free article] [PubMed] [Google Scholar]
- 60.Ralser M, Wamelink MM, Kowald A, Gerisch B, Heeren G, Struys EA, Klipp E, Jakobs C, Breitenbach M, Lehrach H, Krobitsch S. 2007. Dynamic rerouting of the carbohydrate flux is key to counteracting oxidative stress. J. Biol. 6:10. 10.1186/jbiol61 [DOI] [PMC free article] [PubMed] [Google Scholar]
- 61.Hawes JW, Harper ET, Crabb DW, Harris RA. 1996. Structural and mechanistic similarities of 6-phosphogluconate and 3-hydroxyisobutyrate dehydrogenases reveal a new enzyme family, the 3-hydroxyacid dehydrogenases. FEBS Lett. 389:263–267. 10.1016/0014-5793(96)00597-2 [DOI] [PubMed] [Google Scholar]
- 62.Zamboni N, Fischer E, Laudert D, Aymerich S, Hohmann HP, Sauer U. 2004. The Bacillus subtilis yqjI gene encodes the NADP+-dependent 6-P-gluconate dehydrogenase in the pentose phosphate pathway. J. Bacteriol. 186:4528–4534. 10.1128/JB.186.14.4528-4534.2004 [DOI] [PMC free article] [PubMed] [Google Scholar]
- 63.Maisonneuve E, Ducret A, Khoueiry P, Lignon S, Longhi S, Talla E, Dukan S. 2009. Rules governing selective protein carbonylation. PLoS One 4:e7269. 10.1371/journal.pone.0007269 [DOI] [PMC free article] [PubMed] [Google Scholar]
- 64.Randjelovic P, Veljkovic S, Stojiljkovic N, Jankovic-Velickovic L, Sokolovic D, Stoiljkovic M, Ilic I. 2012. Salicylic acid attenuates gentamicin-induced nephrotoxicity in rats. Scientific World Journal 2012:390613. 10.1100/2012/390613 [DOI] [PMC free article] [PubMed] [Google Scholar]
- 65.Randjelovic P, Veljkovic S, Stojiljkovic N, Velickovic L, Sokolovic D, Stoiljkovic M, Ilic I. 2012. Protective effect of selenium on gentamicin-induced oxidative stress and nephrotoxicity in rats. Drug Chem. Toxicol. 35:141–148. 10.3109/01480545.2011.589446 [DOI] [PubMed] [Google Scholar]
- 66.Boylen CW, Ensign JC. 1970. Intracellular substrates for endogenous metabolism during long-term starvation of rod and spherical cells of Arthrobacter crystallopoietes. J. Bacteriol. 103:578–587 [DOI] [PMC free article] [PubMed] [Google Scholar]
- 67.Liu Y, Fiskum G, Schubert D. 2002. Generation of reactive oxygen species by the mitochondrial electron transport chain. J. Neurochem. 80:780–787. 10.1046/j.0022-3042.2002.00744.x [DOI] [PubMed] [Google Scholar]
- 68.Li N, Ragheb K, Lawler G, Sturgis J, Rajwa B, Melendez JA, Robinson JP. 2003. Mitochondrial complex I inhibitor rotenone induces apoptosis through enhancing mitochondrial reactive oxygen species production. J. Biol. Chem. 278:8516–8525. 10.1074/jbc.M210432200 [DOI] [PubMed] [Google Scholar]
- 69.Rampersad SN. 2012. Multiple applications of Alamar Blue as an indicator of metabolic function and cellular health in cell viability bioassays. Sensors (Basel) 12:12347–12360. 10.3390/s120912347 [DOI] [PMC free article] [PubMed] [Google Scholar]
- 70.Dalebroux ZD, Yagi BF, Sahr T, Buchrieser C, Swanson MS. 2010. Distinct roles of ppGpp and DksA in Legionella pneumophila differentiation. Mol. Microbiol. 76:200–219. 10.1111/j.1365-2958.2010.07094.x [DOI] [PMC free article] [PubMed] [Google Scholar]
- 71.Dwyer DJ, Kohanski MA, Collins JJ. 2009. Role of reactive oxygen species in antibiotic action and resistance. Curr. Opin. Microbiol. 12:482–489. 10.1016/j.mib.2009.06.018 [DOI] [PMC free article] [PubMed] [Google Scholar]
- 72.Seaver LC, Imlay JA. 2004. Are respiratory enzymes the primary sources of intracellular hydrogen peroxide? J. Biol. Chem. 279:48742–48750. 10.1074/jbc.M408754200 [DOI] [PubMed] [Google Scholar]
- 73.Henry CS, DeJongh M, Best AA, Frybarger PM, Linsay B, Stevens RL. 2010. High-throughput generation, optimization and analysis of genome-scale metabolic models. Nat. Biotechnol. 28:977–982. 10.1038/nbt.1672 [DOI] [PubMed] [Google Scholar]
- 74.Nakahigashi K, Toya Y, Ishii N, Soga T, Hasegawa M, Watanabe H, Takai Y, Honma M, Mori H, Tomita M. 2009. Systematic phenome analysis of Escherichia coli multiple-knockout mutants reveals hidden reactions in central carbon metabolism. Mol. Syst. Biol. 5:306. 10.1038/msb.2009.65 [DOI] [PMC free article] [PubMed] [Google Scholar]
- 75.Cuzzocrea S, Mazzon E, Dugo L, Serraino I, Di Paola R, Britti D, De Sarro A, Pierpaoli S, Caputi A, Masini E, Salvemini D. 2002. A role for superoxide in gentamicin-mediated nephropathy in rats. Eur. J. Pharmacol. 450:67–76. 10.1016/S0014-2999(02)01749-1 [DOI] [PubMed] [Google Scholar]
- 76.Daneshvar H, Wyllie S, Phillips S, Hagan P, Burchmore R. 2012. Comparative proteomics profiling of a gentamicin-attenuated Leishmania infantum cell line identifies key changes in parasite thiol-redox metabolism. J. Proteomics 75:1463–1471. 10.1016/j.jprot.2011.11.018 [DOI] [PubMed] [Google Scholar]
- 77.Cuccarese MF, Singh A, Amiji M, O'Doherty GA. 2013. A novel use of gentamicin in the ROS-mediated sensitization of NCI-H460 lung cancer cells to various anticancer agents. ACS Chem. Biol. 8:2771–2777. 10.1021/cb4007024 [DOI] [PMC free article] [PubMed] [Google Scholar]
- 78.Imlay JA, Fridovich I. 1991. Superoxide production by respiring membranes of Escherichia coli. Free Radic. Res. Commun. 12–13:59–66 [DOI] [PubMed] [Google Scholar]
- 79.Martin JP, Jr, Colina K, Logsdon N. 1987. Role of oxygen radicals in the phototoxicity of tetracyclines toward Escherichia coli B. J. Bacteriol. 169:2516–2522 [DOI] [PMC free article] [PubMed] [Google Scholar]
- 80.Umezawa N, Arakane K, Ryu A, Mashiko S, Hirobe M, Nagano T. 1997. Participation of reactive oxygen species in phototoxicity induced by quinolone antibacterial agents. Arch. Biochem. Biophys. 342:275–281. 10.1006/abbi.1997.0124 [DOI] [PubMed] [Google Scholar]
- 81.Breidenstein EB, Khaira BK, Wiegand I, Overhage J, Hancock RE. 2008. Complex ciprofloxacin resistome revealed by screening a Pseudomonas aeruginosa mutant library for altered susceptibility. Antimicrob. Agents Chemother. 52:4486–4491. 10.1128/AAC.00222-08 [DOI] [PMC free article] [PubMed] [Google Scholar]
- 82.Davies BW, Kohanski MA, Simmons LA, Winkler JA, Collins JJ, Walker GC. 2009. Hydroxyurea induces hydroxyl radical-mediated cell death in Escherichia coli. Mol. Cell 36:845–860. 10.1016/j.molcel.2009.11.024 [DOI] [PMC free article] [PubMed] [Google Scholar]
- 83.Girgis HS, Hottes AK, Tavazoie S. 2009. Genetic architecture of intrinsic antibiotic susceptibility. PLoS One 4:e5629. 10.1371/journal.pone.0005629 [DOI] [PMC free article] [PubMed] [Google Scholar]
- 84.Bizzini A, Zhao C, Auffray Y, Hartke A. 2009. The Enterococcus faecalis superoxide dismutase is essential for its tolerance to vancomycin and penicillin. J. Antimicrob. Chemother. 64:1196–1202. 10.1093/jac/dkp369 [DOI] [PubMed] [Google Scholar]
- 85.Shatalin K, Shatalina E, Mironov A, Nudler E. 2011. H2S: a universal defense against antibiotics in bacteria. Science 334:986–990. 10.1126/science.1209855 [DOI] [PubMed] [Google Scholar]
- 86.Zgurskaya HI, Keyhan M, Matin A. 1997. The sigma S level in starving Escherichia coli cells increases solely as a result of its increased stability, despite decreased synthesis. Mol. Microbiol. 24:643–651. 10.1046/j.1365-2958.1997.3961742.x [DOI] [PubMed] [Google Scholar]
- 87.Calhoun LN, Kwon YM. 2011. The ferritin-like protein Dps protects Salmonella enterica serotype Enteritidis from the Fenton-mediated killing mechanism of bactericidal antibiotics. Int. J. Antimicrob. Agents 37:261–265. 10.1016/j.ijantimicag.2010.11.034 [DOI] [PubMed] [Google Scholar]
- 88.Bilska A, Dubiel M, Sokolowska-Jezewicz M, Lorenc-Koci E, Wlodek L. 2007. Alpha-lipoic acid differently affects the reserpine-induced oxidative stress in the striatum and prefrontal cortex of rat brain. Neuroscience 146:1758–1771. 10.1016/j.neuroscience.2007.04.002 [DOI] [PubMed] [Google Scholar]
- 89.Bryk R, Lima CD, Erdjument-Bromage H, Tempst P, Nathan C. 2002. Metabolic enzymes of mycobacteria linked to antioxidant defense by a thioredoxin-like protein. Science 295:1073–1077. 10.1126/science.1067798 [DOI] [PubMed] [Google Scholar]
- 90.Rajashankar KR, Bryk R, Kniewel R, Buglino JA, Nathan CF, Lima CD. 2005. Crystal structure and functional analysis of lipoamide dehydrogenase from Mycobacterium tuberculosis. J. Biol. Chem. 280:33977–33983. 10.1074/jbc.M507466200 [DOI] [PubMed] [Google Scholar]
- 91.Chen L, Xie QW, Nathan C. 1998. Alkyl hydroperoxide reductase subunit C (AhpC) protects bacterial and human cells against reactive nitrogen intermediates. Mol. Cell 1:795–805. 10.1016/S1097-2765(00)80079-9 [DOI] [PubMed] [Google Scholar]
- 92.Wasim M, Bible AN, Xie Z, Alexandre G. 2009. Alkyl hydroperoxide reductase has a role in oxidative stress resistance and in modulating changes in cell-surface properties in Azospirillum brasilense Sp245. Microbiology 155:1192–1202. 10.1099/mic.0.022541-0 [DOI] [PubMed] [Google Scholar]
- 93.Davies O, Mendes P, Smallbone K, Malys N. 2012. Characterisation of multiple substrate-specific (d)ITP/(d)XTPase and modelling of deaminated purine nucleotide metabolism. BMB Rep. 45:259–264. 10.5483/BMBRep.2012.45.4.259 [DOI] [PubMed] [Google Scholar]
- 94.Orino K, Lehman L, Tsuji Y, Ayaki H, Torti SV, Torti FM. 2001. Ferritin and the response to oxidative stress. Biochem. J. 357:241–247. 10.1042/0264-6021:3570241 [DOI] [PMC free article] [PubMed] [Google Scholar]
- 95.Wang Z, Zhang J. 2009. Abundant indispensable redundancies in cellular metabolic networks. Genome Biol. Evol. 1:23–33. 10.1093/gbe/evp002 [DOI] [PMC free article] [PubMed] [Google Scholar]
- 96.Justino MC, Vicente JB, Teixeira M, Saraiva LM. 2005. New genes implicated in the protection of anaerobically grown Escherichia coli against nitric oxide. J. Biol. Chem. 280:2636–2643. 10.1074/jbc.M411070200 [DOI] [PubMed] [Google Scholar]
- 97.Paget MS, Molle V, Cohen G, Aharonowitz Y, Buttner MJ. 2001. Defining the disulphide stress response in Streptomyces coelicolor A3(2): identification of the σR regulon. Mol. Microbiol. 42:1007–1020. 10.1046/j.1365-2958.2001.02675.x [DOI] [PubMed] [Google Scholar]
- 98.Volker U, Andersen KK, Antelmann H, Devine KM, Hecker M. 1998. One of two osmC homologs in Bacillus subtilis is part of the σB-dependent general stress regulon. J. Bacteriol. 180:4212–4218 [DOI] [PMC free article] [PubMed] [Google Scholar]
- 99.Faucher SP, Viau C, Gros PP, Daigle F, Le Moual H. 2008. The prpZ gene cluster encoding eukaryotic-type Ser/Thr protein kinases and phosphatases is repressed by oxidative stress and involved in Salmonella enterica serovar Typhi survival in human macrophages. FEMS Microbiol. Lett. 281:160–166. 10.1111/j.1574-6968.2008.01094.x [DOI] [PubMed] [Google Scholar]
- 100.Vercruysse M, Fauvart M, Jans A, Beullens S, Braeken K, Cloots L, Engelen K, Marchal K, Michiels J. 2011. Stress response regulators identified through genome-wide transcriptome analysis of the (p)ppGpp-dependent response in Rhizobium etli. Genome Biol. 12:R17. 10.1186/gb-2011-12-2-r17 [DOI] [PMC free article] [PubMed] [Google Scholar]
- 101.Coleman ST, Fang TK, Rovinsky SA, Turano FJ, Moye-Rowley WS. 2001. Expression of a glutamate decarboxylase homologue is required for normal oxidative stress tolerance in Saccharomyces cerevisiae. J. Biol. Chem. 276:244–250. 10.1074/jbc.M007103200 [DOI] [PubMed] [Google Scholar]
- 102.Kuczynska-Wisnik D, Matuszewska E, Furmanek-Blaszk B, Leszczynska D, Grudowska A, Szczepaniak P, Laskowska E. 2010. Antibiotics promoting oxidative stress inhibit formation of Escherichia coli biofilm via indole signalling. Res. Microbiol. 161:847–853. 10.1016/j.resmic.2010.09.012 [DOI] [PubMed] [Google Scholar]
- 103.Kleerebezem M, Crielaard W, Tommassen J. 1996. Involvement of stress protein PspA (phage shock protein A) of Escherichia coli in maintenance of the protonmotive force under stress conditions. EMBO J. 15:162–171 [PMC free article] [PubMed] [Google Scholar]
- 104.Nachin L, Nannmark U, Nystrom T. 2005. Differential roles of the universal stress proteins of Escherichia coli in oxidative stress resistance, adhesion, and motility. J. Bacteriol. 187:6265–6272. 10.1128/JB.187.18.6265-6272.2005 [DOI] [PMC free article] [PubMed] [Google Scholar]
- 105.Itoh K, Huang Z, Liu HW. 2007. Synthesis and analysis of substrate analogues for UDP-galactopyranose mutase: implication for an oxocarbenium ion intermediate in the catalytic mechanism. Org. Lett. 9:879–882. 10.1021/ol0631408 [DOI] [PMC free article] [PubMed] [Google Scholar]
- 106.Brinkkotter A, Shakeri-Garakani A, Lengeler JW. 2002. Two class II d-tagatose-bisphosphate aldolases from enteric bacteria. Arch. Microbiol. 177:410–419. 10.1007/s00203-002-0406-6 [DOI] [PubMed] [Google Scholar]
- 107.Tu X, Latifi T, Bougdour A, Gottesman S, Groisman EA. 2006. The PhoP/PhoQ two-component system stabilizes the alternative sigma factor RpoS in Salmonella enterica. Proc. Natl. Acad. Sci. U. S. A. 103:13503–13508. 10.1073/pnas.0606026103 [DOI] [PMC free article] [PubMed] [Google Scholar]
- 108.Battesti A, Bouveret E. 2006. Acyl carrier protein/SpoT interaction, the switch linking SpoT-dependent stress response to fatty acid metabolism. Mol. Microbiol. 62:1048–1063. 10.1111/j.1365-2958.2006.05442.x [DOI] [PubMed] [Google Scholar]
- 109.Gallagher JR, Prigge ST. 2010. Plasmodium falciparum acyl carrier protein crystal structures in disulfide-linked and reduced states and their prevalence during blood stage growth. Proteins 78:575–588. 10.1002/prot.22582 [DOI] [PMC free article] [PubMed] [Google Scholar]
- 110.Han MJ, Lee SY. 2006. The Escherichia coli proteome: past, present, and future prospects. Microbiol. Mol. Biol. Rev. 70:362–439. 10.1128/MMBR.00036-05 [DOI] [PMC free article] [PubMed] [Google Scholar]
- 111.Cao Z, Song P, Xu Q, Su R, Zhu G. 2011. Overexpression and biochemical characterization of soluble pyridine nucleotide transhydrogenase from Escherichia coli. FEMS microbiology letters 320:9–14. 10.1111/j.1574-6968.2011.02287.x [DOI] [PubMed] [Google Scholar]
- 112.Damveld RA, Franken A, Arentshorst M, Punt PJ, Klis FM, van den Hondel CA, Ram AF. 2008. A novel screening method for cell wall mutants in Aspergillus niger identifies UDP-galactopyranose mutase as an important protein in fungal cell wall biosynthesis. Genetics 178:873–881. 10.1534/genetics.107.073148 [DOI] [PMC free article] [PubMed] [Google Scholar]
- 113.Deshpande N, Addess KJ, Bluhm WF, Merino-Ott JC, Townsend-Merino W, Zhang Q, Knezevich C, Xie L, Chen L, Feng Z, Green RK, Flippen-Anderson JL, Westbrook J, Berman HM, Bourne PE. 2005. The RCSB Protein Data Bank: a redesigned query system and relational database based on the mmCIF schema. Nucleic Acids Res. 33:D233–D237. 10.1093/nar/gki057 [DOI] [PMC free article] [PubMed] [Google Scholar]
- 114.Kirchmair J, Markt P, Distinto S, Schuster D, Spitzer GM, Liedl KR, Langer T, Wolber G. 2008. The Protein Data Bank (PDB), its related services and software tools as key components for in silico guided drug discovery. J. Med. Chem. 51:7021–7040. 10.1021/jm8005977 [DOI] [PubMed] [Google Scholar]
Associated Data
This section collects any data citations, data availability statements, or supplementary materials included in this article.