The same hexagonal array of archaerhodpsin-2 trimers as observed in the native membrane is reconstituted in a three-dimensional crystal prepared by the membrane fusion method. In this crystal, a pair of conserved glutamate residues in the proton-release pathway is maintained by a low-barrier hydrogen bond.
Keywords: archaerhodopsin-2, light-driven proton pump
Abstract
Archaerhodopsin-2 (aR2), the sole protein found in the claret membrane of Halorubrum sp. Aus-2, functions as a light-driven proton pump. In this study, structural analysis of aR2 was performed using a novel three-dimensional crystal prepared by the successive fusion of claret membranes. The crystal is made up of stacked membranes, in each of which aR2 trimers are arranged on a hexagonal lattice. This lattice structure resembles that found in the purple membrane of H. salinarum, except that lipid molecules trapped within the trimeric structure are not distributed with perfect threefold symmetry. Nonetheless, diffraction data at 1.8 Å resolution provide accurate structural information about functionally important residues. It is shown that two glutamates in the proton-release channel form a paired structure that is maintained by a low-barrier hydrogen bond. Although the structure of the proton-release pathway is highly conserved among proton-pumping archaeal rhodopsins, aR2 possesses the following peculiar structural features: (i) the motional freedom of the tryptophan residue that makes contact with the C13 methyl group of retinal is restricted, affecting the formation/decay kinetics of the L state, and (ii) the N-terminal polypeptide folds into an Ω-loop, which may play a role in organizing the higher-order structure.
1. Introduction
Since the light-driven proton pump bacteriorhodopsin was discovered in the cell membrane of Halobacterium salinarum (Oesterhelt & Stoeckenius, 1971 ▶), a large number of proton-pumping rhodopsins have been found in diverse species, including archaea, eubacteria, fungi and algae (Ihara et al., 1999 ▶; Waschuk et al., 2005 ▶; Spudich et al., 2014 ▶). To date, nine proton-pumping rhodopsins [i.e. archaerhodopsin-1 and archaerhodopsin-2; (aR1 and aR2; Enami et al., 2006 ▶; Yoshimura & Kouyama, 2008 ▶), acetabularia rhodopsin II (Wada et al., 2011 ▶), bacteriorhodopsin (bR; Essen et al., 1998 ▶; Pebay-Peyroula et al., 1997 ▶; Sato et al., 1999 ▶; Faham & Bowie, 2002 ▶), cruxrhodopsin-3 (cR3; Chan et al., 2014 ▶), deltarhodopsin-3 (dR3; Zhang et al., 2013 ▶), proteorhodopsin (Gushchin et al., 2013 ▶; Ran et al., 2013 ▶) and xanthorhodopsin (Luecke et al., 2008 ▶)] have been crystallized and their structural data have enabled the discussion of a common structural motif that is relevant to the proton-pumping activity (Kouyama & Murakami, 2010 ▶; Ernst et al., 2014 ▶).
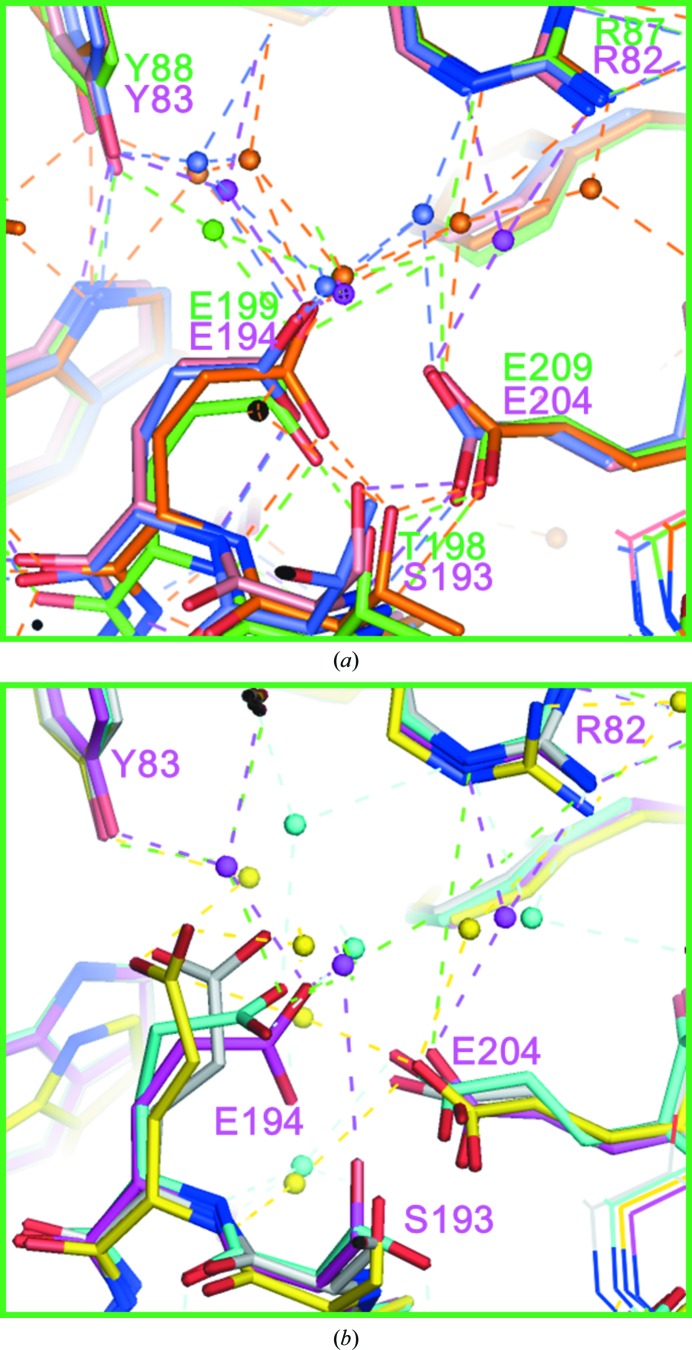
Interestingly, the diffraction data from three-dimensional crystals of bR, aR2, cR3 and dR3 that were prepared by the membrane-fusion method have shown that at neutral pH two glutamates in the proton-release channel form a paired structure (Fig. 1 ▶ a). On the basis of the pH dependence of the protein structure, it has been argued that the paired structure of Glu194 and Glu204 in bR is maintained by a low-barrier hydrogen bond (Okumura et al., 2005 ▶). This argument has been supported by a recent theoretical study (Phatak et al., 2008 ▶). Since the paired structure of Glu194 and Glu204 in bR is broken during the proton-pumping cycle, it has been suggested that the Glu194/Glu204 pair functions as a proton-release complex (Takeda et al., 2004 ▶; Yamamoto et al., 2009 ▶). On the other hand, structural models of bR determined using different crystal forms have suggested that the conformation of the proton-release channel is sensitive to the crystallization procedure (Fig. 1 ▶ b). In an orthorhombic crystal (space group C2) that was prepared by the epitaxial growth method, the side chain of Glu194bR is directed towards Tyr83bR (Essen et al., 1998 ▶). In a P63 crystal that was prepared by embedding the membrane protein in a cubic phase of monooleic acid, the side chain of Glu194bR is hydrogen-bonded to Ser193bR OH (Luecke, 2000 ▶). This configuration is distinct from that found in the P622 crystal of bR at neutral pH, in which Glu194bR is hydrogen-bonded to the backbone amide NH of the same residue (Okumura et al., 2005 ▶). Since the lipid component (for example, triglycolipid) observed in the P622 crystal is partially removed or missing in the other crystal forms (Belrhali et al., 1999 ▶), it is possible that the conformation of the functionally important region is influenced by the lipid–protein interactions. Their influence cannot be ignored in discussion of the structural changes that occur during the proton-pumping cycle. For example, there is a significant difference among the reported structural models of the L state (Royant et al., 2001 ▶; Kouyama et al., 2004 ▶; Lanyi, 2005 ▶). For a better understanding of the proton-pumping mechanism, it is important to accumulate structural data on other proton-pumping rhodopsins using high-quality three-dimensional crystals.
Figure 1.
(a) The structure of the proton-release channel observed for the neutral purple form of bR in the P622 crystal (purple; PDB entry 1iw6; Matsui et al., 2002 ▶) is compared with those observed for aR2 in the P321 crystal (green; PDB entry 2ei4; Yoshimura & Kouyama, 2008 ▶), cR3 in the P321 crystal (orange; PDB entry 4jr8; Chan et al., 2014 ▶) and dR3 in the R32 crystal (blue; PDB entry 4fbz; Zhang et al., 2013 ▶). (b) The structure of the proton-release channel observed for the neutral purple form of bR in the P622 crystal (purple) is compared with those observed for the alkaline pink form of bR in the P622 crystal (yellow; PDB entry 1xok; Okumura et al., 2005 ▶), bR in the C2 crystal (PDB entry 1brr; Essen et al., 1998 ▶) and bR in the P63 crystal (PDB entry 1qhj; Belrhali et al., 1999 ▶).
Archaerhodopsin-2 (aR2) is a light-driven proton pump that is found in the cell membrane of Halorubrum sp. Aus-2 (Uegaki et al., 1991 ▶). The sequence identity among members of the archaerhodopsin family is high (>90%; Mukohata et al., 1991 ▶; Ihara et al., 1999 ▶), whereas the amino-acid sequences of all members of the aR family are distinct from those of proton-pumping rhodopsins with known structure (i.e. the sequence identities are less than 50%). In previous studies, aR2 was crystallized as three-dimensional crystals belonging to space groups C2221 (Enami et al., 2006 ▶), P321 and P63 (Yoshimura & Kouyama, 2008 ▶). In the P321 and P63 crystals aR2 assembles into a trimeric structure with bacterioruberin bound to the inter-subunit crevice. This trimeric structure is destroyed in the C2221 crystal. Comparison of the structures of aR2 in these crystal forms revealed that the conformation of the extracellular end of helix C is greatly altered upon removal of the lipid component interacting with helix C. It would be interesting to investigate how much the structures of the photoreaction intermediates are affected by the protein packing or the protein–lipid interactions. Unfortunately, the previously reported three-dimensional crystals of aR2 were merohedrally twinned, making it difficult to analyze the possible effects of light-induced structural changes in aR2.
In this study, we have applied the membrane-fusion method to prepare a novel three-dimensional crystal of aR2. This crystal is made up of membranous layers, in each of which the aR2 trimers are arranged on a hexagonal lattice. Compared with the previously reported crystal forms of aR2, the new crystal has several advantages: (i) it diffracts X-rays to a higher resolution, (ii) the problem of crystal twinning is avoided and (iii) the hexagonal array as seen in the native claret membrane is reconstituted in the crystal. Owing to these properties, the new crystal provided accurate structural information about functionally important residues. It is shown that two glutamates (Glu199 and Glu209) in the proton-release channel are separated by a very short distance (2.3 Å). This result suggests that their paired structure is maintained by a low-barrier hydrogen bond. Meanwhile, flash-induced absorption changes in aR2 showed that the K state decayed directly to the M state; i.e. the L state was undetected in the photocycle of aR2. On the basis of these newly obtained structural and absorption kinetics data for aR2, we discuss possible structural factors affecting the photoreaction kinetics and the higher-order structure of proton-pumping rhodopsin.
2. Materials and methods
2.1. Preparation and crystallization of archaerhodopsin-2
Claret membrane containing archaerhodopsin-2 was isolated from Halorubrum sp. Aus-2 and purified according to a previously described procedure (Enami et al., 2006 ▶). For the crystallization of aR2, a mixture consisting of claret membrane (∼3 mg ml−1), 5 mg ml−1 nonylglucoside, 1 M ammonium sulfate, 0.08 M sodium chloride, 0.04 M sodium azide and 0.04 M HEPES pH 7 was slowly concentrated by the sitting-drop vapour-diffusion method using 0.5 ml 2.2–2.8 M ammonium sulfate, ∼0.1 M sodium citrate pH 7 as a reservoir solution. Incubation at 15°C for approximately one month yielded hexagonal rod crystals with typical dimensions of 50 × 50 × 200 µm.
2.2. Measurement of absorption kinetics
Transient transmission data from aR2 in claret membranes were acquired using a frequency-doubled Nd-YAG laser as described previously (Hayakawa et al., 2008 ▶). The absorption kinetics measured at various wavelengths were analyzed using the singular value decomposition method (Chizhov et al., 1996 ▶).
2.3. Data collection, scaling and refinement
For X-ray diffraction measurements, a single crystal was picked up and soaked in a post-crystallization solution consisting of 2.2 M ammonium sulfate, 0.1 M HEPES pH 7, 30% trehalose for ∼10 min; subsequently, the crystal was flash-cooled in dim light with liquid propane at its melting temperature. X-ray diffraction data were collected on beamline BL38B1 at SPring-8, where a crystal kept at 100 K was exposed to a monochromatic X-ray beam at a wavelength of 1.0 Å with an X-ray flux rate of ∼2 × 10¹² photons mm−2 s−1. Diffraction data were collected using an oscillation range of 1° and an X-ray flux of ∼1 × 10¹³ photons mm−2 per image. Indexing and integration of diffraction spots were carried out using MOSFLM 6.1 (Steller et al., 1997 ▶). The scaling of data was accomplished using SCALA in the CCP4 program suite (Winn et al., 2011 ▶). Structural analysis was performed with CNS (Brünger et al., 1998 ▶), REFMAC5 (Murshudov et al., 2011 ▶) and XtalView (McRee, 1993 ▶). The structure of aR2 in the P321 crystal (PDB entry 2ei4) was used as an initial model. After rotational and translational searching with MOLREP (Vagin & Teplyakov, 2010 ▶), water and lipid molecules were added on the basis of the 2F o − F c map and the structure was refined by several cycles of simulated-annealing and individual B-factor refinements. The final refinement of the protein structure using REFMAC5 resulted in an R cryst of 21.4% and an R free of 23.4% (Table 1 ▶).
Table 1. Data-collection and final refinement statistics.
| Data collection | ||
| Space group | C2 | H32 |
| Resolution (Å) | 45.1–1.8 (1.85–1.80) | 45.1–1.8 (1.90–1.80) |
| Unit-cell parameters | ||
| a (Å) | 108.6 | 62.74 |
| b (Å) | 62.7 | 62.74 |
| c (Å) | 116.3 | 331.45 |
| α (°) | 90.0 | 90.0 |
| β (°) | 108.1 | 90.0 |
| γ (°) | 90.0 | 120.0 |
| No. of unique reflections | 62577 (10063) | 21944 (3462) |
| Multiplicity | 3.2 (3.2) | 8.8 (9.0) |
| Data completeness (%) | 90.7 (100) | 91.3 (100) |
| R merge † (%) | 4.6 (45.1) | 5.4 (50.0) |
| 〈I/σ(I)〉 | 17.3 (3.2) | 28.5 (5.1) |
| Mosaicity (°) | 0.50 | 0.48 |
| Refinement | ||
| Resolution limit (Å) | 15.0–1.8 | 15.0–1.8 |
| Protein residues | 234 × 3 | 1–234 |
| No. of lipids | 13 | 5 |
| No. of waters | 155 | 51 |
| R cryst ‡ (%) | 20.4 | 21.1 |
| R free (%) | 22.7 | 24.1 |
| R.m.s.d. | ||
| Bond lengths (Å) | 0.019 | 0.018 |
| Bond angles (°) | 1.95 | 2.03 |
| B factor (Å2) | ||
| Protein | 23.5 | 23.5 |
| Water | 36.7 | 36.9 |
| Lipids | 58.6 | 60.2 |
R
merge = 
 , where I
i(hkl) is the intensity of an individual reflection and 〈I(hkl)〉 is the mean intensity obtained from multiple observations of symmetry-related reflections.
R
cryst = 
 . A randomly omitted 5% of the reflections were used for the calculation of R
free.
3. Results
3.1. Crystal packing
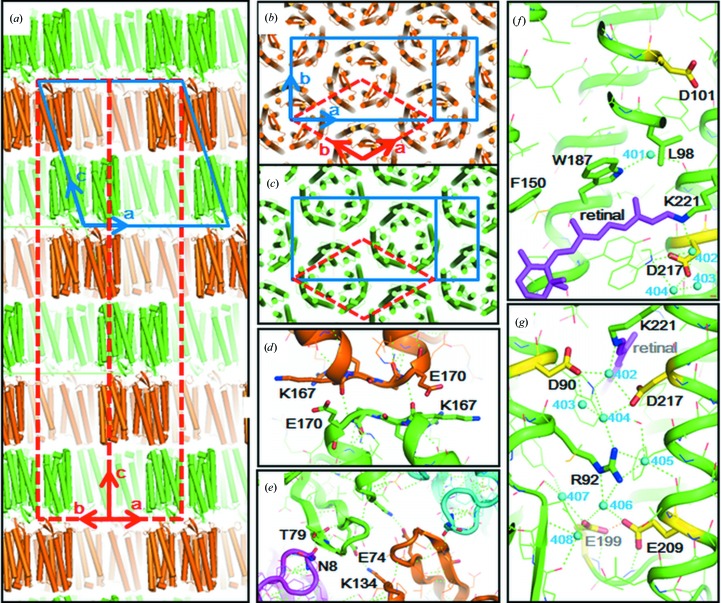
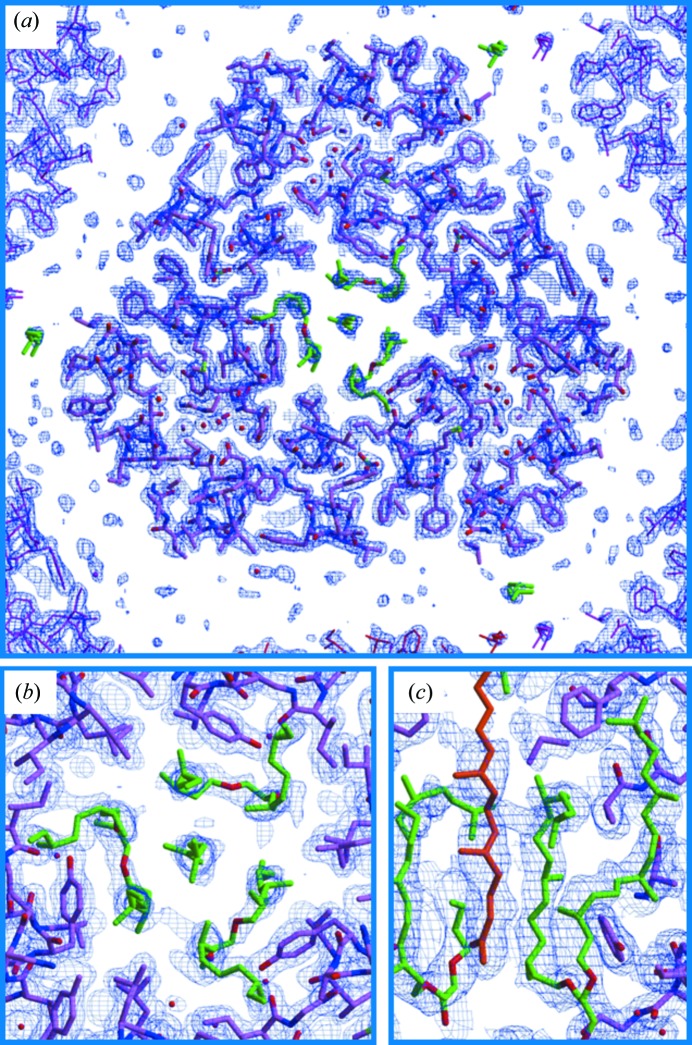
In the first approach to model building, the crystal was presumed to belong to space group C2, with unit-cell parameters a = 108.6, b = 62.7, c = 116.3 Å, α = 90, β = 108.1, γ = 90° (blue solid lines in Figs. 2 ▶ a and 2 ▶ b). In this space group, the asymmetric unit contains three subunits of aR2 (i.e. one trimer). The side view of the unit cell shows that the crystal is composed of membranous layers (Fig. 2 ▶ a). In each membranous layer, aR2 trimers are arranged on a hexagonal lattice with a cell dimension of 62.7 Å (Fig. 2 ▶ b). At first sight, it appeared that there was no structural difference among the three protein molecules in the asymmetric unit, each of which was folded into seven transmembrane helices (helices A–G), an Ω-loop in the N-terminal region (Asn5–Pro12) and a β-sheet at the BC loop. However, close investigation of the electron-density map showed that the lipid molecules trapped within the aR2 trimer were not distributed with perfect threefold symmetry (Fig. 3 ▶). Specifically, a hydrocarbon chain (possibly squalene) is positioned at the centre of the trimer, breaking the threefold symmetry. Although its extracellular half with an extended conformation is surrounded by three diphytanyl chains, the cytoplasmic half is disordered. Disorder was also observed for other lipids filling the inter-trimer space and the side chains of arginine residues (Arg34 and Arg230) that can interact with negatively charged lipid head groups. Strictly speaking, we need to postulate that the three subunits in each trimer adopt slightly different conformations. However, the structural differences among these subunits would be difficult to analyze unless all of the trimers within a membranous layer have the same in-membrane orientation. In the current model building in space group C2 only the trimeric structure that is averaged over three possible in-membrane orientations can be analyzed.
Figure 2.
(a, b, c) Protein packing in the hexagonal crystal of aR2 used in this study. The protein arrangement is described by space group H32 (red broken lines) or C2 (solid blue lines). (d) Intermembrane protein–protein contacts on the cytoplasmic side. (e) Intermembrane protein–protein contacts on the cytoplasmic surface. (f, g) Distribution of water molecules (cyan spheres) in proton-uptake and proton-release channels.
Figure 3.
A 2F o − F c map contoured at 1.4σ (a) or 0.8σ (b, c) is superimposed on the structural model that was built in space group C2. Lipid molecules trapped in the central opening (the extracellular side) of the aR2 trimer are shown in green or brown.
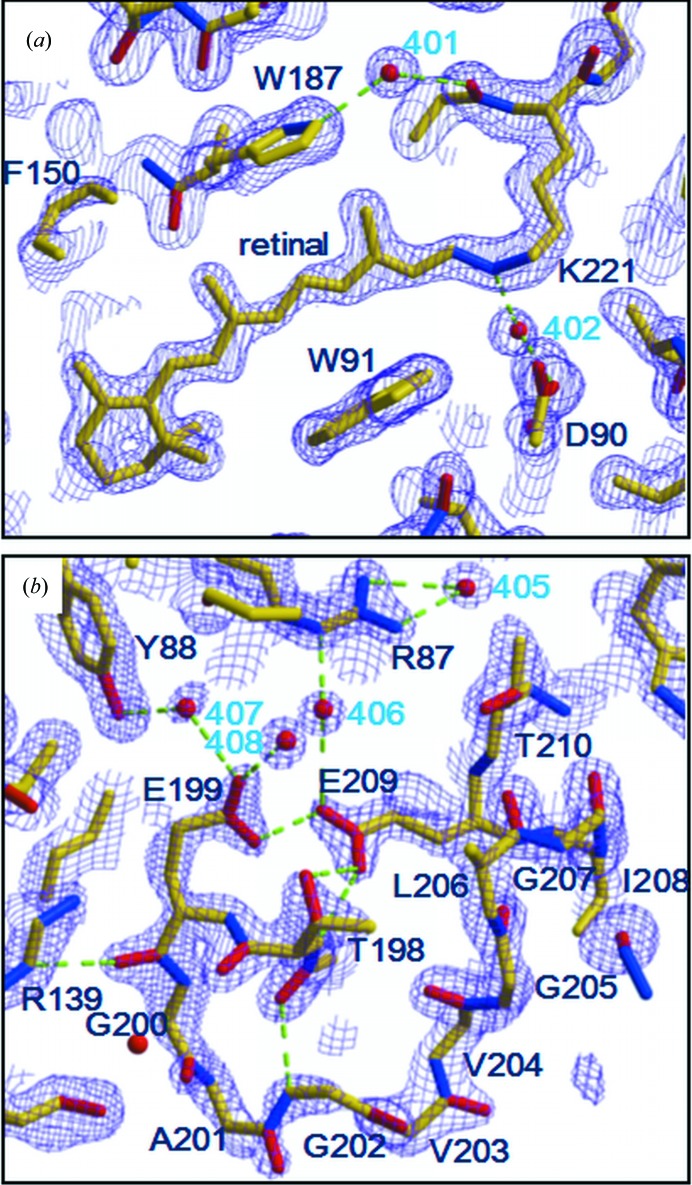
In the second approach to model building, the crystal used in this study was assumed to belong to space group H32, with unit-cell parameters a = b = 62.7, c = 331.5 Å, α = 90, β = 90, γ = 120° (red broken lines in Figs. 2 ▶ a, 2 ▶ b and 2 ▶ c). In space group H32, one subunit of aR2 is contained in the asymmetric unit; i.e. the aR2 trimer is supposed to have perfect threefold symmetry. It should be pointed out that the structural model constructed on the assumption of space group H32 is equivalent to the averaged structure of the three subunits that are contained in the asymmetric unit of space group C2. Indeed, there was no essential difference between the structural models constructed by the above two approaches. In the following discussion, we describe the structural model built in space group H32, which provides more accurate structural information about the functionally important residues (Fig. 4 ▶). Hereafter, the hexagonal crystal investigated in this study will be called the H32 crystal.
Figure 4.
2F o − F c maps around the retinal chromophore (a) and the FG loop (b) contoured at 1.6σ are superimposed on the structural model that was built in space group H32.
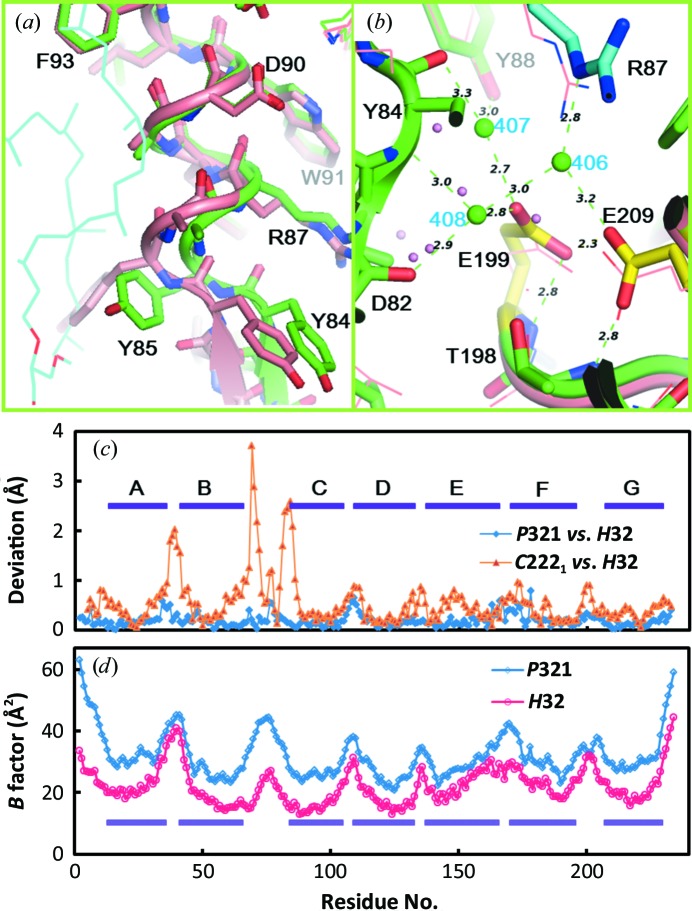
Since the membranous layers in the H32 crystal are piled up with alternate orientations, there are two types of intermembrane protein–protein contacts. On the extracellular side, the BC loop interacts with the DE loop of one of the neighbouring proteins and the N-terminal region of another neighbouring protein (Fig. 2 ▶ d). On the cytoplasmic side, the EF loop contacts the EF loop of the protein opposite (Fig. 2 ▶ e). The structure of the protein–protein contact region is slightly different from that observed in the P321 crystal, in which the aR trimers are piled up directly along the c axis (Yoshimura & Kouyama, 2008 ▶). A more significant difference is that the B factors of the main-chain atoms in the extracellular halves of helices A, B, C and D are much lower in the H32 crystal than in the P321 crystal (Fig. 5 ▶ d). It is suggested that the motional freedom of these regions is suppressed by the inter-membrane protein–protein contacts in the H32 crystal. On the other hand, relatively higher B factors are observed for the main-chain atoms in the cytoplasmic halves of helices E and F. This result suggests that the intermembrane protein–protein interaction at the EF loop is weak. It is unlikely that this interaction is a major factor in determining the cell dimension of the hexagonal lattice.
Figure 5.
The structures of the extracellular half of helix C (a) and the proton-release channel (b) of aR2 in the H32 crystal (purple, yellow and cyan) are compared with those observed in the C2221 crystal (salmon; PDB entry 1vgo; Enami et al., 2006 ▶). (c) Structural differences between the H32 crystal and the P321 crystal (PDB entry 2ei4; blue; Yoshimura & Kouyama, 2008 ▶) and between the H32 crystal and the C2221 crystal (orange). The deviation of the Cα atom is plotted against the residue number. (d) The B factors observed in the H32 crystal (magenta) and the P321 crystal (blue). The B factor of the Cα atom is plotted against the residue number.
It has been reported that in freshly prepared claret membrane the aR2 trimers are arranged in a hexagonal lattice with a cell dimension of 63.3 Å at room temperature (Yoshimura & Kouyama, 2008 ▶). This cell dimension is nearly identical to that (62.7 Å) of the hexagonal lattice found in the H32 crystal. (The small difference may be owing to shrinkage of the hexagonal lattice at the cryogenic temperature.) Thus, it appears possible that successive fusion of native claret membranes in the pre-crystallization solution yields flat sac-like structures that are then piled up in the crystal-growth phase.
In many respects, the membranous structure found in the H32 crystal resembles the purple membrane of H. salinarum. Firstly, the centre-to-centre distance (62.7 Å) between neighbouring aR2 trimers is similar to the cell dimension (62.45 Å) of the hexagonal lattice in the purple membrane (Grigorieff et al., 1996 ▶). Secondly, the in-membrane orientation of the aR2 trimer is identical to that of the bR trimer in the purple membrane. This similarity can be explained by taking into account the outline of the trimeric structure on the extracellular side, which is approximated by a truncated triangle. Since there is no direct protein–protein interaction between neighbouring trimers in the same membrane (Fig. 3 ▶), it is rational to suppose that the lipid molecules filling the inter-trimer space play an important role in maintaining the two-dimensional hexagonal arrays of the aR2 or bR trimer. It was observed, however, that most of the lipid molecules filling the inter-trimer space were apparently disordered. One possible explanation for such disorder is that claret membrane contains a special lipid component that destroys the local threefold symmetry. Such a lipid distribution may be effective at creating a flexible lipid environment that may be necessary for the protein to undergo large structural changes during the proton-pumping cycle.
3.2. Structure of the proton-release channel
The high-resolution diffraction data from the H32 crystal allowed us to accurately determine the conformations of two glutamates (Glu199 and Glu209) present in the proton-release channel (Fig. 2 ▶ g). When the structural model was refined using REFMAC5, the distance between Glu199 OE2 and Glu209 OE1 was determined to be 2.3 Å (Fig. 5 ▶ b). (A slightly longer distance was evaluated when the structure was refined by CNS with default parameters.) This short distance suggests that the paired structure of Glu199 and Glu209 is maintained by a low-barrier hydrogen bond. Glu199 OE2 is directed towards the main-chain amide NH of the same residue. This conformation of Glu199 is nearly identical to that observed in the P321 or P63 crystal (Fig. 1 ▶ a). When the protein structure in the H32 crystal is compared with that found in the C2221 crystal, however, a significant difference is observed in the proton-release channel (Figs. 5 ▶ a and 5 ▶ b). Namely, the extracellular end of helix C moves outwards when the lipid distribution around the protein is disturbed during the crystallization process of the C2221 crystal. It appears that the proton-release channel takes on a closed conformation as long as the extracellular end of helix C interacts with the diphytanyl group of the native lipid that fills the central opening of the aR2 trimer.
3.3. Structure of the retinal-binding pocket
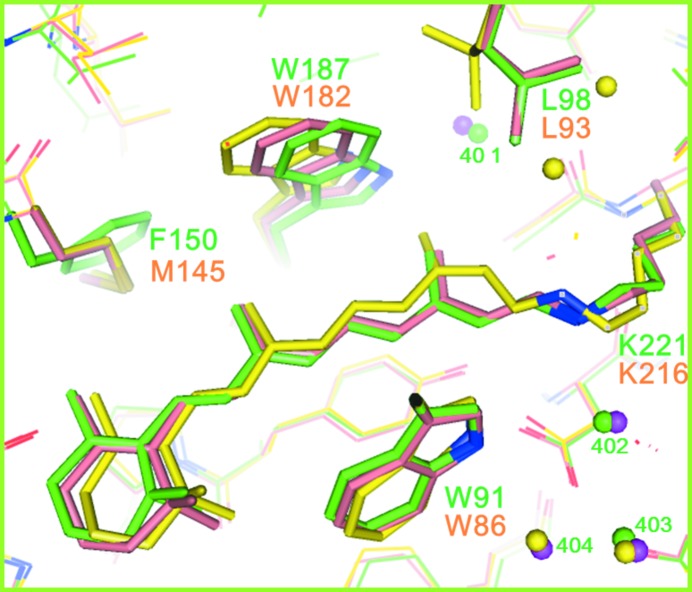
The retinal chromophore bound to the ∊-amino group of Lys220aR2 in helix G adopts the all-trans configuration. Although most residues in the retinal-binding pocket are highly conserved in proton-pumping archaeal rhodopsins, Met145 in bR is replaced by phenylalanine (Phe150) in aR2. Owing to this replacement, the polyene chain of retinal adopts a less curved conformation in aR2 than in bR (Fig. 6 ▶). This difference can explain the large blue shift in the visible absorption band of retinal (λmax ≃ 550 nm in aR2 versus λmax ≃ 570 nm in bR).
Figure 6.
The structure of aR2 in the H32 crystal (green) is compared with those of the unphotolyzed state (salmon; PDB entry 1iw6; Matsui et al., 2002 ▶) and the L state (yellow; PDB entry 1ucq; Kouyama et al., 2004 ▶) of bR.
Another effect of the Met145bR→Phe150aR2 replacement is seen as a noticeable shift in the indole ring of the tryptophan residue (Trp182bR, Trp187aR2) in contact with the C13 methyl group of retinal towards helix G. Previous structural analysis of the K and L states of bR have shown that the relaxation of retinal into a planar 13-cis configuration in the K-to-L transition is accompanied by a noticeable movement in the indole ring of Trp182bR towards Met145bR and a large rotation of the side chain of Leu93bR (Fig. 6 ▶, model shown in yellow; Matsui et al., 2002 ▶; Kouyama et al., 2004 ▶). It is noteworthy that in aR2 the motional freedom of the tryptophan residue (Trp187aR2) in contact with the C13 methyl of retinal is reduced by the Met145bR→Phe150aR2 replacement. Thus, it would be expected that the K-to-L transition is slowed down in aR2. To examine this possibility, we measured the absorption kinetics of aR2 under various solvent conditions.
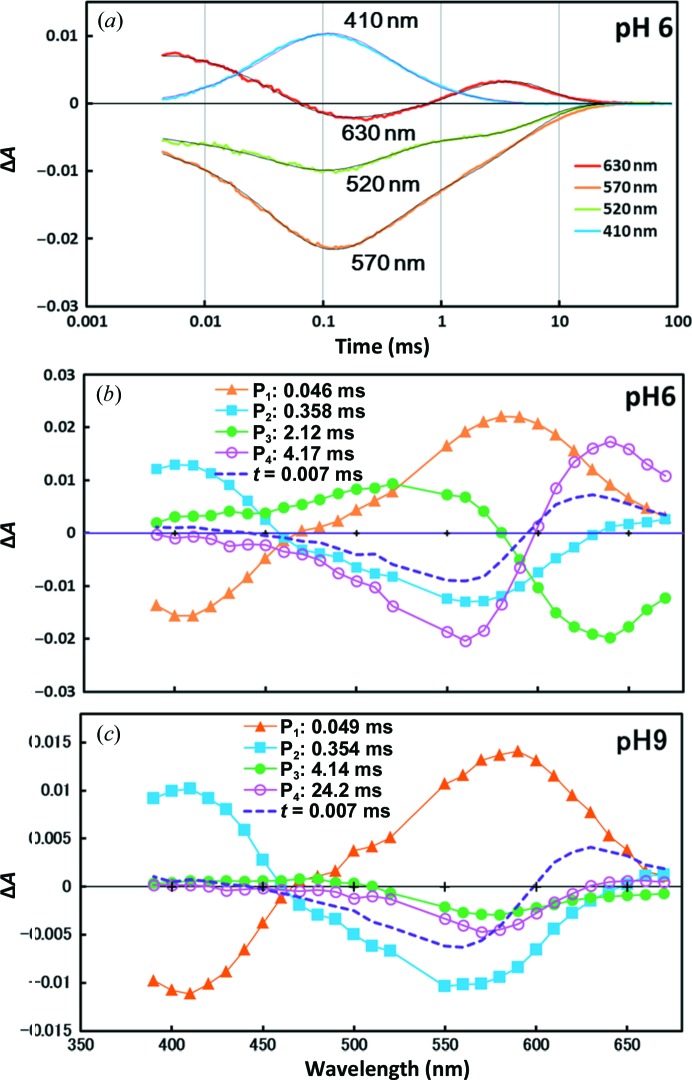
Fig. 7 ▶ shows the flash-induced absorption changes in aR2 observed in an aqueous suspension of claret membrane. At pH 6, the absorption kinetics data were fitted with four exponential components. The difference spectrum associated with the P1 component exhibits a positive peak at 580 nm and a negative peak at 410 nm, suggesting that the K state decays directly into the M state. This transition is followed by the M-to-N transition (the P2 component with a positive peak at 410 nm and a negative peak around 560 nm), the N-to-O transition (the P3 component with a positive peak at 520 nm and a negative peak at 640 nm) and the process of recovering the initial state (the P4 component with a positive peak at 640 nm and a negative peak at 560 nm). At a higher pH (e.g. at pH 9) the decay rate of N became lower, making it difficult to separately describe the decay kinetics of the N and O states. Meanwhile, the decay kinetics of the K and M states remained unaltered over a wide pH range (pH 5–9). Under the investigated solvent conditions, the photocycle of aR2 can be described by the scheme K→M→N→O→aR2.
Figure 7.
Flash-induced absorption changes in aR2 at pH 6 (a, b) and pH 9 (c). (a) An aqueous suspension of claret membranes was excited with light pulses at 532 nm and absorption changes were recorded at various wavelengths. (b, c) The absorption kinetics in the time range from 0.003 to 90 ms were fitted with four components and the amplitude of each component was plotted against the wavelength of the light used for measurement. The dashed line represents the absorption change observed ∼7 µs after the excitation.
Compared with the photocycle of bR (K→L→M→N→O→bR; Lozier et al., 1992 ▶), the photoreaction of aR2 is peculiar in that the L state is not detected. It is noteworthy that the lifetime of the K state of aR2 (∼40 µs) is much longer than that observed in bR (∼1 µs). It is probable that the L state is undetectable because the decay rate of L is much higher than the decay rate of K. Together with the crystallographic data, the absorption kinetics data suggest that the L state is destabilized when the structure in the cytoplasmic vicinity of retinal is made rigid.
3.4. Structure of the N-terminal polypeptide
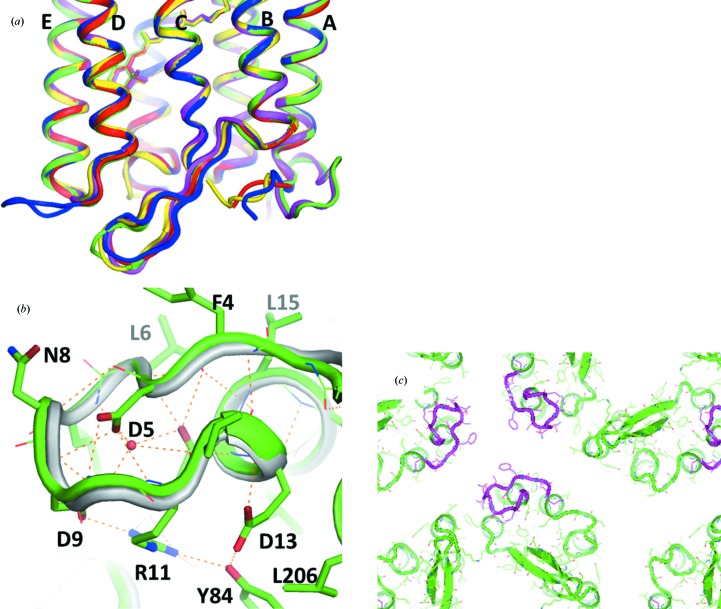
Compared with other proton-pumping rhodopsins, the structure of aR2 is peculiar in that its N-terminal polypeptide (Phe4–Pro12) folds into an Ω-loop (Fig. 8 ▶ b). This loop structure is maintained by hydrogen bonds between the side chain of Asp5 and the main-chain amide NH atoms of three residues (Asn8, Asp9 and Gly10; Fig. 8 ▶ b). The side chain of Arg11 (and Glu13 at the extracellular end of helix A) interacts with Tyr84, which is located at the cytoplasmic end of helix C. This interaction contributes to fixation of the Ω-loop.
Figure 8.
(a) Structural comparison of aR2 in the H32 crystal (green), bR in the P622 crystal (orange; PDB entry 1iw6; Matsui et al., 2002 ▶), cR3 in the P321 crystal (blue; PDB entry 4jr8; Chan et al., 2014 ▶) and dR3 in the R32 crystal (yellow; PDB entry 4fbz; Zhang et al., 2013 ▶). (b) The N-terminal region of aR2 in the H32 crystal (green) is compared with that of aR1 in the P43212 crystal (grey; PDB entry 1uaz; Enami et al., 2003 ▶). (c) The outline of the inter-trimer space in the hexagonal lattice found in the H32 crystal of aR2, viewed from the extracellular side. The N-terminal region of aR2 is shown in magenta.
The structure of the N-terminal polypeptide in the H32 crystal is nearly identical to that observed in the P321 or P63 crystals, in which the aR2 trimers are packed in different fashions (Yoshimura & Kouyama, 2008 ▶). This suggests that the structure of the Ω-loop is strongly built, although the B factors of the main-chain atoms are high unless the wobbling motion of the Ω-loop is suppressed by protein–protein interactions. It is noteworthy that the amino-acid sequence in the Ω-loop is highly conserved among members of the archaerhodopsin family (Mukohata et al., 1991 ▶; Ihara et al., 1999 ▶). Indeed, the N-terminal region of aR1 folds into the same Ω-loop as observed in aR2 (Enami et al., 2006 ▶). Since this loop interacts with the extracellular end of helix C, it seems possible that this loop may play a role in stabilizing the native conformation of the proton-release channel.
It has previously been proposed that the segregation of membrane proteins in biological membranes can be explained by a hydrophobic matching principle related to the difference in lipid bilayer hydrophobic thickness and protein hydrophobic length (Sabra & Mouritsen, 1998 ▶). It is noteworthy that in the H32 crystal the side chains of hydrophobic residues (Phe4 and Leu6) in the N-terminal region of aR2 are directed towards a crystallographic threefold axis (Fig. 8 ▶). These residues contribute to a substantial increase in protein hydrophobic length. This peculiar structural feature may confer aR2 with a high ability to assemble into a two-dimensional crystalline array. Indeed, it was observed that aR2-containing claret membrane was reluctant to disassemble in the presence of 50 mM nonylglucoside at 30°C, whereas the purple membrane of H. salinarum was completely solubilized under the same condition.
4. Discussion
It is shown here that two glutamates (Glu199aR2 and Glu209aR2) in the proton-release channel form a paired structure that is maintained by a low-barrier hydrogen bond. This same conformation of the proton-release complex has been observed in the P622 crystal of bR, the P321 crystal of cruxrhodopsin-3 and the R32 crystal of deltarhodopsin-3, all of which were prepared by the membrane-fusion method (Okumura et al., 2005 ▶; Yoshimura & Kouyama, 2008 ▶; Zhang et al., 2013 ▶; Chan et al., 2014 ▶). It has been reported that the P622 crystal of bR has an absorption peak at 568 nm in the neutral pH range (pH 4–9), whereas alkalization above pH 9.5 causes a noticeable blue shift of the visible absorption band (Okumura et al., 2005 ▶). Diffraction data from the P622 crystal soaked at high pH levels have shown that the alkaline transition is accompanied by reorientation of the carboxyl group of Glu194bR towards Tyr83bR (Fig. 1 ▶ b). It is interesting to note that the conformation of Glu194bR in the alkaline pink conformer is very similar to that observed in the C2 crystal of bR (Fig. 1 ▶ b). This similarity suggests that the transition to the alkaline pink conformer occurs at a much lower pH in the C2 crystal than in the P622 crystal. It is conceivable that the neutral purple form of bR is destabilized when the local pH at the membrane surface is substantially increased by the partial removal of negatively charged native lipids. In fact, the lipid component (for example triglycolipid) observed in the P622 crystal is partially removed or missing in other crystal forms. It has been reported that the neutral purple form is destabilized in bR-containing vesicles reconstituted with egg lethicin, in which the transition from the neutral purple form into an inactive red form with λmax at 480 nm takes place at pH 6.5 (Nasuda-Kouyama et al., 1990 ▶).
With respect to the protein structure in the P63 crystal, Glu194 OE2 in the structural model solved at 1.55 Å resolution (PDB entry 1c3w) has an unusually large B factor (62 Å2; Luecke et al., 1999 ▶). (The B factor of Glu199 OE2 of aR2 in the H32 crystal is 31 Å2.) It is possible that the conformation of Glu194bR in the P63 crystal represents a mixed state between the neutral purple form and the alkaline pink form. There is another caveat to the structural model of bR that was built using the P63 crystal. Although the model building was performed on the supposition that the lipid molecules filling the intra-trimer or inter-trimer space are distributed with threefold symmetry, this supposition may not be correct. In fact, the lipid head groups are not included in any reported model of bR determined using the P63 crystal. For example, three triglycolipids are shown to bind to the central opening of the bR trimer in the P622 crystal, whereas this lipid component is missing in the P63 crystal. Since a step of protein solubilization is included in the preparation procedure of the P63 crystal, it is likely that the lipid distribution around the protein is altered at a pre-crystallization stage.
If the Glu194/Glu204 paired structure is already broken in the unphotolyzed state, the energetic barrier to a light-induced structural change in the proton-release channel would be lowered. It has been reported that the rising rate of the M state of bR is much higher in the P63 crystal than in native purple membrane or the P622 crystal (Royant et al., 2001 ▶; Yamamoto et al., 2009 ▶). Therefore, it is not surprising to find that the L state generated in the P63 crystal is structurally different from that observed in the P622 crystal (Royant et al., 2000 ▶; Kouyama et al., 2004 ▶; Lanyi & Schobert, 2003 ▶). For example, a large swing of the side chain of Arg82 towards Glu194 is seen in the former model, whereas this swing is not seen in the latter model. Instead, the K-to-L transition in the P622 crystal is accompanied by a large structural change in the cytoplasmic vicinity of retinal, including a noticeable movement of the indole ring of Trp182bR towards Met145bR. This light-induced structural change is in line with the present observation that the L state is destabilized when the motional freedom of the tryptophan in contact with the C13 methyl group is reduced by the Met145bR→Phe150aR2 replacement (Fig. 6 ▶).
Supplementary Material
PDB reference: archaerhodopsin-2, 3wqj
Acknowledgments
We thank the staff of BL38B1 at SPring-8, Harima, Japan for technical assistance during data collection. This work was supported by a grant-in-aid from the Ministry of Education, Science and Culture of Japan.
References
- Belrhali, H., Nollert, P., Royant, A., Menzel, C., Rosenbusch, J. P., Landau, E. M. & Pebay-Peyroula, E. (1999). Structure, 7, 909–917. [DOI] [PubMed]
- Brünger, A. T., Adams, P. D., Clore, G. M., DeLano, W. L., Gros, P., Grosse-Kunstleve, R. W., Jiang, J.-S., Kuszewski, J., Nilges, M., Pannu, N. S., Read, R. J., Rice, L. M., Simonson, T. & Warren, G. L. (1998). Acta Cryst. D54, 905–921. [DOI] [PubMed]
- Chan, S. K., Kitajima, T., Fujii, R., Murakami, M., Ihara, K. & Kouyama, T. (2014). Submitted.
- Chizhov, I., Chernavskii, D. S., Engelhard, M., Mueller, K. H., Zubov, B. V. & Hess, B. (1996). Biophys. J. 71, 2329–2345. [DOI] [PMC free article] [PubMed]
- Enami, N., Okumua, H. & Kouyama, T. (2003). J. Photosci. 9, 320–322.
- Enami, N., Yoshimura, K., Murakami, M., Okumura, H., Ihara, K. & Kouyama, T. (2006). J. Mol. Biol. 358, 675–685. [DOI] [PubMed]
- Ernst, O. P., Lodowski, D. T., Elstner, M., Hegemann, P., Brown, L. S. & Kandori, H. (2014). Chem. Rev. 114, 126–163. [DOI] [PMC free article] [PubMed]
- Essen, L.-O., Siegert, R., Lehmann, W. D. & Oesterhelt, D. (1998). Proc. Natl Acad. Sci. USA, 95, 11673–11678. [DOI] [PMC free article] [PubMed]
- Faham, S. & Bowie, J. U. (2002). J. Mol. Biol. 316, 1–6. [DOI] [PubMed]
- Grigorieff, N., Ceska, T. A., Downing, K. H., Baldwin, J. M. & Henderson, R. (1996). J. Mol. Biol. 259, 393–421. [DOI] [PubMed]
- Gushchin, I., Chervakov, P., Kuzmichev, P., Popov, A. N., Round, E., Borshchevskiy, V., Ishchenko, A., Petrovskaya, L., Chupin, V., Dolgikh, D. A., Arseniev, A. S., Kirpichnikov, M. & Gordeliy, V. (2013). Proc. Natl Acad. Sci. USA, 110, 12631–12636. [DOI] [PMC free article] [PubMed]
- Hayakawa, N., Kasahara, T., Hasegawa, D., Yoshimura, K., Murakami, M. & Kouyama, T. (2008). J. Mol. Biol. 384, 812–823. [DOI] [PubMed]
- Ihara, K., Umemura, T., Katagiri, I., Kitajima-Ihara, T., Sugiyama, Y., Kimura, Y. & Mukohata, Y. (1999). J. Mol. Biol., 285, 163–174. [DOI] [PubMed]
- Kouyama, T. & Murakami, M. (2010). Photochem. Photobiol. Sci. 9, 1458–1465. [DOI] [PubMed]
- Kouyama, T., Nishikawa, T., Tokuhisa, T. & Okumura, H. (2004). J. Mol. Biol. 335, 531–546. [DOI] [PubMed]
- Lanyi, J. K. (2005). Biochim. Biophys. Acta, 1757, 1012–1018. [DOI] [PubMed]
- Lanyi, J. K. & Schobert, B. (2003). J. Mol. Biol. 328, 439–450. [DOI] [PubMed]
- Lozier, R. H., Xie, A., Hofrichter, J. & Clore, G. M. (1992). Proc. Natl Acad. Sci. USA, 89, 3610–3614. [DOI] [PMC free article] [PubMed]
- Luecke, H. (2000). Biochim. Biophys. Acta, 30, 133–156. [DOI] [PubMed]
- Luecke, H., Schobert, B., Richter, H. T., Cartailler, J.-P. & Lanyi, J. K. (1999). J. Mol. Biol. 291, 899–911. [DOI] [PubMed]
- Luecke, H., Schobert, B., Stagno, J., Imasheva, E. S., Wang, J. M., Balashov, S. P. & Lanyi, J. K. (2008). Proc. Natl Acad. Sci. USA, 105, 16561–16565. [DOI] [PMC free article] [PubMed]
- Matsui, Y., Sakai, K., Murakami, M., Shiro, Y., Adachi, S., Okumura, H. & Kouyama, T. (2002). J. Mol. Biol. 324, 469–481. [DOI] [PubMed]
- McRee, D. E. (1993). Practical Protein Crystallography. San Diego: Academic Press.
- Mukohata, Y., Ihara, K., Uegaki, K., Miyashita, Y. & Sugiyama, Y. (1991). Photochem. Photobiol. 54, 1039–1045. [DOI] [PubMed]
- Murshudov, G. N., Skubák, P., Lebedev, A. A., Pannu, N. S., Steiner, R. A., Nicholls, R. A., Winn, M. D., Long, F. & Vagin, A. A. (2011). Acta Cryst. D67, 355–367. [DOI] [PMC free article] [PubMed]
- Nasuda-Kouyama, A., Fukuda, K., Iio, T. & Kouyama, T. (1990). Biochemistry, 29, 6778–6788. [DOI] [PubMed]
- Oesterhelt, D. & Stoeckenius, W. (1971). Nature New Biol. 233, 149–152. [DOI] [PubMed]
- Okumura, H., Murakami, M. & Kouyama, T. (2005). J. Mol. Biol. 351, 481–495. [DOI] [PubMed]
- Pebay-Peyroula, E., Rummel, G., Rosenbusch, J. P. & Landau, E. M. (1997). Science, 277, 1676–1681. [DOI] [PubMed]
- Phatak, P., Ghosh, N., Yu, H., Cui, Q. & Elstner, M. (2008). Proc. Natl Acad. Sci. USA, 105, 19672–19677. [DOI] [PMC free article] [PubMed]
- Ran, T., Ozorowski, G., Gao, Y., Sineshchekov, O. A., Wang, W., Spudich, J. L. & Luecke, H. (2013). Acta Cryst. D69, 1965–1980. [DOI] [PubMed]
- Royant, A., Edman, K., Ursby, T., Pebay-Peyroula, E., Landau, E. M. & Neutze, R. (2000). Nature (London), 406, 645–648. [DOI] [PubMed]
- Royant, A., Edman, K., Ursby, T., Pebay-Peyroula, E., Landau, E. M. & Neutze, R. (2001). Photochem. Photobiol. 74, 794–804. [DOI] [PubMed]
- Sabra, M. C. & Mouritsen, O. G. (1998). Biophys. J. 74, 745–752. [DOI] [PMC free article] [PubMed]
- Sato, H., Takeda, K., Tani, K., Hino, T., Okada, T., Nakasako, M., Kamiya, N. & Kouyama, T. (1999). Acta Cryst. D55, 1251–1256. [DOI] [PubMed]
- Spudich, J. L., Sineshchekov, O. A. & Govorunova, E. G. (2014). Biochim. Biophys. Acta, 1837, 546–552. [DOI] [PMC free article] [PubMed]
- Steller, I., Bolotovsky, R. & Rossmann, M. G. (1997). J. Appl. Cryst. 30, 1036–1040.
- Takeda, K., Matsui, Y., Kamiya, N., Adachi, S., Okumura, H. & Kouyama, T. (2004). J. Mol. Biol. 341, 1023–1037. [DOI] [PubMed]
- Uegaki, K., Sugiyama, Y. & Mukohata, Y. (1991). Arch. Biochem. Biophys. 286, 107–110. [DOI] [PubMed]
- Vagin, A. & Teplyakov, A. (2010). Acta Cryst. D66, 22–25. [DOI] [PubMed]
- Wada, T., Shimono, K., Kikukawa, T., Hato, M., Shinya, N., Kim, S. Y., Kimura-Someya, T., Shirouzu, M., Tamogami, J., Miyauchi, S., Jung, K.-H., Kamo, N. & Yokoyama, S. (2011). J. Mol. Biol. 411, 986–998. [DOI] [PubMed]
- Waschuk, S. A., Bezerra, A. G., Shi, L. & Brown, L. S. (2005). Proc. Natl Acad. Sci. USA, 102, 6879–6883. [DOI] [PMC free article] [PubMed]
- Winn, M. D. et al. (2011). Acta Cryst. D67, 235–242.
- Yamamoto, M., Hayakawa, N., Murakami, M. & Kouyama, T. (2009). J. Mol. Biol. 393, 559–573. [DOI] [PubMed]
- Yoshimura, K. & Kouyama, T. (2008). J. Mol. Biol. 375, 1267–1281. [DOI] [PubMed]
- Zhang, J., Mizuno, K., Murata, Y., Murakami, M., Ihara, K. & Kouyama, T. (2013). Proteins, 81, 1585–1592. [DOI] [PubMed]
Associated Data
This section collects any data citations, data availability statements, or supplementary materials included in this article.
Supplementary Materials
PDB reference: archaerhodopsin-2, 3wqj


