Abstract
The interactions of the intrinsic laryngeal muscles (ILMs) in controlling fundamental frequency (F0) and glottal posture remain unclear. In an in vivo canine model, three sets of intrinsic laryngeal muscles—the thyroarytenoid (TA), cricothyroid (CT), and lateral cricoarytenoid plus interarytenoid (LCA/IA) muscle complex—were independently and accurately stimulated in a graded manner using distal laryngeal nerve stimulation. Graded neuromuscular stimulation was used to independently activate these paired intrinsic laryngeal muscles over a range from threshold to maximal activation, to produce 320 distinct laryngeal phonatory postures. At phonation onset these activation conditions were evaluated in terms of their vocal fold strain, glottal width at the vocal processes, fundamental frequency (F0), subglottic pressure, and airflow. F0 ranged from 69 to 772 Hz and clustered into chest-like and falsetto-like groups. CT activation was always required to raise F0, but could also lower F0 at low TA and LCA/IA activation levels. Increasing TA activation first increased then decreased F0 in all CT and LCA/IA activation conditions. Increasing TA activation also facilitated production of high F0 at a lower onset pressure. Independent control of membranous (TA) and cartilaginous (LCA/IA) glottal closure enabled multiple pathways for F0 control via changes in glottal posture.
I. INTRODUCTION
It is generally understood that phonation is achieved when the intrinsic laryngeal muscles (ILMs) are activated while a sufficiently large transglottal pressure drop is induced by the airflow from the lungs (Titze, 1994). Due to the technical challenges of in vivo experiments, mostly theoretical studies have been used to understand the influence of neuromuscular activation and laryngeal posture on phonation dynamics. For example, Titze and Talkin (1979) found that fundamental frequency (F0) of phonation was primarily controlled by longitudinal tension (associated with glottal length) and that trans-glottal pressure was less effective. Actively controlled muscular contraction appears to provide the necessary flexibility for the glottis to allow a broad F0 range and the many varieties of phonation (Titze, 1994; Titze and Talkin, 1979). However, the interactions of ILMs and their influence on phonatory posture and resulting dynamics remain poorly understood and have not been systematically investigated in experimental in vivo models.
F0 variations carry important linguistic information in speech and are also widely used in non-speech communication and singing. Van den Berg (1968) proposed that the highest F0 is reached when (1) airflow, (2) glottal adduction, and (3) vocal fold tension were maximal. Hirano (1974) introduced the “body-cover” biomechanical model of phonation, and proposed that F0 is controlled through changes in length or stiffness of the vocal fold cover layer through activation of the CT and TA muscles. This remains the basis for our current understanding of F0 control (Hirano, 1974). It has also been well understood from studies of mathematical (Lowell and Story, 2006; Farley, 1994, 1996), animal (Choi et al., 1993a,b), and human (Ohala, 1970; Atkinson et al. 1978; Kempster et al., 1988; Titze et al., 1989) models that the cricothyroid (CT) muscle plays an important role in increasing F0. However, the roles for other laryngeal muscles, specifically the thyroarytenoid (TA) and lateral cricoarytenoid (LCA) muscles in phonation have remained less clear. Systematic in vivo investigations of these muscles would be useful in highlighting their phonatory roles. Furthermore, while there has been a general agreement that F0 elevation is achieved by CT activation the mechanisms for F0 lowering have not been well understood (Löfqvist et al., 1989).
In addition to CT activation, voice production by the larynx over its entire possible F0 range likely requires adjustments of the adductory ILMs, especially during register transitions (Roubeau et al., 2009; Kochis-Jennings et al., 2012). While the definition of register has been a subject of much controversy it is generally agreed that speech and singing involve two registers: a “chest” register encompassing the lower F0 range and a “falsetto” register encompassing the higher F0 range (Švec et al., 2008, Kochis-Jennings et al., 2012). For both male and female larynges the transition between chest and falsetto seems to consistently occur around F0 range of 300–350 Hz (Titze, 1994). A “register transition” is said to occur when a large jump in F0 occurs while other phonatory control parameters (such as vocal fold strain, subglottal pressure, etc.) are changed gradually (Švec et al., 2008; Berry et al., 1996). The proposed mechanisms for register transitions have included a “bifurcation” phenomenon (Švec et al., 2008; Berry et al., 1996), as well as subglottal resonances and the stress state of the TA muscle (Titze, 1994). However, the in vivo physiologic correlates of register transitions remain poorly understood and have not been studied adequately.
To study the roles of various ILMs in neuromuscular control of phonation we previously developed a methodology to incrementally activate individual ILMs from threshold to maximal activation using graded neuromuscular stimulation in an in vivo canine model (Chhetri et al., 2010). We then investigated the interactions of the following pairs of muscle groups on F0 and phonatory posture (Chhetri et al., 2012): CT and all laryngeal adductors (TA/LCA/IA) (IA: interarytenoid muscle); CT and LCA/IA; CT and TA; and TA and LCA/IA. These interactions were reported: CT activation elongated the vocal folds, TA activation shortened and caused medial bulging of the vocal folds thus closing the mid-membranous glottis, and LCA/IA closed the posterior cartilaginous glottis but had negligible effects on vocal fold strain. CT activation was always required to increase F0 but the adductor muscles had a more complex influence on F0. Activation of all adductors together (LCA/IA/TA) was antagonistic to CT effects for F0 and vocal fold strain. This antagonistic relationship for F0 and strain disappeared when LCA/IA was activated without concurrent TA activation, except at very high activation levels of both CT and LCA/IA. When TA was activated without concurrent LCA/IA activation the antagonistic relationship reappeared for strain but not for F0. Finally, in the LCA/IA versus TA activation conditions, minimal changes in F0 were seen from baseline, as compared to CT activated conditions, but the adductors were synergistic in decreasing strain.
The previous investigation on the role of ILMs in phonatory control was limited by the number of muscles concurrently activated (Chhetri et al., 2012). In that study, left–right paired graded stimulation was applied to two nerves on each side of the larynx. Thus, the CT versus LCA parameter space was only studied for the condition of zero TA stimulation, and the CT versus TA parameter space was studied only for the condition of zero LCA stimulation. Note that the CT versus LCA condition corresponds to an excised larynx model where concurrent evaluation of the medial bulging effects of TA activation is not possible. On the other hand, the CT versus TA conditions were tested at a relatively large posterior glottal gap due to zero LCA/IA activation, and therefore there were many conditions without phonation onset events, thus failing to reveal the full range of possible CT versus TA phonatory interactions as a function of glottal width (LCA activation). Thus, this study was undertaken to gain a more comprehensive understanding of the role of ILMs in phonatory control of F0. In this investigation we applied concurrent graded stimulation to six nerves (three on each side of the larynx), and thus we studied the CT versus LCA/IA parameter space at multiple levels of TA activation (previously only at zero TA stimulation level), and the CT versus TA parameter space at multiple levels of LCA/IA activation (previously only at zero LCA/IA stimulation level) using concurrent graded stimulation of three nerve pairs (bilateral CT, TA, and LCA/IA nerve branches). The results thus provide a more comprehensive and currently the most extensive evaluation of the neuromuscular control of phonation in an in vivo model.
II. METHOD
A. In vivo canine larynx preparation
The canine larynx is a close match to the human larynx in terms of its gross, microscopic, and histologic anatomy, and the validity of the in vivo canine model in voice research is well established (Berke et al., 1987; Garrett et al., 2000; Chhetri et al., 2010, 2012). The study protocol was approved by the Institutional Animal Research Committee (ARC) of the University of California, Los Angeles.
Surgical exposure of the larynx and graded stimulation of the laryngeal nerves were performed as described previously (Chhetri et al., 2010, 2012). The neck was exposed surgically and the recurrent laryngeal nerves (RLNs) were identified at the tracheo-esophageal grooves bilaterally and followed distally toward the larynx. The nerve branches to Galen's anastomosis and to the PCA muscles were divided to eliminate the effects of these nerves during neuromuscular stimulation. The anterior RLN branches were then followed until the TA and LCA/IA branches could be identified. The TA branches were tied off with silk sutures and appropriately sized tripolar cuff electrodes (Ardiem Medical, Indiana, PA) were placed on the distal TA branches to activate the TA muscles. To activate the LCA/IA muscles, cuff electrodes were placed on the main RLN trunks about 5 cm from the larynx after the TA branches were tied off. The superior laryngeal nerve (SLN) external branches were then identified bilaterally at the level of the larynx adjacent to the inferior constrictor muscles and appropriately sized cuff electrodes were placed for activation of the CT muscles. For improved visualization of the larynx for high-speed video recording the larynx was exteriorized in the neck by performing a suprahyoid pharyngotomy and then a supraglottic laryngectomy. The internal branches (sensory) of the SLN were also divided bilaterally during this maneuver.
For each nerve the stimulation grade ranged from threshold muscle activation, where just a hint of muscle contraction was visible, to maximal activation, where no further change of vocal fold posture to stimulation was seen. Nerve stimulation pulse trains were generated with a LabVIEW (National Instruments Corp., Austin, TX) custom computer program that controlled an AD/DA board (PCIe-7841R, National Instruments Corp., Austin, TX) to generate the six individual stimulation pulse trains with individually different amplitudes. The voltage pulse trains were transformed into current pulse trains with constant current stimulus isolators (A-M Systems Analog Stimulus Isolator model M 2200, A-M Systems, Sequim, WA). The LabVIEW program also controlled the generation of a linear ramp of the glottal airflow, acquisition of acoustic and aerodynamic data, and triggering of the high speed digital camera recording. Neuromuscular stimulation was performed for 1500 ms with 100 μs long rectangular unipolar cathodic pulses at pulse repetition rates of 100 Hz. To allow time for muscle recovery and transfer of high speed video data to the host computer, each stimulation pulse train was followed by a 3.5 s pause prior to the next stimulation.
For this investigation, bilateral CT and LCA/IA nerve branches were activated over 7 evenly spread levels of graded stimulation from threshold to maximal muscular activation (8 levels of graded stimulation for both CT and LCA/IA including zero stimulation, and total of 64 distinct laryngeal activation states per set). This was repeated over 4 levels of graded stimulation of bilateral TA branches (total 5 TA levels including zero stimulation). Thus 320 distinct laryngeal activation states were tested. Previously (Chhetri et al., 2012) we tested 10 levels of graded stimulation per muscle (11 levels including zero stimulation) but subsequently we have determined that 4–7 levels of graded stimulation (5–8 levels including zero stimulation) provide adequate resolution for glottal posture and F0 control. In addition, in an in vivo preparation the muscle activation stimulation thresholds conditions can sometimes change due to tissue fluid collecting around the electrodes and thus testing fewer levels of graded activation also allows for the entire data set to be collected from a larynx where muscle activation responses to neuromuscular stimulation are stable throughout. The threshold and maximal activation levels for each nerve were tested at the end of stimulation runs to check for stability during the experiment. The LCA and IA were activated together as the IA branch is short and difficult to dissect without jeopardizing the LCA branch. Furthermore, while the LCA and IA play similar functional roles in closing the posterior glottis to facilitate phonation the IA is not expected to alter the stiffness of the vocal fold compared to other ILMs (Choi et al., 1995; Nasri et al., 1994).
B. In vivo canine phonation
With a tracheotomy providing intraoperative ventilation through an endotracheal tube, a rigid subglottal tube to provide rostral airflow for in vivo phonation was attached and connected to an airflow controller (MCS Series Mass Flow Controller, Alicat Scientific, Tucson, AZ), which was used to increase the airflow linearly from 300 to 1600 ml/s during each stimulation pulse train. The airflow was increased in such manner because phonation onset pressure (Pth) for each condition could not be predicted in advance and the goal was to allow subglottic pressure (Psub) to increase to Pth and continue rising beyond phonation onset. The airflow controller was connected to a heated humidifier (HumiCare 200, Gruendler Medical, Freudenstadt, Germany) capable of supporting airflow levels up to 1600 ml/s. The airflow through the larynx was warmed to 37 °C and 100% relative humidity.
C. Measurement of experimental parameters
A high-speed digital video camera (Phantom v210, Vision Research Inc., Wayne, NJ) imaged laryngeal deformation and vibration at 3000 frames/s during nerve stimulation. The distance from the camera to the larynx remained constant for all conditions. The camera was triggered when the nerve stimulation pulse train started and recorded laryngeal deformations for the entire 1500 ms stimulation duration. Measurements of acoustic and aerodynamic parameters were made at phonation onset (described below), as this was a well-defined condition for all activation states and we also expect the onset conditions to more accurately represent the stress state of each glottal posture. In addition, as airflow was continuously increased beyond phonation onset, increasing aerodynamic forces act on the larynx beyond onset and can often change vibratory behavior and bifurcations can be encountered. Phonatory behavior beyond onset was not evaluated in this study and is a topic of future investigations.
To quantify glottal posture, several landmark locations on the superior vocal fold surface and the vocal processes were marked with India ink. The timing of phonation onset was determined primarily from the acoustic signal (sampling rate 50 kHz) and confirmed on high speed video (HSV) and digital kymograhy (DKG) images by observing the onset of sustained glottal cycles. Vocal fold strain was determined from measurements of membranous vocal fold length (from anterior commissure to the vocal process) at phonation onset Li and at baseline L0 at the beginning of each stimulation pulse train: strain (ε) = (Li − L0)/L0. The distance between the left and right vocal processes was also similarly measured, and the normalized vocal process distance Dvp was calculated as follows: Dvp = Di/D0 (Di = distance between vocal processes at phonation onset, and D0 = distance between vocal processes at the beginning of each stimulation pulse train).
Acoustic and aerodynamic data were recorded using a probe microphone (model 4128, Bruel & Kjaer North America, Norcross, GA) and a pressure transducer (MKS Baratron 220D, MKS Instruments, Andover, MA) mounted flush with the inner wall of the subglottic inflow tube about 5 cm below the inferior border of the glottis. The subglottal acoustic pressure signal (recorded at a sampling rate of 50 kHz) was used to manually determine the fundamental frequency (F0) at phonation onset using Sound Forge (Sonic Foundry Sound Forge Version 6.0, Sonic Foundry Inc., Madison, WI). The first four acoustic glottal oscillation cycles from onset were used to calculate the onset F0. The corresponding mean subglottal pressure (Psub) and airflow represented the phonation onset pressure (Pth) and phonation onset flow rate. When no phonation onset occurred, we measured the strain, vocal process distance, subglottal pressure, and airflow at the end of the stimulation pulse train to estimate lower bounds for onset conditions.
D. Data presentation and interpretation
Muscle activation plots (MAPs) are used to illustrate the experimental findings as used previously (Chhetri et al., 2012). These two-dimensional plots visually illustrate the interactions between two sets of laryngeal muscles (e.g., CT versus TA) and use color coding to graph the data values of measured phonatory variables. The plots contain 8 CT activation levels (stimulation grades 0–7) on the y axis and either the 8 LCA/IA activation levels (stimulation grades 0–7) or the 5 TA activation levels (stimulation grades 0–4) on the x axis. Each block of color in the MAP represents the quantity of data value for that variable as defined in the side bar color scale, at that particular graded level interaction of the two muscles. Color coded MAPs allows for easier and improved assessment of data trends. In addition, isocontour lines representing equal measured values are included in the plots to further improve data trend visualization and interpretation.
The interaction between pairs of muscles in controlling the following phonatory variables at phonation onset are illustrated: glottal posture parameters of glottal distance between the vocal processes (Dvp) and vocal fold strain (ε); acoustic parameter phonation onset frequency (F0); and aerodynamic parameters phonation onset pressure (Pth), and airflow (Qth). The entire data set (320 stimulation conditions) was acquired from one animal in about 35 min consecutive measurement times, thus allowing for consistent and comprehensive evaluation of the interactions of the ILMs in the same larynx. We monitored the behavior of the in vivo larynx preparation visually during this time to assure that the stimulated muscles were activated as expected. We repeated the entire set of 320 activation conditions a second time, with similar observed findings. As mentioned before, the threshold and maximal activation levels for each nerve was rechecked at the end of the stimulation run and remained unchanged. These findings are also consistent with the laryngeal behavior in previous reports (Chhetri et al., 2012, 2013) where the number of concurrently and independently activated muscles was smaller.
III. RESULTS
A. General observations on F0, glottal posture, and aerodynamics
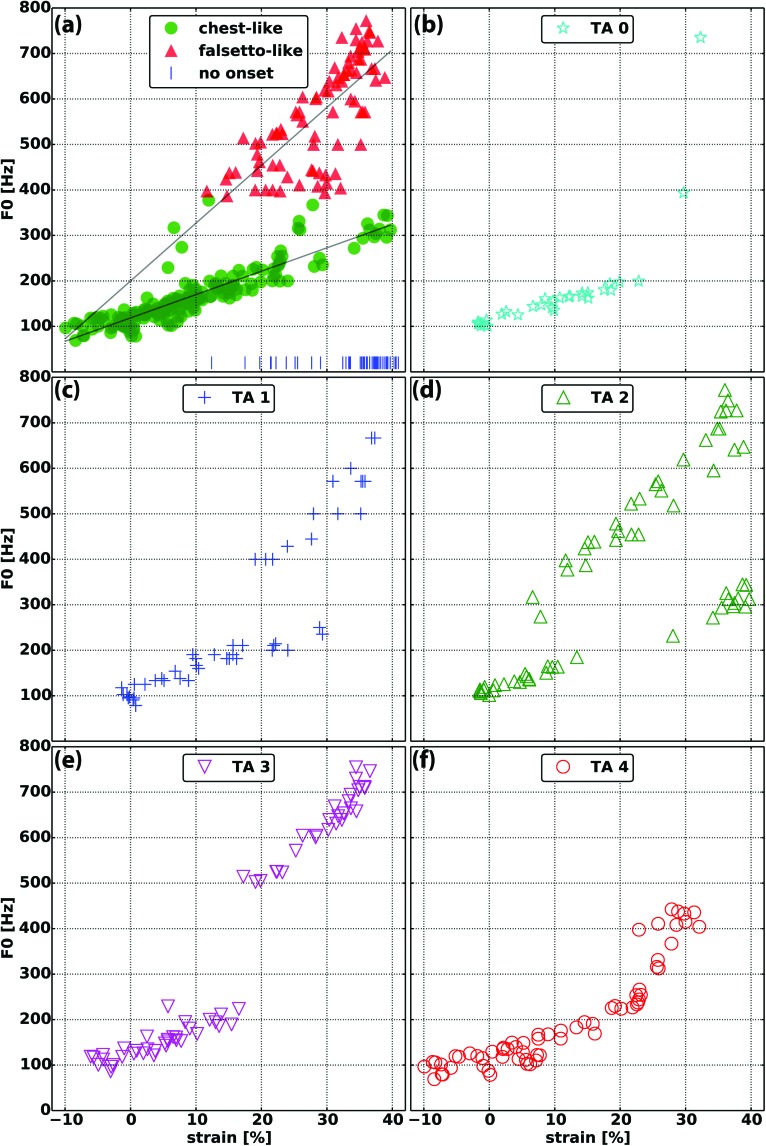
The overall interactions between F0, strain, glottal adduction, and aerodynamics over the entire set of 320 distinct laryngeal activation conditions involving the CT, TA, and LCA/IA muscles are presented in Figs. 1–4. Figure 1 shows F0 as a function of glottal strain. There were two F0 clusters: a low-frequency cluster with “chest-like” register quality containing F0 values between 69 and 380 Hz, and a high-frequency cluster with “falsetto-like” register quality containing F0 values between 38 and 772 Hz. Perceptually, the low frequency cluster was richer (e.g., had stronger harmonics) and the high frequency cluster exhibited a more tonal quality (e.g., had weaker harmonics). Acoustically, these differences in harmonic strength were demonstrated by spectral analysis. When viewed by TA levels, distinct areas of large change in F0 value with incremental change in strain could be observed, consistent with the definition of F0 jumps between the chest-like and falsetto-like registers (Švec et al., 1999; Tokuda et al., 2010). These two F0 clusters variably overlapped in terms of strain: at TA level 0, only two F0 data points were in the higher F0 cluster and there was no overlap in strain [Fig. 1(b)]; at TA level 1, F0 jump occurred around 18% strain with F0 overlap between 18%–28% strain [Fig. 1(c)]; at TA level 2, F0 jump occurred around 12% strain and there was F0 overlap only with a cluster of lower F0 data points at the highest strain levels (discussed below in Sec. III C) [Fig. 1(d)]; at TA level 3, F0 jump occurred around 18% strain and there is no F0 overlap between registers in strain [Fig. 1(e)]; finally, at TA level 4, only a few F0 data points at the low end of the higher F0 cluster occurred around 23% strain and there is overlap of only several F0 data points for strain [Fig. 1(f)].
FIG. 1.
Fundamental frequency (F0) as a function of vocal fold strain in (a) the 320 distinct laryngeal neuromuscular activation conditions. The chest-like (green) and a falsetto-like (red) registers are shown and vertical blue lines indicate conditions where phonation onset was not reached at the airflow levels used. F0 versus strain data points are separated by TA activation levels 0–4 in subplots (b)–(f).
FIG. 2.
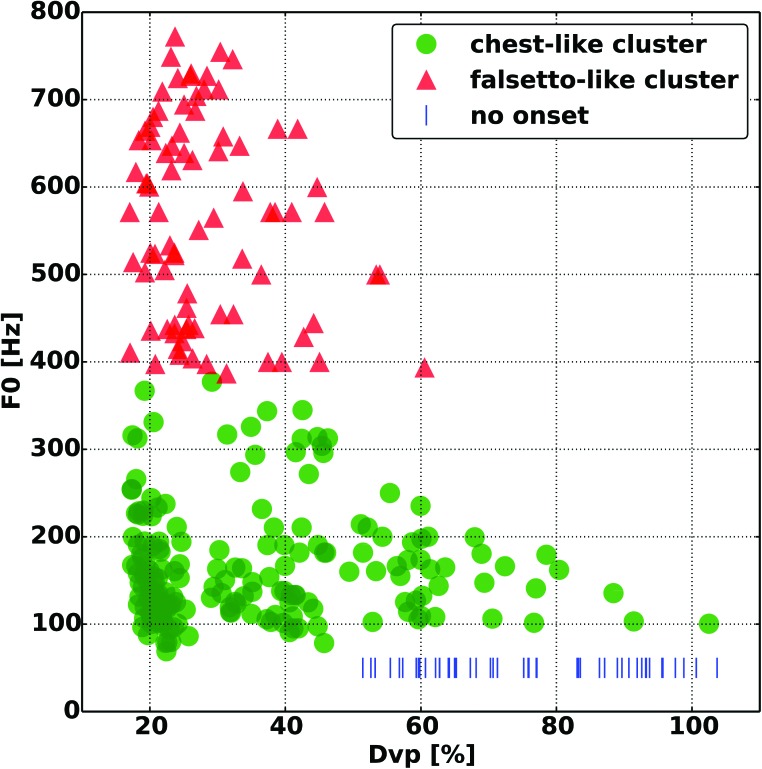
Fundamental frequency (F0) as a function of glottal distance at the vocal processes (Dvp). The falsetto-like register (red) is grouped closer to the lower Dvp values, compared to the chest-like register (green). Vertical blue lines indicate conditions where phonation onset was not reached at the airflow levels used.
FIG. 3.
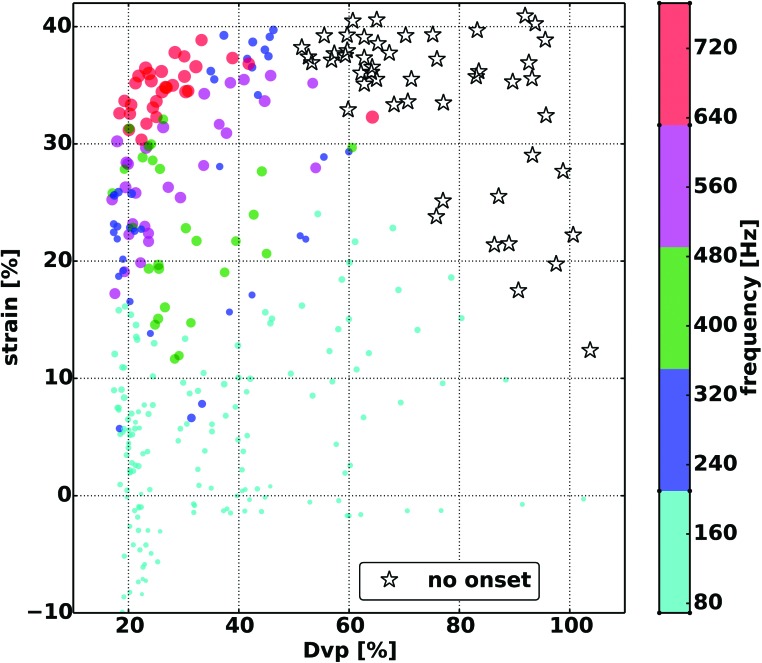
The interaction between strain and glottal distance (Dvp) for fundamental frequency (F0). The highest frequencies generally cluster around the high strain, low Dvp region. Starred symbols indicate conditions where phonation onset was not reached at the airflow levels used.
FIG. 4.
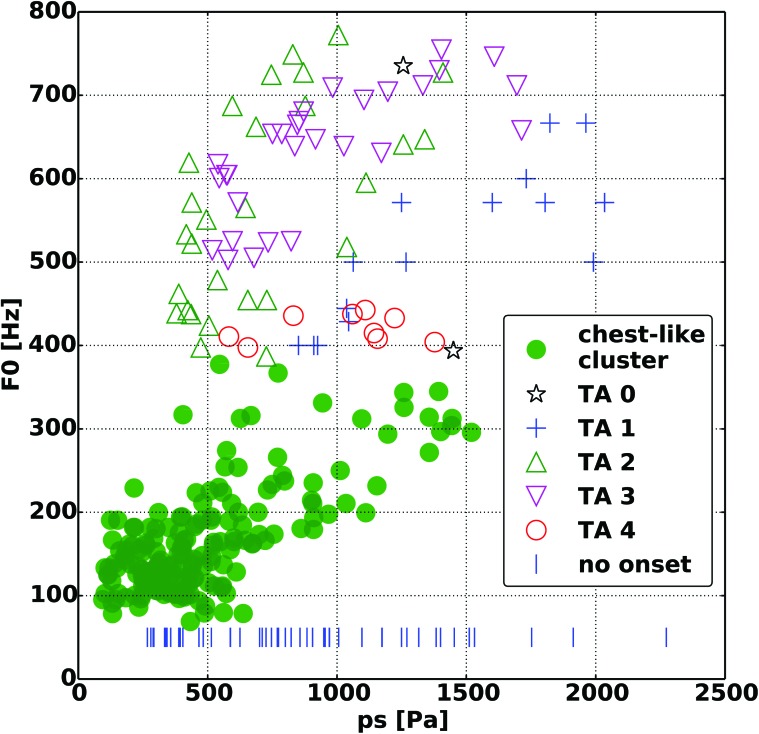
Fundamental frequency (F0) as a function of subglottic pressure (ps) reveals that the same F0 can be achieved with a wide range of subglottic pressure. TA activation levels are shown for the falsetto-like F0 cluster.
When the effect of glottal adduction on F0 was evaluated the higher F0 values primarily clustered around lower Dvp (Fig. 2). However, while higher F0 was generally achieved only with increased glottal adduction, a wide F0 range was still possible even at maximal adduction. The lower F0 values at maximal adduction were primarily seen with lower CT activation levels. This influence between strain and glottal adduction on F0 is best seen in Fig. 3, where maximal F0 values clustered around maximal strain and glottal adduction. Figure 4 shows that higher register could be achieved at a wide range of Pth. For the higher register, lower Pth values are seen with increasing TA activation, in particular TA levels 2 and 3. At TA level 4 the F0 range is significantly contracted and limited to the low end of the higher register. Correlation analysis of F0 versus strain, Dvp, and Pth, and airflow yielded Pearson correlation coefficients (r values) of 0.84, −0.18, 0.66, and 0.24, respectively.
B. Laryngeal Posture at phonation onset: Glottal adduction (Dvp) and strain (ε)
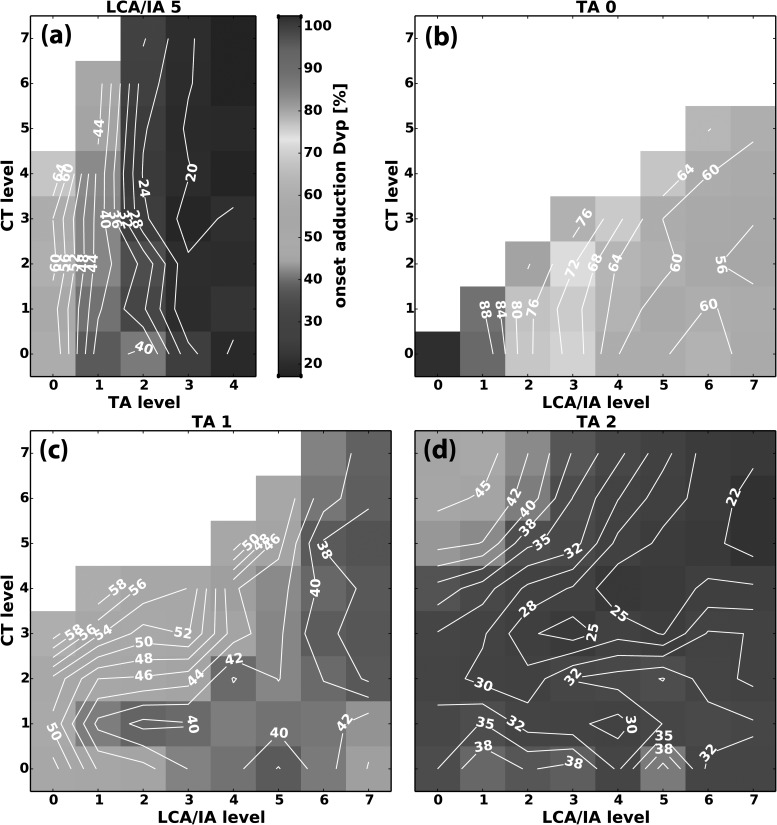
The relative interactions (isocontour lines) of CT versus TA for Dvp were similar for all LCA/IA levels and therefore a representative condition, CT versus TA at LCA/IA level 5, is shown in Fig. 5(a). The nearly vertical isocontour lines for Dvp show that as TA activation increased Dvp decreased, and increasing CT activation had very little effect on Dvp. LCA/IA and TA were synergistic for glottal closure (i.e., absolute Dvp values were less with increasing LCA/IA activation at the same TA level, data not shown). In contrast, the interactions of CT and LCA/IA on Dvp were variable, especially at low TA levels, as illustrated in Figs. 5(b)–5(d). When TA activation was absent [TA = 0, Fig. 5(b)], increasing LCA/IA activation led to a decrease in Dvp, while CT activation had no effect until higher LCA/IA levels where a slight increase in Dvp is seen. As CT activation levels increased, phonation onset was not reached in many activation conditions [blank area in Figs. 5(a)–5(c)]. However, as TA activation levels increased [Figs. 5(c) and 5(d)], more activation states reached phonation onset and revealed further interactions. Figures 5(c) and 5(d) show that at lower levels of LCA/IA activation, increasing CT activation tended to increase Dvp. This interaction was eliminated at higher activation levels of TA and/or LCA/IA. In the regions where phonation onset did not occur, review of the high speed images at a time after final posture was set also confirmed increased Dvp with CT activation at low levels of LCA/IA activation. Thus, during phonation CT activation increased Dvp only at the lower LCA/IA and TA activation levels [Figs. 5(c) and 5(d)].
FIG. 5.
(Color online) Representative muscle activation plots for glottal distance between vocal processes (Dvp) at phonation onset as a function of graded activation of (a) CT versus TA at LCA/IA level 5, (b) CT versus LCA/IA at TA level 0, (c) CT versus LCA/IA at TA level 1, and (d) CT versus LCA/IA at TA level 2. Dvp was calculated as a percentage of glottal width at the baseline non-stimulated resting condition.
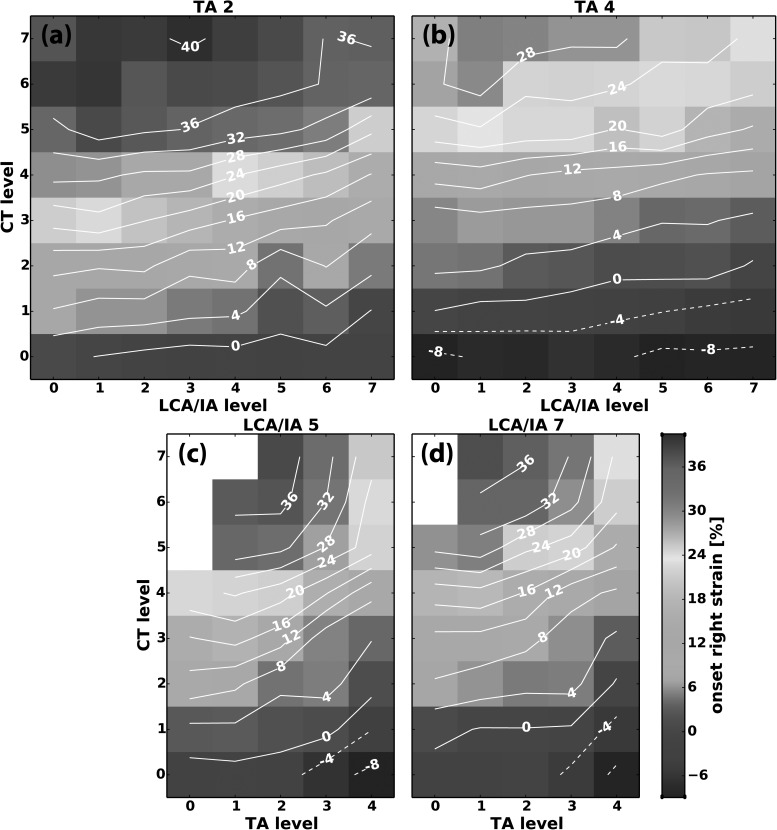
The effects of ILM contraction on vocal fold strain are illustrated in Fig. 6. The slopes of the isocontour lines for strain were similar within each parameter space evaluated (i.e., CT versus LCA/IA and CT versus TA) and thus representative figures are shown in Figs. 6(a)–6(d) to illustrate the general behavior. CT activation always increased strain, whereas LCA/IA and TA activation both decreased strain in a synergistic manner. In the CT versus LCA/IA parameter space [Figs. 6(a) and 6(b)] the almost horizontal isocontour lines at low LCA/IA levels show strain was mostly controlled by CT activation in this region. As LCA/IA activation increased, the slightly upward-sloping isocoutour lines show that strain decreased slightly at the higher end of LCA/IA activation levels. At the highest level of TA activation [Fig. 6(b)], the general interactions of CT and LCA/IA for strain remained the same but the observed values shifted toward lower range and the strain became negative at zero CT activation. Thus, TA activation was needed to achieve negative strain [Fig. 6(b)] and LCA/IA activation was mildly antagonistic to CT for strain but could not achieve negative strain [Fig. 6(a)].
FIG. 6.
(Color online) Representative muscle activation plots for vocal fold strain at phonation onset as a function of graded activation of (a) CT versus LCA/IA at TA level 2, (b) CT versus LCA/IA at TA level 4, (c) CT versus TA at LCA/IA level 5, and (d) CT versus TA at LCA/IA level 7.
The role of TA on strain is better illustrated in the MAPs for parameter space CT versus TA [Figs. 6(c) and 6(d)]. At zero TA activation, strain is primarily controlled by CT activation. With increasing TA activation there is decrease in strain but the effect is more pronounced at higher activation levels (TA levels 3–4) and TA is more effective in decreasing strain [Figs. 6(c) and 6(d)] compared to LCA/IA [Figs. 6(a) and 6(b)]. Comparing Figs. 6(c) and 6(d) with Fig. 5(a) shows that TA activation first adducts the vocal fold then shortens the vocal fold. In addition, as shown by the steeper isocontour lines in Figs. 6(c) and 6(d) compared to Figs. 6(a) and 6(b), TA activation ultimately leads to a larger decrease in strain (i.e., vocal fold shortening) compared to LCA/IA activation.
C. Control of fundamental frequency (F0)
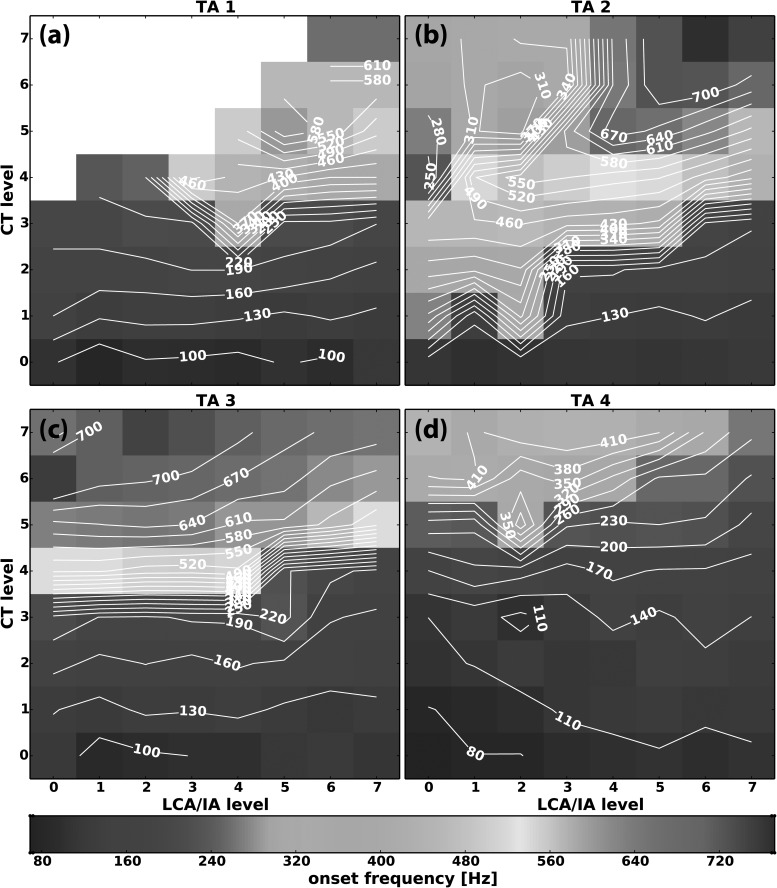
The effects on F0 for parameter space CT versus LCA/IA at four activation levels of TA (levels 1–4) are shown in Figs. 7(a)–7(d). At low TA activation [Fig. 3(a), TA 1] the horizontal isocontour lines show that F0 was controlled by CT activation regardless of LCA/IA activation. F0 increased as CT activation level increased. Distinct regions of F0 jumps occurred at CT levels 3 to 4 as seen by the high density of the equidistant isocontour lines indicating rapid change in F0 values. In addition, perceptually this correlated with F0 jumps with chest-like and falsetto-like qualities described above. The blank areas in the plots indicate activation conditions where no phonation onset occurred within the applied air flow range: in the low LCA/IA activation region, phonation onset was not reached as CT activation levels increased to higher levels. However, with further LCA/IA activation, phonation onset events reappeared with F0 still mostly dependent on CT activation level but at the higher register. As TA activation level increased [Fig. 3(b), TA 2], phonation onset was reached in all activation conditions, and F0 register jump was occurred at a lower level of CT activation (CT level 1–2). Interestingly, at the low LCA/IA levels, increasing CT activating first caused increase in F0 to a higher register then as CT activation reached the higher levels a decrease in F0 with shift to the lower register occurred [left upper quadrant in Fig. 7(b)]. Evaluation of laryngeal posture in this region showed that the strain continued to increase with all levels of CT activation [Fig. 6(a)] but Dvp increased at the higher levels of CT activation where F0 decrease occurred [Fig. 5(d)]. Further increased activation of LCA/IA from this region then led to transition to the falsetto-like register [Fig. 7(b)] that was associated with decreased Dvp [Fig. 5(d)] without significant change in strain [Fig. 6(a)].
FIG. 7.
(Color online) Representative muscle activation plots for fundamental frequency (F0) at phonation onset as a function of graded activation of CT versus LCA/IA at (a) TA level 1, (b) TA level 2, (c) TA level 3, and (d) TA level 4. Missing data points (blank areas) in subplot (a) represent activation conditions where phonation onset was not reached at the airflow levels used (300–1600 ml/s).
As TA activation was increased further to level 3 [Fig. 7(c)], F0 increase was again controlled by CT activation and there was again a distinct register change as CT activation increased to levels 4–5 at all levels of LCA/IA. However, here the gently upward-sloping isocontour lines at the higher levels of both CT and LCA/IA activation demonstrate that F0 decreased slightly as strain decreased slightly and Dvp remained constant. Finally, at maximal TA activation [Fig. 7(d), TA 4] register jump occurred only at high CT and low LCA/IA regions. At maximal TA activation, F0 followed changes in strain [Figs. 6(d) and 7(d)].
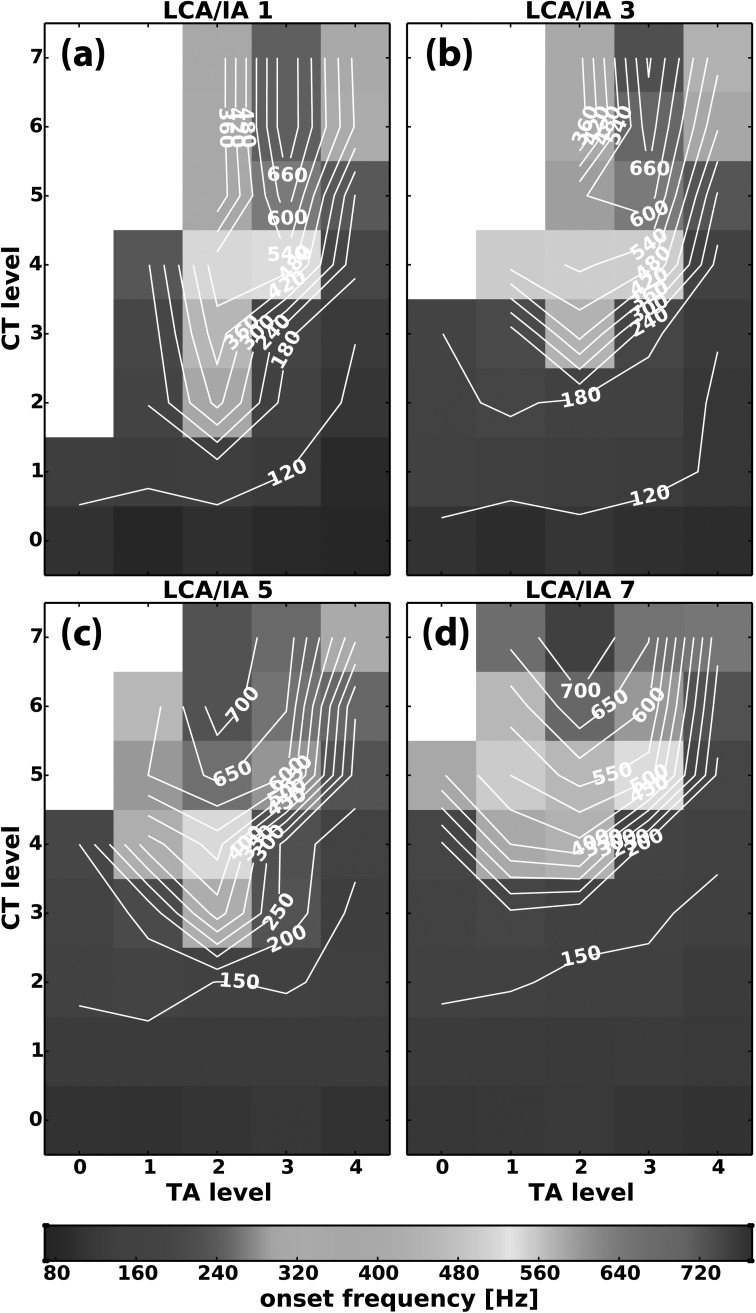
The effects on F0 for parameter space CT versus TA at four levels of LCA/IA activation (levels 1, 3, 5, 7) are shown in Figs. 8(a)–8(d). The results again illustrate that CT activation was always necessary for F0 increase. In addition, at TA activation level 0–1 phonation onset was not reached in some conditions as CT activation levels increased. However, phonation onset occurred upon increasing TA and LCA/IA activation levels. A consistent pattern of F0 control was present in this parameter space: increasing TA activation first led to an increase in F0 and then to a decrease in F0 as TA levels were increased further. Two mechanisms for F0 jumps could be seen: first as TA was activated at high CT level, and second while TA was maintained at levels 1–3 as CT was slowly activated to higher levels. The overall effect of TA activation on F0 was similar regardless of the LCA/IA level, although more activation states reached phonation onset when both adductors were activated. Review of glottal posture revealed that the initial increase in F0 was correlated with decreased Dvp [Fig. 5(a)] and subsequent decrease in F0 was correlated with decreased strain [Figs. 6(c) and 6(d)]. The overall effect of LCA/IA activation in this parameter space was to decrease Dvp and facilitate phonation onset at lower levels of TA activation. In addition, as LCA/IA levels increased, the higher F0 range was concentrated toward higher CT activation levels [Figs. 8(a)–8(d)]. At higher levels of combined TA and LCA/IA activation it was possible to transition directly from regions where phonation onset condition was not reached to a high-frequency falsetto-like register [Figs. 8(c) and 8(d)].
FIG. 8.
(Color online) Representative muscle activation plots for fundamental frequency (F0) at phonation onset as a function of graded activation of CT versus TA at (a) LCA/IA level 1, (b) LCA/IA level 3, (c) LCA/IA level 5, and (d) LCA/IA level 7. Missing data points (blank areas) represent activation condition where phonation onset was not reached at the airflow levels used (300–1600 ml/s).
D. Control of laryngeal aerodynamics: Phonation onset pressure (Pth) and airflow Qth
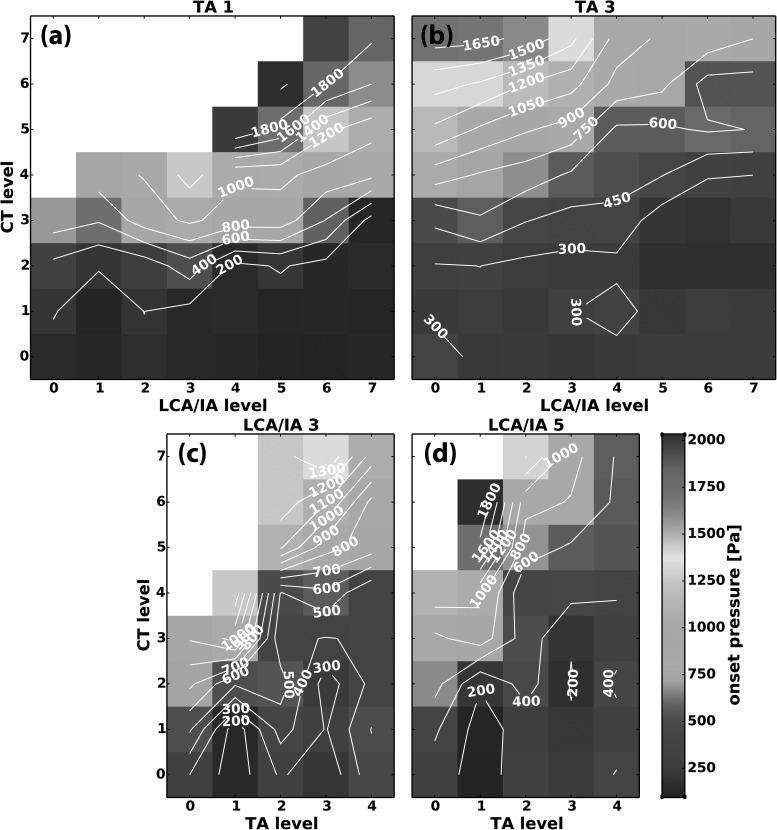
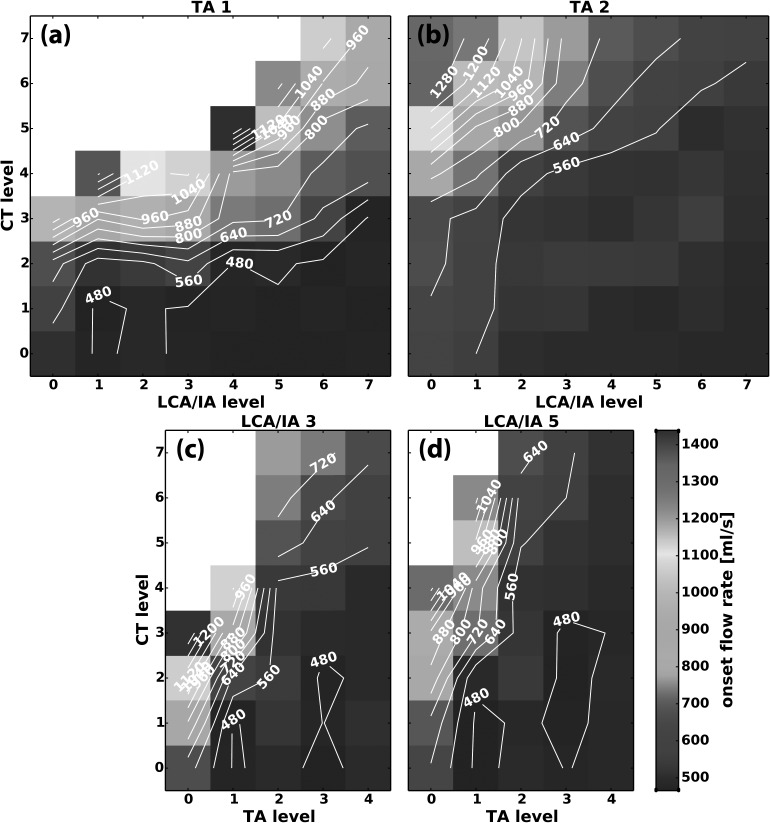
Subglottic pressure and flow were at the highest levels at the laryngeal activation conditions adjacent to regions where phonation onset was not observed (Figs. 9 and 10). Figures 9(a) and 9(b) are illustrative cases showing Pth as a function of CT versus LCA/IA at TA level 1 and 3, respectively. Pth increased with CT activation. With increasing LCA/IA levels, Pth decreased as shown by the slightly upward-sloping isocontour lines, especially at higher levels of CT activation. As TA level increased, this trend was the same: the highest Pth was in the region of high CT and low LCA/IA activation [Fig. 9(a) versus 9(b)]. However, increasing TA activation decreased Pth despite maintaining high F0 levels [compare Figs. 7(a) and 7(c) versus Figs. 9(a) and 9(b)]. Pth in the parameter space CT versus TA was also similar [Figs. 9(c) and 9(d)]. CT activation increased Pth and TA activation decreased it, especially at the higher CT activation levels. Highest Pth was still found close to the regions where no phonation onset was observed due to our limited air flow range. Pth was reduced by TA and LCA/IA activation although high F0 was maintained (Figs. 7–9). Thus, phonation onset with the adductors required lower subglottic pressure. Activation conditions where phonation onset did not occur had larger Dvp values. The results for airflow paralleled the results for Pth [Figs. 10(a)–10(d)]. CT activation increased phonation onset airflow and LCA/IA activation reduced it [Figs. 10(a) and 10(b). Higher TA activation levels also lowered Qth but the decrease was more dramatic with TA activation compared to LCA/IA activation [Figs. 10(c) and 10(d) compared to Figs. 10(a) and 10(b)]. Highest airflow levels were also found bordering regions where no phonation onset event occurred.
FIG. 9.
(Color online) Representative muscle activation plots for phonation onset pressure (Pth) as a function of graded activation of (a) CT versus LCA/IA at TA level 1, (b) CT versus LCA/IA at TA level 3, (c) CT versus TA at LCA/IA level 3, and (d) CT versus TA at LCA/IA level 5.
FIG. 10.
(Color online) Representative muscle activation plots for phonation onset flow rate (ml/s) as a function of graded activation of (a) CT versus LCA/IA at TA level 1, (b) CT versus LCA/IA at TA level 2, (c) CT versus TA at LCA/IA level 3, and (d) CT versus TA at LCA/IA level 5.
IV. DISCUSSION
The acoustic output of the larynx is determined by (1) the glottic phonatory posture which is controlled by the activation of intrinsic laryngeal muscles, and (2) aerodynamic forces which are controlled by the respiratory system and glottal resistance. Using a technique for automated graded stimulation of intrinsic laryngeal muscles developed previously, we investigated the role of the CT, TA, and LCA/IA muscles in controlling glottal posture, F0, and aerodynamics at phonation onset. In particular, across 320 distinct laryngeal phonatory postures involving these muscles, we were able to systematically and efficiently quantify the influence of each of these specific laryngeal muscles on the aforementioned variables in an intact neuromuscular model of phonation. We demonstrated high correlation between F0 and strain (Fig. 1) and moderate correlation between F0 and subglottic pressure (Fig. 4). However, in contrast to the proposal of Van den Berg (1968), maximum airflow is not always required for high F0 as neuromuscular control can reduce the aerodynamic energy required. Specifically, TA and LCA/IA activation can decrease Pth while maintaining high F0 values (Figs. 4 and 7–9). In addition, separately controlling the two laryngeal adductors appears critical to achieving the high F0 values and register jumps. The F0 range achieved in this study by separately activating the TA and LCA/IA nerve branches was at least twice that we and others have previously encountered in an in vivo canine model of phonation where all adductors were activated together by stimulating the RLN (Chhetri et al., 2012, 2013). This would support the notion that separate control of membranous and cartilaginous glottis could significantly increase the variety of phonation types (Herbst et al., 2011).
While there was high positive correlation between F0 and strain, which points to the essential role of CT activation for F0 increase, this phonatory posture parameter alone does not completely explain the mechanisms for the observed register jumps. Review of the muscle activation plots reveals that the TA muscle activation is essential for register changes (Figs. 7 and 8). When TA activation was absent (TA level 0) a register change was seen only once, when LCA/IA activation level was the highest [Fig. 8(d)]. Concurrent TA activation allowed for a more varied and expanded F0 range than possible with CT and LCA/IA interactions alone. Activation of the TA muscle causes medial bulging of the glottis, and it has been proposed that the changes to the vocal fold medial surface shape and angle is one of the major configurational parameters influencing F0 (Titze and Talkin, 1979). Additionally, Titze has also proposed that the TA muscle could either raise or lower F0 depending upon the amount of body layer “effectively in vibration” (Titze et al., 1988; Titze et al., 1989). However, Titze et al. (1988) stated that the vocal cover needed to be lax in order for TA activity to increase F0 since in these conditions more TA could contribute to effective vibration. In falsetto and soft phonation, where the cover is expected to contribute primarily to vibration, TA activation was predicted to lower F0 due to vocal fold shortening. More specifically, Titze et al. (1989) suggested that “when the cover is very tense (large cricothyroid activity with elongated vocal folds)… greater contraction of the muscle will lower F0.” However, across all CT and LCA/IA conditions in our investigation, an increase in TA activity always first raised F0 and then lowered F0. (Fig. 8). To our knowledge, such a finding has not been previously reported in an in vivo model. Lowell and Story reported similar findings in a three-mass model of phonation, but only for low CT activation levels (Lowell and Story, 2006). At high CT activation levels they found that F0 decreased with all levels of TA activation. In addition, the MAP for F0 in the CT versus TA parameter space showed smooth iso-contour lines throughout and abrupt F0 jumps as found in our study were not encountered. Such differences between our study and mathematical models allow for a better evaluation of lumped element models of phonation.
This study suggests that as long as LCA/IA activation can provide adequate posterior glottal closure, TA activation can modulate F0 by membranous glottal adduction whether the cover is lax or tense. Possible mechanisms for the initial F0 raising observed in this study include the following: (1) as confirmed in the present experiment and in previous studies (Chhetri et al., 2010, 2012), initial TA activation does not initially result in significant vocal fold shortening (which would tend to lower F0), but significant vocal fold adduction [e.g., see Figs. 5(a) and 6(c)–6(d)], (2) vocal fold adduction without shortening allows for TA to contribute to increased cover stiffness and/or modify the shape of the vibratory part of the vocal fold, which eventually increases the resultant F0. We measured F0 at onset conditions (similar to soft phonation), and observed that TA is able to contribute positively to glottal stiffness and/or posture and modulate F0 even at phonation onset. Possible mechanisms for the subsequent F0 lowering observed in this study includes the following: (1) F0 lowering begins to occur once vocal fold shortening becomes the dominant result of increased TA activity as an antagonist to the CT muscle action, In fact, we do see decreased vocal fold strain due to TA contraction associated with the decrease in F0.
A variety of possible F0 control mechanisms and F0 pathways are suggested by the separate control of cartilaginous adduction (adduction of the vocal processes, as produced by the LCA/IA muscles), and membranous vocal fold adduction (as produced through medial surface bulging upon TA activation). The influence of these two adduction control mechanisms on F0 is illustrated in Figs. 7(a)–7(d). For the two lower levels of TA activation [Figs. 7(a) and 7(b)], the F0 dependence on CT and LCA/IA is fairly complex: (1) in Fig. 7(a) (TA 1), a region exists in the high CT and low LCA/IA activation levels where phonation onset was not reached, and a full range of F0 variations is observed only at the highest levels of LCA/IA activation; (2) in Fig. 7(b) (TA 2), a region of decreased F0 occurred with increasing CT at the lower LCA/IA levels, and a transition from this region to falsetto-like register could be achieved by increasing LCA/IA activation. The areas of missing phonation onset and decreased F0 from CT activation are consistent with the role of CT in voicing and devoicing control, as presented by Löfqvist (1989); (3) The third level of TA activation [Fig. 7(c)] showed the simplest dependence of F0 on CT and LCA/IA, with an abrupt transition to a higher frequency register occurring at CT level 4 or 5; (4) The fourth (maximal) level of TA activation [Fig. 7(d)] illustrates that a full-range of F0 variations cannot be achieved for this high level of TA activation. A review of these four subplots shows that through these two independent means of glottal adduction (membranous and cartilaginous) a desired F0 may be achieved through a variety of neuromuscular strategies. To achieve a specific F0, sometimes the choice of which combination of glottal adduction maneuvers to implement may be impacted by the corresponding Pth [Figs. 9(a)–9(d)]. For example, through a comparison of Figs. 7(a) and 9(a) [or Figs. 7(b) and 9(b), etc.], with TA activation held constant, one could select a given F0, but with a variable LCA/IA activation in order to minimize Pth, a common measure of phonatory effort. Similarly, LCA/IA could be held constant while the TA and CT are varied to achieve the desired F0 and/or register changes using a variety of laryngeal activation pathways and phonation onset pressures [Figs. 8(a)–8(d) and 9(a)–9(d). Herbst et al. (2009) noted that independent control of membranous and cartilaginous adduction appeared to facilitate production of a variety of phonation types in singing. Moreover, through the use of vocal exercises, a follow-up study showed that both singers and nonsingers could be trained to produce phonatory output which required the independent manipulation of both cartilaginous and membranous vocal fold adduction (Herbst et al., 2011).
Our use of a canine larynx model to study F0 control might be perceived as limiting our understanding of F0 control in human phonation. However, it is not yet technically possible to study human larynges in a detailed manner as described in this paper. The canine larynx closely resembles the human larynx in neuromuscular anatomy, overall dimensions of the larynx and vocal folds, and morphology. The canine larynx may possess a less developed vocal ligament (Kurita et al., 1983), i.e., the intermediate and deep layers of the cover layer, and it has been claimed that the prominent vocal ligament in human larynx supports the majority of the longitudinal stresses and thus facilitates the production of higher fundamental frequencies in the upper vocal registers of the singing voice (Titze and Hunter, 2004). However, the literature is not consistent regarding the functional role of the vocal ligament, and the micro-anatomy of canine vocal ligament. For example, while Kurita et al. (1983) described a poorly developed vocal ligament in the canine larynx, Garrett et al. (2000) found a trilaminar LP layer that resembled the human larynx. In particular, Garrett et al. (2000) found a similar morphological structure, dense ground substance over dense elastin, in the intermediate layers of both human and canine larynges. Moreover, the deep LP layer of canine larynges contained more ground substance over collagen as compared to human larynges, which had mostly collagen. In our canine larynx experiments F0 ranged from 80 to 772 Hz, which covers the human speaking and singing range very well. Therefore, our in vivo canine larynx model is dynamically equivalent to an intact human larynx. For investigations of phonatory vocal fold behavior the similarities between the human and canine larynx in terms of physical dimensions, neuromuscular control, and the trilaminar structure of the vocal folds make the in vivo canine larynx a useful model of the intact human larynx. This study yielded systematic data on neuromuscular control of the larynx that has not previously been collected or analyzed. Further systematic studies of this type are needed to increase our understanding of neuromuscular control of phonation.
V. CONCLUSION
This in vivo canine study showed distinct roles and interactions of intrinsic laryngeal muscles in controlling glottal posture and fundamental frequency, and the aerodynamic consequences at phonation onset. The CT muscle was critical to raising F0, but could also decrease F0 when adductor muscle activation was low. The adductor muscles modulated glottal adduction and strain to facilitate a more detailed F0 control, possibly in an aerodynamically efficient manner by requiring less subglottal pressure to maintain high F0. The TA muscle could both increase and decrease F0 at all levels of CT and LCA/IA activation and was primarily responsible for register changes. The LCA/IA complex generally supported the TA in F0 control. Simultaneous activation of CT and laryngeal adductors, and independent control of the membranous and cartilaginous glottis allowed the larynx to control glottal posture and achieve the desired fundamental frequency along multiple laryngeal muscle activation pathways.
ACKNOWLEDGMENT
This study was supported by grant number R01 DC011300 from the National Institutes of Health.
REFERENCES
- 1.Atkinson, J. E. (1978). “ Correlation analysis of the physiological factors controlling fundamental voice frequency,” J. Acoust. Soc. Am. 63, 211–222 10.1121/1.381716 [DOI] [PubMed] [Google Scholar]
- 2.Berke, G. S. , Moore, D. M. , Hantke, D. R. , Hanson, D. G. , Gerratt, B. R. , and Burstein, F. (1987). “ Laryngeal modeling: Theoretical, in vitro, in vivo,” Laryngoscope 97, 871–881 10.1288/00005537-198707000-00019 [DOI] [PubMed] [Google Scholar]
- 3.Berry, D. A. , Herzel, H., Titze, I. R. , and Story, B. H. (1996). “ Bifurcations in excised larynx experiments,” J. Voice 10, 129–138 10.1016/S0892-1997(96)80039-7 [DOI] [PubMed] [Google Scholar]
- 29.Chhetri, D. K., Neubauer, J., Bergeron, J. L., Sofer, E., Peng, K. A., and Jamal, N. (2013). “ Effects of asymmetric superior laryngeal nerve stimulation on glottic posture, acoustics, vibration,” Laryngoscope 123(12 ), 3110–3116 10.1002/lary.24209 [DOI] [PMC free article] [PubMed] [Google Scholar]
- 4.Chhetri, D. K. , Neubauer, J., and Berry, D. A. (2010). “ Graded activation of the intrinsic laryngeal muscles for vocal fold posturing,” J. Acoust. Soc. Am. 127, EL127–EL133 10.1121/1.3310274 [DOI] [PMC free article] [PubMed] [Google Scholar]
- 5.Chhetri, D. K. , Neubauer, J., and Berry, D. A. (2012). “ Neuromuscular control of fundamental frequency and glottal posture at phonation onset,” J. Acoust. Soc. Am. 131(2 ), 1401–1412 10.1121/1.3672686 [DOI] [PMC free article] [PubMed] [Google Scholar]
- 6.Choi, H. S. , Berke, G. S. , Ye, M., and Kreiman, J. (1993a). “ Function of the thyroarytenoid muscle in a canine laryngeal model,” Ann. Otol. Rhinol. Laryngol. 102, 769–776 [DOI] [PubMed] [Google Scholar]
- 7.Choi, H. S. , Berke, G. S. , Ye, M., and Kreiman, J. (1993b). “ Function of the posterior cricoarytenoid muscle in phonation: In vivo laryngeal model,” Otolaryngol. Head Neck Surg. 109(6 ), 1043–1051 [DOI] [PubMed] [Google Scholar]
- 8.Choi, H. S. , Ye, M., and Berke, G. S. (1995). “ Function of the interarytenoid (IA) muscle in phonation: in vivo laryngeal model,” Yonsei Med. J. 36, 58–67 [DOI] [PubMed] [Google Scholar]
- 9.Farley, G. R. (1994). “ A quantitative model of voice F0 control,” J. Acoust. Soc. Am. 95, 1017–1029 10.1121/1.408465 [DOI] [PubMed] [Google Scholar]
- 30.Farley, G. R. (1996). “ A biomechanical laryngeal model of voice F0 and glottal width control,” J. Acoust. Soc. Am. 100(6 ), 3794–3812 10.1121/1.417218 [DOI] [PubMed] [Google Scholar]
- 10.Garrett, C. G. , Coleman, J. R. , and Reinisch, L. (2000). “ Comparative histology and vibration of the vocal folds: Implications for experimental studies in microlaryngeal surgery,” Laryngoscope 110, 814–824 10.1097/00005537-200005000-00011 [DOI] [PubMed] [Google Scholar]
- 11.Herbst, C. T. , Qiu, Q., Schutte, H. K. , and Švec, J. G. (2011). “ Membranous and cartilaginous vocal fold adduction in singing,” J. Acoust. Soc. Am. 129, 2253–2262 10.1121/1.3552874 [DOI] [PubMed] [Google Scholar]
- 12.Herbst, C. T. , Ternström, S., and Švec, J. G. (2009). “ Investigation of four distinct glottal configurations in classical singing–A pilot study,” J. Acoust. Soc. Am. 125, EL104–EL109 10.1121/1.3057860 [DOI] [PubMed] [Google Scholar]
- 13.Hirano, M. (1974). “ Morphological structure of the vocal cord as a vibrator and its variations,” Folia Phoniatr. (Basel) 26, 89–94 10.1159/000263771 [DOI] [PubMed] [Google Scholar]
- 14.Kempster, G. B. , Larson, C. R. , and Kistler, M. K. (1988). “ Effects of electrical stimulation of cricothyroid and thyroarytenoid muscles on voice fundamental frequency,” J. Voice 2, 221–229 10.1016/S0892-1997(88)80080-8 [DOI] [PubMed] [Google Scholar]
- 15.Kochis-Jennings, K. A. , Finnegan, E. M. , Hoffman, H. T. , and Jaiswal, S. (2012). “ Laryngeal muscle activity and vocal fold adduction during chest, chestmix, headmix, and head registers in females,” J. Voice 26, 182–193 10.1016/j.jvoice.2010.11.002 [DOI] [PubMed] [Google Scholar]
- 16.Kurita, S., Nagata, K., and Hirano, M. (1983). “ A comparative study of the layer structure of the vocal fold,” in Vocal Fold Physiology: Contemporary Research and Clinical Issues, edited by Bless D. M. and Abbs J. H. (College-Hill Press, San Diego: ), pp. 3–21 [Google Scholar]
- 17.Löfqvist, A., Baer, T., McGarr, N. S. , and Story, R. S. (1989). “ The cricothyroid muscle in voicing control,” J. Acoust. Soc. Am. 85, 1314–1321 10.1121/1.397462 [DOI] [PubMed] [Google Scholar]
- 18.Lowell, S. Y. , and Story, B. H. (2006). “ Simulated effects of cricothyroid and thyroarytenoid muscle activation on adult-male vocal fold vibration,” J. Acoust. Soc. Am. 120, 386–397 10.1121/1.2204442 [DOI] [PubMed] [Google Scholar]
- 19.Nasri, S., Beizai, P., Sercarz, J. A. , Kreiman, J., Graves, M. C. , and Berke, G. S. (1994). “ Function of the interarytenoid muscle in a canine laryngeal model,” Ann. Otol. Rhinol. Laryngol. 103, 975–982 [DOI] [PubMed] [Google Scholar]
- 20.Ohala J. (1970). “ Aspects of the control and production of speech,” UCLA working papers in phonetics; No. 15, http://escholarship.org/uc/item/1859f9tk (last viewed 11/20/13).
- 21.Roubeau, B., Henrich, N., and Castellengo, M. (2009). “ Laryngeal vibratory mechanisms: the notion of vocal register revisited,” J. Voice 23, 425–438 10.1016/j.jvoice.2007.10.014 [DOI] [PubMed] [Google Scholar]
- 31.Švec, J. G. , Schutte, H. K., and Miller, D. G. (1999). “ On pitch jumps between chest and falsetto registers in voice: Data from living and excised human larynges,” J. Acoust. Soc. Am. 106(3 ), 1523–1531 10.1121/1.427149 [DOI] [PubMed] [Google Scholar]
- 22.Švec, J. G. , Sundberg, J., and Hertegård, S. (2008). “ Three registers in an untrained female singer analyzed by videokymography, strobolaryngoscopy and sound spectrography,” J. Acoust. Soc. Am. 123, 347–353 10.1121/1.2804939 [DOI] [PubMed] [Google Scholar]
- 23.Titze, I. R. (1994). Principles of Voice Production (Prentice Hall, Englewood Cliffs, NJ: ), pp. 1–354 [Google Scholar]
- 24.Titze, I. R. , and Hunter, E. J. (2004). “ Normal vibration frequencies of the vocal ligament,” J. Acoust. Soc. Am. 115, 2264–2269 10.1121/1.1698832 [DOI] [PMC free article] [PubMed] [Google Scholar]
- 25.Titze, I. R. , Jiang, J., and Drucker, D. G. (1988). “ Preliminaries to the body-cover theory of pitch control,” J. Voice 1, 314–319 10.1016/S0892-1997(88)80004-3 [DOI] [Google Scholar]
- 26.Titze, I. R. , Luschei, E. S. , and Hirano, M. (1989). “ Role of thyroarytenoid muscle in regulation of fundamental frequency,” J. Voice 3, 213–224 10.1016/S0892-1997(89)80003-7 [DOI] [Google Scholar]
- 27.Titze, I. R. , and Talkin, D. T. A. (1979). “ Theoretical study of the effects of various laryngeal configurations on the acoustics of phonation,” J. Acoust. Soc. Am. 66, 60–74 10.1121/1.382973 [DOI] [PubMed] [Google Scholar]
- 32.Tokuda, I. T., Zemke, M., Kob, M., and Herzel, H. (2010). “ Biomechanical modeling of register transitions and the role of vocal tract resonators,” J. Acoust. Soc. Am. 127(3 ), 1528–1536 10.1121/1.3299201 [DOI] [PubMed] [Google Scholar]
- 28.Van den Berg, J. (1968). “ Register problems,” Ann. N.Y. Acad. Sci. 155, 129–134 10.1111/j.1749-6632.1968.tb56756.x [DOI] [PubMed] [Google Scholar]


