

The PDB is looked at to find data to answer the question ‘How well do our current screens cover crystallization space?’ and to try to find answers to the more general question about the most efficient strategy to employ in a crystallization campaign.
Keywords: crystallization, crystallization space
Abstract
The REMARK280 field of the Protein Data Bank is the richest open source of successful crystallization information. The REMARK280 field is optional and currently uncurated, so significant effort needs to be applied to extract reliable data. There are well over 15 000 crystallization conditions available commercially from 12 different vendors. After putting the PDB crystallization information and the commercial cocktail data into a consistent format, these data are used to extract information about the overlap between the two sets of crystallization conditions. An estimation is made as to which commercially available conditions are most appropriate for producing well diffracting crystals by looking at which commercial conditions are found unchanged (or almost unchanged) in the PDB. Further analyses include which commercial kits are the most appropriate for shotgun or more traditional approaches to crystallization screening. This analysis suggests that almost 40% of the crystallization conditions found currently in the PDB are identical or very similar to a commercial condition.
1. Introduction
The term ‘drunken search’ comes from the apocryphal story of the man spotted staggering his way around a lamp post, looking for his keys late at night. When the search proves unsuccessful, he is asked if he is sure that this was where he dropped his keys. ‘No’, the man slurs, ‘I dropped them over there in the park, but I can see better over here in the light’. This term has come to mean the process of performing a search where it is expedient, rather than where it is appropriate. We wondered if this was also a realistic description of protein crystallization screening as it is currently performed, and wondered how to even start finding an answer to this question. One way would be to look at successful crystallization conditions (or cocktails), that is, conditions which are associated with a successful structure deposition (this would be the appropriate initial search space), and compare these with crystallization conditions that are commercially available (the expedient search space). The analysis requires a number of steps to be in place. Firstly, we have to locate a source of successful crystallization conditions, secondly, one needs to find the commercial conditions and finally, one needs a way of comparing them. These steps sound straightforward, but are complicated by a profound lack of standards in the way that crystallization information is recorded (Peat et al., 2005 ▶; Newman et al., 2012 ▶). Of course, the crystallization condition is a very limited part of the entire process of protein crystallization: we should be considering the protein construct, post-translational modifications (expression systems), purification, affinity tags, protein concentration, protein formulation, protein ligands/binders, protein storage history, crystallization condition, crystallization method, drop size, drop ratio, crystallization consumables, temperature, time, gravity and so on. We limit this analysis to just the primary crystallization conditions; this information is the most available and any information about which kits are most successful has the advantage of being easy to incorporate into practice.
As part of the celebrations of the International Year of Crystallography, a series of articles on crystallization have been commissioned for publication in Acta Crystallographica Section F. Each of the articles focuses on a particular aspect of crystallization, and highlights the critical importance of crystallization for X-ray crystallography, which is to date the most widely adopted method for obtaining atomic-level structural information. A recent article in this series (Luft et al., 2014 ▶) discusses experimental approaches to protein crystallization (we use the term ‘protein crystallization’ to encompass the crystallization of all biological macromolecules). There are two main approaches. One is to systematically identify factors that are positively correlated with crystallization; the starting point could be a ‘mini-phase diagram’ determined by cloud-point analysis under a microscope or could be from an analysis of a limited set of sparse-matrix conditions. Once a starting point is obtained, one or more cycles of optimization are used to (hopefully) generate a diffraction-worthy crystal. The other major approach is to set up experiments using pre-mixed cocktails until a crystal of sufficient quality is obtained. The first approach we will call ‘traditional screening’ and the second ‘shotgun screening’. Most individual structural biology laboratories use traditional screening, whereas most of the structural genomics programs were mandated on the shotgun screening approach (Luft et al., 2014 ▶). Can we find commercial screens that are more appropriate for one or the other approach to crystal production? Particularly in the case of traditional screening, an estimation of the radius of convergence of a crystallization optimization becomes relevant. In the article by Luft and coworkers, the ‘mini-phase diagram’ approach to initial crystallization suggests using chemicals that have already been proven to be successful in protein crystallization at concentrations that have already been successful (Chan et al., 2013 ▶; Luft et al., 2014 ▶). Analyses of the most common chemicals used in crystallization have been performed before (Peat et al., 2005 ▶; Lu et al., 2012 ▶; Parker & Newstead, 2012 ▶; Offermann et al., 2014 ▶), and we wondered whether the conclusions from these earlier studies still hold today.
1.1. Successful conditions
There is really only one public source of data for large numbers of successful crystallization conditions and that is the Protein Data Bank (PDB; http://www.wwpdb.org). Other possible sources include the Knowledgebase (http://sbkb.org) from the Protein Structure Initiative (PSI; Berman et al., 2009 ▶), which is a portal for a huge amount of information from the US-based structural genomics projects but does not provide an easily accessible overview of collective crystallization results. Other large (non institute specific) crystallization databases [for example the Biological Macromolecule Crystallization Database (BMCD); Tung & Gallagher, 2009 ▶] present data which have been extracted from the REMARK280 field of the PDB, and moreover present the data in a way that is difficult to mine for questions about crystallization space in general, rather than for the details of the crystallization of specific protein targets. In this, the International Year of Crystallography (by United Nations decree), it is satisfying that the Protein Data Bank has received its 100 000th structure. Of these structures, almost 90% have been determined using the technique of X-ray crystallography and have a REMARK280 field associated with them. As the REMARK280 field of the PDB file is a non-mandatory field, not all PDB records contain information about the crystallization process; about one third of the records are empty. As the REMARK280 field is (currently) free-form, the non-empty entries require processing to extract the crystallization information. To parse a REMARK280 field completely requires that for each chemical name discovered there is an associated concentration and unit, and potentially a pH value. The data parsed from the field should be associated only with the crystallization cocktail, and not confounded with chemistry associated with the protein formulation, the cryoprotectant or a soaking solution. The chemical name has, in turn, to be parsed and matched to a list of known chemicals. The information about successful crystallization conditions as culled from the PDB is not ideal: we have no information about what was tried and we have very little information about other alternative conditions that might also have been successful in crystallizing a particular target. Another aspect of the data that needs to be considered is the distortion of the results by having multiples of the same or similar crystals. There are many hundreds of lysozyme structures in the PDB that have been obtained from crystals grown from the same condition (1 M sodium chloride, 0.1 M sodium acetate buffer pH 4.5), and perhaps a more appropriate snapshot of crystallization space would be created from PDB entries which were distinct in some way. The same protein sequence might be associated with more than one PDB entry, where each entry was from a different crystal form (or the same crystal form was grown from different crystallization cocktails): these would be rightfully included as distinct. Furthermore, if the same condition is used to crystallize two proteins with different amino-acid sequences then this condition should be counted twice.
1.2. Commercial conditions
There are a plethora of commercial screens available from a number of different vendors. These screens, in turn, have to be collated and parsed to provide a data set that has the same characteristics (organizational structure) as the data set obtained from successful conditions. Thus, we have to use the same chemical names and units as are used in the cleaned PDB data. One might assume that the extraction of data from the commercially available screens would be more straightforward than from the PDB, and certainly the data are less ambiguous. However, the descriptions of the commercial conditions are found dispersed across the different vendors’ websites (in all different formats) and need to be collated and translated into a common language before they can be used in the comparison with the successful crystallization conditions (Newman et al., 2010 ▶). There are many vendors of commercial crystallization conditions and quite some replication in the product offerings: for example, Hampton Research, Molecular Dimensions, Jena BioSciences, Qiagen and Sigma all offer a variation of the original Jancarik and Kim crystal screen (Jancarik & Kim, 1991 ▶) called Crystal Screen, Structure Screen, JBScreen, The Classics Suite and Basic Kit, respectively.
1.3. Comparison
The comparison step is very straightforward if we are trying to find identical matches using clean (complete and unambiguous) data; however, even the data extracted from the commercially available conditions are to some extent ambiguous. The expression ‘0.1 M Tris pH 8’ looks complete, until it is compared with ‘0.1 M Tris–HCl pH 8’. It is clear that the chemical ‘Tris’ needs to be combined with an acid to make a buffering solution. Are the two solutions described by these strings the same? We simply do not know. But even if they are not identical, then they are undoubtedly very similar. We need to include enough fuzziness in our definition of ‘exact’ to allow the ambiguity that is rife in the field of crystallization. Examples of commonly used terms which are somewhat ambiguous are mostly found in the buffering chemicals: ‘sodium citrate’, ‘HEPES’ and ‘sodium potassium phosphate’ are all imprecise descriptions of buffering systems. If we want to extend our analyses to solutions (and descriptions of those solutions) that are somehow related rather than exactly the same, we have to replace the concept of ‘matching’ with the concept of ‘similarity’ and try to quantify similarity. Similarity would allow one to recognize when the same chemical is used at a similar concentration in two solutions being compared and when related chemicals (salts that share a cation or anion, for example, or polyethylene glycols of similar molecular weight) are used in the two solutions being compared. For example, two cocktails ‘20%(w/v) PEG 3350, 0.1 M Tris–HCl pH 8’ and ‘20%(w/v) PEG 4K, 0.05 M Tris pH 8’ are intuitively ‘similar’. The quantitative comparison of crystallization conditions is a relative new endeavour, but is starting to become useful (Newman et al., 2010 ▶; Bruno et al., 2014 ▶).
2. Methods
A local database was created into which data from the PDB can be read (Peat et al., 2005 ▶). A Python script is used to parse this local database for information uploaded from the REMARK280 field of the PDB, as well as associated information (for example sequence). We assume that a crystallization condition contains one or more chemical factors, where each factor must contain a chemical name, a concentration and a concentration unit, and may contain a pH value. The code looks for a reasonable unit and concentration and then looks for an associated chemical name. This search is complicated by the inclusion of other information in the original REMARK280 field: some entries contain information about the formulation of the protein solution and others information about the cryoconditions or stabilization conditions. The script starts the initial search for strings from the beginning of the text or from the word ‘condition’ or ‘cocktail’ or ‘reservoir’. The putative chemical name string is mapped to a single, unambiguous name in three steps: firstly, all white spaces are reduced to a single space and extra characters (often special characters such as full stops, dashes etc.) are removed, then the chemical string is interpreted via an extensive set of regular expressions (several thousand) to a ‘cleaned’ name, and finally this is compared with a standard dictionary. The dictionary contains both a standard chemical name and an associated set of synonyms (Newman et al., 2014 ▶). The chemical string may map to a synonym or to a standard chemical name; either way, the standard chemical name is used as the final chemical identifier. The set of parsed chemical names and their associated values (concentration and unit) makes up the chemical condition. The work presented here assumes that the pH reported in the REMARK280 is the pH of a buffering chemical, and thus tries to match pH to the appropriate chemical by matching the reported pH to the known pK a values of the buffering chemicals. This works well; however, the reported pH may refer to the pH of the final condition, in which case this approach is inappropriate. In the distance comparison used in these analyses, the pH is treated as an independent term, so it does not matter which chemical it is associated with.
For example, the REMARK280 field of PDB entry 3lgf (Zerbe et al., 2002 ▶) contains the following text:
CRYSTALLIZATION CONDITIONS: 0.1 M HEPES-NA PH 7.0, 2% PEG 400 AND 2.4 M AMMONIUM SULPHATE., VAPOR DIFFUSION, HANGING DROP
In this case one string found would be ‘ammonium sulphate.’, which is converted to ‘ammonium sulphate’ and is then found in the synonym list as a variant of the standard chemical name ‘ammonium sulfate’. Similarly, HEPES-NA is mapped to the standard chemical name ‘sodium HEPES’ and is associated with the pH value 7.
The clean-up process results in a list of chemical factors and an estimation of how good the parsing process was. The final output from the REMARK280 of PDB entry 3lgf (above) is
PDB: 3LGF #parts passed/#total: 3 / 3
Reservoir:
0: 0.1000 M SODIUM HEPES pH 7.0
1: 2.0000 V/V POLYETHYLENE GLYCOL 400
2: 2.4000 M AMMONIUM SULFATE
There are other rules imposed to simplify the output data: where ranges for concentration were supplied in the description, only the first value carried through to the final list, thus
2.4 TO 2.6 M AMMONIUM SULFATE
is recorded in the condition as
2.4 M AMMONIUM SULFATE
Similarly, the operator ‘OR’ indicates that the text immediately following should be ignored, thus
25% PEG 3350 OR 20% PEG 6K
is translated into
25% W/V POLYETHYLENE GLYCOL 3350
The value for the concentration is recorded to four decimal places: this allows partial millimolar concentrations to be captured using molar as the standard unit. The unit is mapped to an appropriate unit for the chemical string. If the unit ‘%’ is given, it is mapped to either w/v or v/v if possible. The pH term is located by looking for the string ‘pH’ followed by a number between 0 and 14.
We estimate the conversion success of our process by looking at the information from about 100 random REMARK280 fields and the associated automated conversion by hand and comparing the two.
These parsed data (‘successful crystallization space’ or SCC) were used to generate a set of nonredundant conditions. A set of nonredundant PDB (NRPDB) entries was downloaded from ftp://ftp.ncbi.nih.gov/mmdb/nrtable/nrpdb.latest. This set was created by clustering PDB entries by sequence identity (using the most permissive criterion in the downloaded file; see Waterman & Vingron, 1994 ▶; Altschul et al., 1997 ▶), thus for each NRPDB entry there is a list of PDB entries with a similar protein sequence. For each of these NRPDB clusters a complete list of crystallization conditions was obtained from all of the REMARK280 fields for all the PDB entries within the cluster. The condition list for each cluster was then filtered to obtain a set of distinct conditions. All of the distinct crystallization conditions generated in this manner make up the set of ‘nonredundant successful crystallization conditions’ (NR-SCC), which were used for the subsequent analyses. This process is shown graphically in Fig. 1 ▶.
Figure 1.

The process of obtaining the nonredundant successful crystallization conditions (NR-SCC). For each sequence in the NRPDB, the PDB entries associated with that sequence are found. If there is a non-empty REMARK280 field in the PDB entry this is parsed and a crystallization condition is extracted. This gives the successful crystallization conditions (SCC). Each cluster of conditions associated with any one sequence is filtered (by excluding identical replicates) to give a list of distinct crystallization conditions associated with that sequence. The NR-SCC is the amalgam of all of the distinct sets of conditions, with one set for each sequence cluster.
There is a significant amount of duplication in the cocktails that one can purchase (commercial crystallization conditions or CCC), and we reduce the CCC by creating a set of distinct conditions in which each different condition found in commercial space is found only once. This reduced set makes up the ‘distinct commercial crystallization conditions’ (D-CCC). The two minimal sets (NR-SCC and D-CCC) were used to generate lists of chemical species and associated frequency of use, along with other metrics (average number of factors/condition, pH range).
The comparison between the parsed conditions from the NR-SCC and D-CCC was performed using a normalized dissimilarity distance metric as described previously (Newman et al., 2010 ▶), in which an exact match between two conditions results in a distance of ‘0’ and two conditions with no factor in common results in a distance of ‘1’. This metric captures the fuzziness of buffer ambiguity by creating buffer classes, which capture both the ambiguity in some buffer names (for example ‘MES’ versus ‘sodium MES’) or which group buffer systems that are similar but not identical (for example ‘potassium MES’ versus ‘sodium MES’); the Tris buffer class currently contains ‘Tris’, ‘Trizma’, ‘Tris acetate’, ‘Tris AMPD’, ‘Tris chloride’, ‘Tris maleate’, ‘Tris phosphate and ‘malate-MES-Tris’.
3. Results
3.1. Results from the NR-SCC
A snapshot of the PDB as of 10 May 2014 was used for these analyses. There were 88 432 REMARK280 fields, of which 60 249 (68%) contained some information. Of these, 59 701 were parsed automatically. To check the accuracy of the parsing, 160 random PDB codes were selected, which gave 105 entries with non-empty REMARK280 fields. The REMARK280 original text was compared with the parsed crystallization condition by hand. Of the 105 parsed conditions, 88 were judged to be correct: a success rate of 83%. This process was repeated a second time (with a different random set) and gave a success rate of just over 80%.
The NR-PDB contains 11 109 chains derived from 10 522 PDB entries (using a p-value of 10−7), and from this as a basis set we obtain the NR-SCC, which contains 43 322 parsed crystallization conditions. There are 5045 sequences in this data set with more than one distinct crystallization condition; for example, the sequence associated with Escherichia coli oligoribonuclease protein (found in, for example, PDB entry 2igi) has three distinct crystallization conditions associated with it. The NR-SCC data set was used to obtain a list containing distinct chemicals and their frequency (Table 1 ▶). On average, there were 2.9 chemical factors in each of the 43 322 conditions of the NR-SCC; a histogram of the number of chemicals in each condition is shown in Fig. 2 ▶. The pH values found in the NR-SCC range from 1.4 to 11.8, with the most common being 7.5. A frequency histogram of the pH distribution of the NR-SCC is shown in Fig. 3 ▶. The NR-SCC was also used to identify the 96 most successful commercial crystallization conditions (Supplementary Table S11).
Table 1. The ten most abundant chemicals found in the NR-SCC and the D-CCC.
| NR-SCC | D-CCC | ||
|---|---|---|---|
| Count | Chemical name | Count | Chemical name |
| 9078 | Polyethylene glycol 3350 | 1123 | HEPES |
| 8321 | Ammonium sulfate | 964 | Tris/Tris chloride |
| 6443 | Tris/Tris chloride | 783 | Sodium chloride |
| 6147 | HEPES | 781 | Polyethylene glycol 4000 |
| 5708 | Sodium chloride | 691 | Ammonium sulfate |
| 5626 | Polyethylene glycol 4000 | 681 | Acetate buffer |
| 4126 | Sodium acetate (not used as buffer) | 638 | MES |
| 4053 | Polyethylene glycol 8000 | 569 | Magnesium chloride |
| 4007 | Magnesium chloride | 561 | 2-Methyl-2,4-pentanediol |
| 3704 | Sodium acetate (buffer) | 548 | Polyethylene glycol 8000 |
Figure 2.

Histogram of the average number of chemical factors per condition for the D-CCC (blue columns) and the NR-SCC (red column). The values have been normalized to allow easier comparison. There is one commercial condition that contains 21 factors: this is condition E6 from the Silver Bullet Bio Screen from Hampton Research, which contains 20 amino acids and sodium HEPES buffer. 13.5% of the conditions (1088 of 8057) from the D-CCC have only one chemical factor; this bias, which is not mirrored in the NR-PDB, is probably a result of the number of commercially available additive screens that consist of a set of single chemicals.
Figure 3.

Histogram of pH bins found in the D-CCC (blue columns) and NR-SCC (red columns) data. The pH of each condition was rounded down to the nearest whole pH value for the binning analysis. The most common pH value in the D-CCC is 6.5 and that in the NR-SCC is 7.5, a whole pH unit difference.
3.2. Results from the D-CCC
256 commercial screens (15 906 conditions) from 12 vendors were used as the starting point to create the D-CCC. A complete list of vendors and screens used in this analysis can be found on the C6 website (http://c6.csiro.au). The D-CCC consists of 8057 distinct crystallization conditions, which suggests that on average there is twofold redundancy in the commercial conditions. However, the redundancy is not equally spread: there are 4669 conditions that are found only once and over 100 that are found more than ten times. The D-CCC was used to provide a list of distinct chemicals and frequencies as found in commercial crystallization conditions: the top ten chemicals are shown in Table 1 ▶. This analysis is confounded by two very diverse screens (Silver Bullets and Silver Bullets Bio, which contain 199 and 259 unique chemicals, respectively; Hampton Research) which add significant bias to the results of the chemical analysis. On average, there were 2.6 chemicals in each of the 8057 conditions of the D-CCC (Fig. 2 ▶). The pH range covered by the D-CCC is from 2.4 to 11.6, with the most common pH value being 6.5: a frequency histogram of the pH distribution is shown in Fig. 3 ▶.
3.3. Results from the comparison of the NR-SCC and D-CCC
Of the 8057 crystallization conditions of the D-CCC, 1123 (or 14%) map exactly onto one or more conditions of the NR-SCC. Looking from the other direction, of the 43 322 conditions in the NR-SCC 7240 (17%) are the same as a commercial condition. The ‘top 96’ commercial conditions from the NR-SCC are shown in Supplementary Table S1; this set of 96 commercial conditions captures 3553 conditions from the NR-SCC. Taking the set of 1123 commercial conditions, and searching the NR-SCC for near matches (0.1 similarity cutoff) gives 16 073 conditions (37%). Alternatively, taking the 43 322 conditions from the NR-SCC and finding conditions that are quite similar (again, 0.1 using the C6 metric) gives 2985 or 37% of the D-CCC.
One way of defining the success of a commercial screen is to count the number of conditions from the NR-SCC that are found in that screen. The ‘most successful’ screen by this metric is the MCSG_1 screen sold by Microlytic; the top ten most successful screens are shown in Table 2 ▶. Table 3 ▶ and Fig. 4 ▶ show the success of mapping of the NR-SCC to the MCSG_1 screen; there are 1795 instances of the conditions from the MCSG_1 screen found in the NR-SCC. However, the matches are not evenly spread: four conditions in particular seem to be very productive, with at 50 or more matches in the NR-SCC, and 27 of the 96 conditions in the MCSG_1 screen have no matches in the NR-SCC. The successful conditions from the MCSG_1 screen are often found in other commercial screens as well. Consider the two most successful conditions from MCSG_1, which are both found 80 times in the NR-SCC. Condition 65 [F5; 0.2 M acetate nonbuffer class; 20.0%(w/v) polyethylene glycol 3350] is also found in (amongst others) the JBScreen PACT++3 (Jena Bioscience), PACT Premier (Molecular Dimensions) and PEG/Ion (Hampton Research). Condition 70 (F10; 2.0 M ammonium sulfate; 0.1 M Tris buffer class pH 8.5) can be found in the BioXtal (XtalQuest), Basic Kit (Sigma) and 3D Structure Screen (Molecular Dimensions) and others.
Table 2. The ten ‘most successful’ commercial screens, by condition.
The number in the first column refers to the number of instances of conditions that are found in the NR-SCC that are also found in the screen in column 2.
| Count from NR-SCC | Screen name | Vendor |
|---|---|---|
| 1795 | MCSG_1 | Microlytic |
| 1716 | PEG/Ion HT Screen | Hampton Research |
| 1661 | Index Screen | Hampton Research |
| 1618 | The JCSG Core Suite I | Qiagen |
| 1530 | The Classics II Suite | Qiagen |
| 1517 | The Classic Suite | Qiagen |
| 1431 | The PEGs Suite | Qiagen |
| 1404 | Crystal Screen HT | Hampton Research |
| 1404 | Structure Screen 1 and 2 HT-96 | Molecular Dimensions |
| 1373 | PEG/Ion Screen | Hampton Research |
Table 3. Mapping of the NR-SCC conditions onto the most successful commercial screen (by condition match) MCSG_1.
The first column gives the condition number within the screen and the second gives the count of the number of times the condition is found in the NR-SCC. This list does not include the 27 conditions that have no matches in the NR- SCC (conditions 3, 4, 8, 10, 13, 14, 19, 20, 22, 28, 30, 34, 35, 38, 39, 45, 50, 51, 64, 67, 69, 73, 74, 84, 88, 92 and 95).
| Well No. | Frequency | Condition |
|---|---|---|
| 65 | 80 | 0.2M acetate nonbuffer class; 20.0%(w/v) polyethylene glycol 3350 |
| 70 | 80 | 2.0M ammonium sulfate; 0.1M Tris buffer class pH 8.5 |
| 93 | 52 | 0.1M bis-tris buffer class pH 5.5; 25.0%(w/v) polyethylene glycol 3350 |
| 7 | 50 | 0.2M magnesium chloride; 0.1M bis-tris buffer class pH 5.5; 25.0%(w/v) polyethylene glycol 3350 |
| 57 | 46 | 0.2M calcium chloride; 20.0%(w/v) polyethylene glycol 3350 |
| 6 | 43 | 0.2M ammonium sulfate; 0.1M bis-tris buffer class pH 5.5; 25.0%(w/v) polyethylene glycol 3350 |
| 81 | 43 | 0.2M sodium formate; 20.0%(w/v) polyethylene glycol 3350 |
| 27 | 42 | 0.2M magnesium formate pH 5.9; 20.0%(w/v) polyethylene glycol 3350 |
| 48 | 42 | 0.2M ammonium chloride pH 6.3; 20.0%(w/v) polyethylene glycol 3350 |
| 26 | 41 | 0.2M lithium sulfate; 0.1M bis-tris buffer class pH 5.5; 25.0%(w/v) polyethylene glycol 3350 |
| 60 | 41 | 2.4M malonate nonbuffer class |
| 76 | 41 | 0.2M potassium sodium tartrate; 20.0%(w/v) polyethylene glycol 3350 |
| 94 | 40 | 25.0%(w/v) polyethylene glycol 3350; 0.1M HEPES buffer class pH 7.5 |
| 9 | 39 | 0.2M magnesium chloride; 0.1M HEPES buffer class pH 7.5; 25.0%(w/v) polyethylene glycol 3350 |
| 16 | 39 | 0.2M magnesium chloride; 0.1M bis-tris buffer class pH 6.5; 25.0%(w/v) polyethylene glycol 3350 |
| 17 | 39 | 0.2M magnesium chloride; 0.1M tris buffer class pH 8.5; 25.0%(w/v) polyethylene glycol 3350 |
| 15 | 37 | 0.2M acetate nonbuffer class; 0.1M bis-tris buffer class pH 5.5; 25.0%(w/v) polyethylene glycol 3350 |
| 43 | 34 | 20.0%(w/v) polyethylene glycol 3000; 0.1M citrate buffer class pH 5.5 |
| 66 | 34 | 0.2M potassium thiocyanate; 20.0%(w/v) polyethylene glycol 3350 |
| 61 | 33 | 0.1M bis-tris buffer class pH 6.5; 20.0%(w/v) polyethylene glycol monomethyl ether 5000 |
| 96 | 33 | 0.2M lithium sulfate; 0.1M HEPES buffer class pH 7.5; 25.0%(w/v) polyethylene glycol 3350 |
| 77 | 32 | 2.0M ammonium sulfate; 0.1M bis-tris buffer class pH 6.5 |
| 91 | 32 | 2.0M ammonium sulfate; 0.1M bis-tris buffer class pH 5.5 |
| 49 | 30 | 2.0M ammonium sulfate; 0.1M HEPES buffer class pH 7.5 |
| 68 | 30 | 3.5M sodium formate pH 7.0 |
| 21 | 29 | 0.2M magnesium chloride; 20.0%(w/v) polyethylene glycol 3350 |
| 53 | 29 | 1.6M magnesium sulfate; 0.1M MES buffer class pH 6.5 |
| 71 | 29 | 0.2M ammonium sulfate; 0.1M HEPES buffer class pH 7.5; 25.0%(w/v) polyethylene glycol 3350 |
| 72 | 29 | 0.1M potassium thiocyanate; 30.0%(w/v) polyethylene glycol monomethyl ether 2000 |
| 37 | 28 | 0.2M ammonium sulfate; 0.1M bis-tris buffer class pH 6.5; 25.0%(w/v) polyethylene glycol 3350 |
| 40 | 28 | 0.2M sodium thiocyanate pH 6.9; 20.0%(w/v) polyethylene glycol 3350 |
| 1 | 27 | 0.1M HEPES buffer class pH 7.5; 20.0%(w/v) polyethylene glycol 8000 |
| 29 | 27 | 0.2M magnesium acetate; 20.0%(w/v) polyethylene glycol 3350 |
| 36 | 27 | 0.1M bis-tris buffer class pH 6.5; 25.0%(w/v) polyethylene glycol 3350 |
| 18 | 25 | 0.2M acetate nonbuffer class; 0.1M MES buffer class pH 6.0; 20.0%(w/v) polyethylene glycol 8000 |
| 23 | 24 | 0.2M magnesium chloride; 0.1M Tris buffer class pH 8.5; 20.0%(w/v) polyethylene glycol 8000 |
| 58 | 24 | 0.2M diammonium tartrate; 20.0%(w/v) polyethylene glycol 3350 |
| 41 | 23 | 0.2M ammonium formate pH 6.6; 20.0%(w/v) polyethylene glycol 3350 |
| 55 | 22 | 0.2M ammonium iodide; 20.0%(w/v) polyethylene glycol 3350 |
| 62 | 22 | 0.2M acetate nonbuffer class; 0.1M bis-tris buffer class pH 6.5; 25.0%(w/v) polyethylene glycol 3350 |
| 25 | 21 | 0.1M acetate nonbuffer class; 0.1M bis-tris buffer class pH 5.5; 17.0%(w/v) polyethylene glycol 10000 |
| 79 | 21 | 0.1M Tris buffer class pH 8.5; 25.0%(w/v) polyethylene glycol 3350 |
| 80 | 21 | 0.2M ammonium sulfate; 0.1M Tris buffer class pH 8.5; 25.0%(w/v) polyethylene glycol 3350 |
| 85 | 21 | 0.2M ammonium fluoride; 20.0%(w/v) polyethylene glycol 3350 |
| 89 | 20 | 20.0%(w/v) polyethylene glycol 3350; 1.5%(w/v) potassium chloride |
| 47 | 17 | 0.2M sodium iodide; 20.0%(w/v) polyethylene glycol 3350 |
| 78 | 17 | 0.1M acetate buffer class pH 4.5; 25.0%(w/v) polyethylene glycol 3350 |
| 52 | 16 | 0.2M lithium sulfate; 0.1M Tris buffer class pH 8.5; 25.0%(w/v) polyethylene glycol 3350 |
| 82 | 16 | 0.1M magnesium formate; 15.0%(w/v) polyethylene glycol 3350 |
| 24 | 15 | 0.1M bis-tris buffer class pH 6.5; 28.0%(w/v) polyethylene glycol monomethyl ether 2000 ▶ |
| 46 | 15 | 0.2M acetate nonbuffer class; 0.1M sodium cacodylate pH 6.5; 40.0%(v/v) polyethylene glycol 300 |
| 2 | 14 | 0.1M CHES nonbuffer class; 30.0%(w/v) polyethylene glycol 3000 |
| 44 | 14 | 0.58%(w/v) sodium chloride; 1.5M ammonium sulfate; 0.1M bis-tris buffer class pH 6.5 |
| 83 | 14 | 0.1M citrate buffer class pH 4.2; 40.0%(v/v) polyethylene glycol 300 |
| 87 | 14 | 0.2M lithium acetate; 20.0%(w/v) polyethylene glycol 3350 |
| 54 | 13 | 0.2M potassium sulfate; 20.0%(w/v) polyethylene glycol 3350 |
| 90 | 13 | 3.5M sodium formate; 0.1M acetate buffer class pH 4.6 |
| 31 | 12 | 0.2M calcium chloride; 0.1M Tris buffer class pH 8.5; 25.0%(w/v) polyethylene glycol 4000 |
| 63 | 10 | 0.2M citrate buffer class pH 5.0; 20.0%(w/v) polyethylene glycol 3350 |
| 11 | 8 | 0.2M magnesium chloride; 0.1M MES buffer class pH 6.5; 10.0%(w/v) polyethylene glycol 4000 |
| 75 | 8 | 0.1M bis-tris propane buffer class pH 7.0; 1.5M ammonium sulfate |
| 86 | 8 | 0.2M potassium iodide; 20.0%(w/v) polyethylene glycol 3350 |
| 5 | 7 | 1.17%(w/v) sodium chloride; 1.26M ammonium sulfate; 0.1M acetate buffer class pH 4.5 |
| 42 | 5 | 1.4M malonate nonbuffer class; 0.1M bis-tris propane buffer class pH 7.0 |
| 32 | 3 | 0.2M ammonium sulfate; 0.1M citrate buffer class pH 5.6; 25.0%(w/v) polyethylene glycol 4000 |
| 12 | 2 | 0.2M calcium chloride; 0.1M Tris buffer class pH 8.5; 20.0%(w/v) polyethylene glycol 4000 |
| 56 | 2 | 0.1M Tris buffer class pH 8.5; 1.8M magnesium sulfate |
| 33 | 1 | 0.8M lithium chloride; 0.1M Tris buffer class pH 8.5; 32.0%(w/v) polyethylene glycol 4000 |
| 59 | 1 | 1.0M potassium sodium phosphate pH 8.2 |
Figure 4.

(a) Mapping of successful conditions of the NR-SCC onto the conditions of the MCSG_1 screen. Over 70% of the conditions of the MCSG_1 screen are found unchanged in the NR-PDB data set, with conditions F5 (No. 65) and F10 (No. 70) both being found 80 times in the successful conditions from the PDB. However, 27 conditions do not map onto any condition of the NR-SCC. In total, 1795 conditions from the NR-SCC are found in the MCSG_1 screen. (b) Ranking of the 96 most successful commercial conditions found in the NR-SCC. The graph shows that there is no obvious subset of conditions which is more successful than the others, although there is arguably a distinction between the first ten ranked conditions and the remaining 86. In all, 3552 conditions from the NR-SCC are captured in these ‘top 96’ conditions. For descriptions of the conditions in the ‘top 96’, see Supplementary Table S1 or see http://c6.csiro.au.
Another success metric for a screen would be if a screen were to cover a similar chemical space as the NR-SCC. Using chemical space coverage, the ‘most successful’ screen changes from the MCSG_1 screen to the JBScreen Wizard 3 and 4 HTS screen sold by Jena Bioscience. The top ten most successful screens by this criterion are shown in Table 4 ▶. The JBScreen Wizard 3 and 4 HTS screen has 69 distinct chemicals in it, and the top chemicals in the screen are Tris chloride, sodium HEPES, polyethylene glycol 3350 and ammonium sulfate, most of which are found as the most used chemicals in the NR-SCC (Table 1 ▶).
Table 4. The ten ‘most successful’ commercial screens by chemical.
Note that five of the top ten in this table are very similar screens: JCSG-plus, The JCSG+ Suite, JCSG+, JCSG++ HTS and The JCSG Core Suite II.
| Count from NR-SCC | Screen name | Vendor |
|---|---|---|
| 4083 | JBScreen Wizard 3 and 4 HTS | Jena Bioscience |
| 4049 | JBScreen Kinase HTS | Jena Bioscience |
| 4021 | MemGold2 | Molecular Dimensions |
| 3890 | JBScreen Cryo HTS | Jena Bioscience |
| 3857 | JCSG-plus screen | Molecular Dimensions |
| 3769 | PEGRx HT | Hampton Research |
| 3748 | The JCSG+ Suite | Qiagen |
| 3672 | JCSG+ screen | Rigaku Reagents |
| 3559 | JBScreen JCSG++ HTS | Jena Bioscience |
| 3520 | The JCSG Core Suite II | Qiagen |
4. Discussion
The REMARK280 field was added to the information captured by the PDB in 1997 (Berman et al., 2000 ▶) and is a non-mandatory field for deposition. Initially, the instructions associated with the field were quite vague (‘Crystallization conditions e.g. Ammonium sulfate’), which led to a number of groups believing that more detailed information could not be captured. Since then, more detailed instructions have been provided; Fig. 5 ▶ shows the help window from the current version of the AutoDep tool (Dutta et al., 2009 ▶). Even so, there are still a large number of NULL entries: in 2005 24% of the REMARK280 fields were NULL (Peat et al., 2005 ▶) and in this current work 32% are NULL. This is a worrying trend as the PDB is effectively the only repository for this primary information on crystallization conditions and these are needed to improve the field of crystallization. The information found in the (non-NULL) REMARK280 fields varies enormously from entries that contain detailed descriptions of the protein solution, the crystallization cocktail, the cryoprotection or stabilization solutions as well as details about the method (e.g. PDB entry 2p3u) to entries which are terse to the point of ambiguity (e.g. PDB entry 2h2f). Both extremes offer challenges in the extraction of crystallization-cocktail information: in the former case identifying which parts of the text refer to the cocktail and not the other solutions is problematic, while in the latter case just trying to identify the chemicals or concentrations used is the issue.
Figure 5.
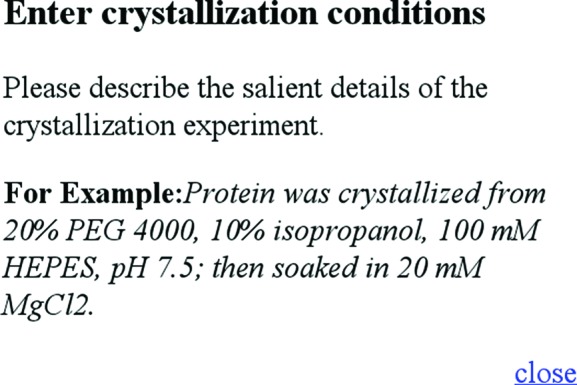
The help window associated with the current AutoDep tool for the REMARK280 field. This example is much more detailed than in earlier versions, but if followed exactly still could lead to problems: the units of PEG 4000 and 2-propanol are the same (%), although in practice the PEG 4000 unit is most likely to be %(w/v) and the 2-propanol unit %(v/v). The HEPES chemical is ambiguous, and the inclusion of MgCl2 as a post-crystallization soak would certainly confuse our current parsing script (Tagari et al., 2006 ▶).
In our initial work in this area from 2005 (Peat et al., 2005 ▶), the Python script used for parsing the PDB into the local database had a lot of exceptions, which in essence said ‘in the case of PDB ID XXX write out the following string’. By doing so, the script encoded a human’s interpretation of the REMARK280. In this work, we tried to move away from this model to a more extensible method. However, we kept the exceptions from our earlier work, but did not add further exceptions. In 2005, essentially all of the information parsed out of the PDB was correct and complete. In this version, we estimate that 80–85% of the interpreted REMARK280 fields are both correct and complete; the hand checks that were performed suggested that the 15–20% which were not perfect were most likely to be incomplete, where the parsing script had failed to pick up one or more components of the chemical condition described in the original REMARK280 or the REMARK280 was missing some piece of the information. Although the current parsing script does capture ranges, and can capture alternatives (20% PEG 600 or PEG MME 550), we do not write these out to the final interpreted condition, as our distance metric comparison does not handle ranges or alternatives. Our parsing success rate does mean that the results presented here have to be interpreted cautiously, but the numbers are large and are likely to show overall trends. Even though the parsing is imperfect, the value of this approach is that as the number of conditions for the analyses becomes ever larger the parsing can still be performed without thousands of hours of human intervention.
The final set of parsed crystallization conditions was filtered to remove duplicate sequence/cocktail pairs: for example, there are over 150 PDB entries that are hen egg-white lysozyme (HEWL) grown in the well known sodium acetate/sodium chloride crystallization cocktail. Simply filtering the PDB by sequence to remove such duplication is inappropriate as the same sequence can be found in crystals grown under many different conditions. For example, a small-molecule/protein study where co-crystallization was used to generate the crystal of each complex will lead to many entries with the same protein sequence (but different ligands), all grown under different conditions. A simple sequence filter would only pull out one of the crystallization conditions. The method we used considers sequence, then finds all associated PDB entries (a sequence cluster) and then finds the set of distinct crystallization conditions associated with each cluster, giving the set of crystallization conditions which have a unique combination of ‘sequence’ and ‘crystallization condition’ (NR-SCC). Comparing the NR-SCC (∼43 000 entries) with the total number of parsed entries from the REMARK280 (∼60 000 entries) suggest that there are of the order of 17 000 duplicate entries where both the sequence and the crystallization condition are the same. The 150 PDB entries associated with HEWL and NaCl/acetate make up part of these 17 000 duplicates. There were just about 11 000 distinct sequences, and around 5000 or so with only one condition associated with them, which suggests that each of the other 6000 sequences had on average between six and seven different associated crystallization conditions.
In the decade since 2005, there have been some changes in the collective chemical data: polyethylene glycol 3350 is now the most popular chemical in the NR-PDB, leaping up 11 places. Less expectedly, both MES and citrate buffers have been knocked out of the most recent ‘top ten’ list of chemicals, even though MES is still one of the most common chemicals found in the D-CCC. We notice that polyethylene glycol 3350 is not in the top ten of the D-CCC whereas MPD is commonly found in the D-CCC; it is in the top ten most used chemicals and yet is found as only the 20th most popular chemical in the NR-SCC and is only found in one condition of the ‘top 96’ commercial conditions (Supplementary Table S1). This suggests that the sampling provided by the commercial conditions does not completely dictate the successful results. This is a question that has plagued the field of high-throughput crystallization: when is it reasonable to start limiting the search space for crystals based on our past experience?
Another notable difference is the explosion in the number of screens: the work in 2005 used information from the 88 commercial screens available at the time; there are now almost three times as many commercial screens available. Part of the rationale for this current work was to try to provide a basis for winnowing down this plethora of commercial screens to a number that can be easily set up and managed by individual laboratories.
More and more, shotgun screening (setting up multiple commercial conditions until a suitable crystal is found) is the method of choice for generating crystals, and certainly many structural genomics projects are based on this approach. Given this, it is particularly relevant to know what screens contain the greatest number of conditions that have proven successful. Our analyses are limited only to a glimpse of the outcome of the crystallization experiments; we do not know what conditions were tested. Therefore, our ‘winning’ screen for the shotgun approach to crystallization may be successful because it was set up a lot or because it has a good overlap with many of the screens that were set up a lot. Given the similarity between the ‘top ten’ most successful screens by condition, we suspect that the most successful screen from our analysis (MCSG_1) just happens to contain the highest number of conditions from the NR-SCC; other work has not suggested that this screen is particularly widely used (Newman et al., 2013 ▶). One institute where the MCSG_1 screen is certainly used is the Midwest Center for Structural Genomics (http://www.mcsg.anl.gov/), from whence the screen came. The description of the MCSG_1 screen on the MCSG website explains that the screen is the result of two rounds of screen evolution, so it is no accident that this screen contains many successful conditions. The MCSG is part of the larger PSI, which has contributed over 6500 X-ray structures to the PDB (http://sbkb.org/). The MCSG website suggests that about 50% of the structures that it produces come from crystals grown in initial screens (i.e. from shotgun screening); assuming that this statistic holds over the whole PSI, we would expect over 3000 structures in the PDB to have come directly from initial screens from the PSI alone: almost half of the exact matches we find from our analysis. Although currently the MCSG_1 screen is the commercial screen with the best overlap with the commercial conditions in the NR-SCC, the ‘top 96’ screen (obtained from the whole PDB rather than just one major centre) would have almost double the overlap.
Optimization from a commercial condition could tweak its factors in any number of ways, and it seems reasonable that ten independently optimized cocktails, all of which came from the same starting condition hit (but were optimized for different protein targets), would most likely all be different. The success of optimization can be estimated by looking at the match between D-CCC and NR-SCC when the matching criterion is relaxed from an exact match to being within 0.1 (according to the C6 distance metric): this value was chosen as it seems likely that a not overambitious optimization would be captured by this distance (see Table 5 ▶ for an example). Assuming that the same conditions from the D-CCC which gave exact matches with the NR-SCC were used as a starting point for light optimization, this would give almost 40% of the conditions in the NR-SCC. This suggests that about 40% of targets that give some hit in initial screening are relatively easily optimized to something that is ‘good enough’ to end up as a structure and deposited in the PDB.
Table 5. Chemical conditions that are within 0.1 of the condition 2.0M ammonium sulfate; 0.100M Tris buffer class pH 8.2 (condition 80 from the CubicPhase I Suite from Qiagen) using the C6 similarity metric.
| 1.5 | M | Ammonium sulfate | 0.1 | M | Tris buffer class | pH | 8 |
| 1.5 | M | Ammonium sulfate | 0.1 | M | Tris buffer class | pH | 8.5 |
| 1.6 | M | Ammonium sulfate | 0.1 | M | Tris buffer class | pH | 8 |
| 1.8 | M | Ammonium sulfate | 0.1 | M | Tris buffer class | pH | 8.5 |
| 2 | M | Ammonium sulfate | 0.1 | M | Tris buffer class | pH | 8 |
| 2 | M | Ammonium sulfate | 0.1 | M | Tris buffer class | pH | 8.2 |
| 2 | M | Ammonium sulfate | 0.1 | M | Tris buffer class | pH | 8.5 |
| 2.4 | M | Ammonium sulfate | 0.1 | M | Tris buffer class | pH | 8 |
| 2.4 | M | Ammonium sulfate | 0.1 | M | Tris buffer class | pH | 8.5 |
| 2.5 | M | Ammonium sulfate | 0.1 | M | Tris buffer class | pH | 8.5 |
Most diffraction-quality crystals do not grow directly from screening conditions (Newman et al., 2013 ▶), and one or more cycles of optimization have to be performed. In this case, the goal of the initial screening is to get close enough to a crystal that a condition can be recognized as being a lead, and optimization techniques can then finish the process. In this case, the use of screens that cover the appropriate chemical space may be a very valid approach. By this measure, we find a different cluster of screens as being the ‘most successful’, but again there is a great degree of similarity between these screens. Interestingly, this cluster may be described as being ‘JCSG+’-like: this screen is based on early work in the structural genomics era performed at the Joint Center for Structural Genomics using only proteins from Thermotoga maritima (Page et al., 2003 ▶; Newman et al., 2005 ▶), suggesting that the area of crystallization space sampled by this subset of thermophilic proteins is a good estimation of the space sampled by all (soluble) proteins.
There are at least two interpretations of the small number (1123/8057; 14%) of the D-CCC cocktails that are found unchanged in the NR-SCC. Firstly, this could be a result of the bias in the trialling of the commercial conditions; eventual success could just be a function of sampling enough times. Certainly some of the 8057 distinct conditions will be conditions from additive screens, which would rarely, if ever, be used by themselves (these are used in combination with a base condition; Newman et al., 2008 ▶; Luft et al., 2014 ▶), so the number of direct matches will come from a smaller set than the D-CCC: probably closer to 7000 distinct, commercial, non-additive conditions. We know that the 14% of unchanged commercial conditions expands to almost 40% when we look at a similarity distance of 0.1; this suggests that even though there are 8000 distinct conditions in the D-CCC, many of the distinct conditions are really quite similar.
One analysis which we cannot perform with the current data is obtaining an estimate of why the crystallization cocktail is successful. Are our current cocktails successful because they engender crystallization or are they supporting both crystallization AND protein stability at the same time? If this is this case, working on the protein formulation and having a limited number of crystallization cocktails might be the best way forward. Of course this has been suggested before (Dale et al., 2003 ▶), and techniques have been developed based around this concept: for example, optimum solubility screening (Jancarik et al., 2004 ▶), protein formulation by differential scanning fluorimetry (Niesen et al., 2007 ▶; Seabrook & Newman, 2013 ▶) and surface-entropy reduction (Derewenda, 2011 ▶).
5. Conclusion
This work highlights a number of points: firstly, pointing out (again) the need for systematic reporting of crystallization data, as any data-mining studies will only be as reliable as the data upon which they are based. Despite the overall poor data available for protein crystallization, it seems clear that there are commercial screens that do provide a reasonable hit rate for shotgun screening, and that cover, to a large extent, the same chemical space as the collective successful crystallization conditions. Although only 17% of successful crystallization conditions from the PDB are identical to a commercial condition, almost 40% of the PDB conditions can be obtained by a trivial optimization of a commercial cocktail. So around the lamp post is a reasonable place to start a crystallization search, but the flashlight of optimization will most likely be needed to explore beyond this starting point.
Supplementary Material
SupplementaryTable S1.. DOI: 10.1107/S2053230X1401841X/en5555sup1.pdf
Acknowledgments
We thank the PDB for capturing the data and in particular people at PDBe for discussions on parsing these data successfully. We also acknowledge CSIRO’s Capability Development Fund for supporting VJF.
Footnotes
Supporting information has been deposited in the IUCr electronic archive (Reference: EN5555).
References
- Altschul, S. F., Madden, T. L., Schäffer, A. A., Zhang, J., Zhang, Z., Miller, W. & Lipman, D. J. (1997). Gapped BLAST and PSI-BLAST: a new generation of protein database search programs. Nucleic Acids Res. 25, 3389–3402. [DOI] [PMC free article] [PubMed]
- Berman, H. M., Westbrook, J., Feng, Z., Gilliland, G., Bhat, T. N., Weissig, H., Shindyalov, I. N. & Bourne, P. E. (2000). The Protein Data Bank. Nucleic Acids Res. 28, 235–242. [DOI] [PMC free article] [PubMed]
- Berman, H. M. et al. (2009). The protein structure initiative structural genomics knowledgebase. Nucleic Acids Res. 37, D365–D368. [DOI] [PMC free article] [PubMed]
- Bruno, A. E., Ruby, A. M., Luft, J. R., Grant, T. D., Seetharaman, J., Montelione, G. T., Hunt, J. F & Snell, E. H. (2014). Comparing chemistry to outcome: the development of a chemical distance metric, coupled with clustering and hierarchal visualization applied to macromolecular crystallography. PLoS One, 9, e100782. [DOI] [PMC free article] [PubMed]
- Chan, M., Fazio, V. J. & Newman, J. (2013). Using graphs to represent crystallization conditions. Cryst. Growth Des. 13, 1290–1294.
- Dale, G. E., Oefner, C. & D’Arcy, A. (2003). The protein as a variable in protein crystallization. J. Struct. Biol. 142, 88–97. [DOI] [PubMed]
- Derewenda, Z. S. (2011). It’s all in the crystals... Acta Cryst. D67, 243–248.
- Dutta, S., Burkhardt, K., Young, J., Swaminathan, G. J., Matsuura, T., Henrick, K., Nakamura, H. & Berman, H. M. (2009). Data deposition and annotation at the Worldwide Protein Data Bank. Mol. Biotechnol. 42, 1–13. [DOI] [PubMed]
- Jancarik, J. & Kim, S.-H. (1991). Sparse matrix sampling: a screening method for crystallization of proteins. J. Appl. Cryst. 24, 409–411.
- Jancarik, J., Pufan, R., Hong, C., Kim, S.-H. & Kim, R. (2004). Optimum solubility (OS) screening: an efficient method to optimize buffer conditions for homogeneity and crystallization of proteins. Acta Cryst. D60, 1670–1673. [DOI] [PubMed]
- Lu, H.-M., Yin, D.-C., Liu, Y.-M., Guo, W.-H. & Zhou, R.-B. (2012). Correlation between protein sequence similarity and crystallization reagents in the Biological Macromolecule Crystallization Database. Int. J. Mol. Sci. 13, 9514–9526. [DOI] [PMC free article] [PubMed]
- Luft, J. R., Newman, J. & Snell, E. H. (2014). Crystallization screening: the influence of history on current practice. Acta Cryst. F70, 835–853. [DOI] [PMC free article] [PubMed]
- Newman, J., Bolton, E. E., Müller-Dieckmann, J., Fazio, V. J., Gallagher, D. T., Lovell, D., Luft, J. R., Peat, T. S., Ratcliffe, D., Sayle, R. A., Snell, E. H., Taylor, K., Vallotton, P., Velanker, S. & von Delft, F. (2012). On the need for an international effort to capture, share and use crystallization screening data. Acta Cryst. F68, 253–258. [DOI] [PMC free article] [PubMed]
- Newman, J., Burton, D. R., Caria, S., Desbois, S., Gee, C. L., Fazio, V. J., Kvansakul, M., Marshall, B., Mills, G., Richter, V., Seabrook, S. A., Wu, M. & Peat, T. S. (2013). Crystallization reports are the backbone of Acta Cryst. F, but do they have any spine? Acta Cryst. F69, 712–718. [DOI] [PMC free article] [PubMed]
- Newman, J., Egan, D., Walter, T. S., Meged, R., Berry, I., Ben Jelloul, M., Sussman, J. L., Stuart, D. I. & Perrakis, A. (2005). Towards rationalization of crystallization screening for small- to medium-sized academic laboratories: the PACT/JCSG+ strategy. Acta Cryst. D61, 1426–1431. [DOI] [PubMed]
- Newman, J., Fazio, V. J., Lawson, B. & Peat, T. S. (2010). The C6 web tool: a resource for the rational selection of crystallization conditions. Cryst. Growth Des. 10, 2785–2792.
- Newman, J., Peat, T. S. & Savage, G. P. (2014). What’s in a name? Moving towards a limited vocabulary for macromolecular crystallisation. Aust. J. Chem., 10.1071/CH14199.
- Newman, J., Pham, T. M. & Peat, T. S. (2008). Phoenito experiments: combining the strengths of commercial crystallization automation. Acta Cryst. F64, 991–996. [DOI] [PMC free article] [PubMed]
- Niesen, F. H., Berglund, H. & Vedadi, M. (2007). The use of differential scanning fluorimetry to detect ligand interactions that promote protein stability. Nature Protoc. 2, 2212–2221. [DOI] [PubMed]
- Offermann, L. R., He, J. Z., Mank, N. J., Booth, W. T. & Chruszcz, M. (2014). Carboxylic acids in crystallization of macromolecules: learning from successful crystallization experiments. J. Struct. Funct. Genomics, 15, 13–24. [DOI] [PubMed]
- Page, R., Grzechnik, S. K., Canaves, J. M., Spraggon, G., Kreusch, A., Kuhn, P., Stevens, R. C. & Lesley, S. A. (2003). Shotgun crystallization strategy for structural genomics: an optimized two-tiered crystallization screen against the Thermotoga maritima proteome. Acta Cryst. D59, 1028–1037. [DOI] [PubMed]
- Parker, J. L. & Newstead, S. (2012). Current trends in α-helical membrane protein crystallization: an update. Protein Sci. 21, 1358–1365. [DOI] [PMC free article] [PubMed]
- Peat, T. S., Christopher, J. A. & Newman, J. (2005). Tapping the Protein Data Bank for crystallization information. Acta Cryst. D61, 1662–1669. [DOI] [PubMed]
- Seabrook, S. A. & Newman, J. (2013). High-throughput thermal scanning for protein stability: making a good technique more robust. ACS Comb. Sci. 15, 387–392. [DOI] [PubMed]
- Tagari, M., Tate, J., Swaminathan, G. J., Newman, R., Naim, A., Vranken, W., Kapopoulou, A., Hussain, A., Fillon, J., Henrick, K. & Velankar, S. (2006). E-MSD: improving data deposition and structure quality. Nucleic Acids Res. 34, D287–D290. [DOI] [PMC free article] [PubMed]
- Tung, M. & Gallagher, D. T. (2009). The Biomolecular Crystallization Database Version 4: expanded content and new features. Acta Cryst. D65, 18–23. [DOI] [PubMed]
- Waterman, M. S. & Vingron, M. (1994). Rapid and accurate estimates of statistical significance for sequence data base searches. Proc. Natl Acad. Sci. USA, 91, 4625–4628. [DOI] [PMC free article] [PubMed]
- Zerbe, K., Pylypenko, O., Vitali, F., Zhang, W., Rouset, S., Heck, M., Vrijbloed, J. W., Bischoff, D., Bister, B., Süssmuth, R. D., Pelzer, S., Wohlleben, W., Robinson, J. A. & Schlichting, I. (2002). Crystal structure of OxyB, a cytochrome P450 implicated in an oxidative phenol coupling reaction during vancomycin biosynthesis. J. Biol. Chem. 277, 47476–47485. [DOI] [PubMed]
Associated Data
This section collects any data citations, data availability statements, or supplementary materials included in this article.
Supplementary Materials
SupplementaryTable S1.. DOI: 10.1107/S2053230X1401841X/en5555sup1.pdf