The integral membrane lysine permease from P. aeruginosa was cloned and overexpressed in E. coli as a GFP-fusion protein. Crystals of the tag-less transporter diffracted to 7.5 Å resolution.
Keywords: APC transporter superfamily, GFP fusion, LysP, membrane protein
Abstract
The prokaryotic lysine-specific permease (LysP) belongs to the amino acid–polyamine–organocation (APC) transporter superfamily. In the cell, members of this family are responsible for the uptake and recycling of nutrients, for the maintenance of a constant internal ion concentration and for cell volume regulation. The detailed mechanism of substrate selectivity and transport of l-lysine by LysP is not understood. A high-resolution crystal structure would enormously facilitate such an understanding. To this end, LysP from Pseudomonas aeruginosa was recombinantly expressed in Escherichia coli and purified to near homogeneity by immobilized metal ion-affinity chromatography (IMAC) and size-exclusion chromatography (SEC). Hexagonal- and rod-shaped crystals were obtained in the presence of l-lysine and the l-lysine analogue l-4-thialysine by vapour diffusion and diffracted to 7.5 Å resolution. The diffraction data were indexed in space group P21, with unit-cell parameters a = 169.53, b = 169.53, c = 290.13 Å, γ = 120°.
1. Introduction
Living cells use active transporters to move an assortment of ligands and ions across semi-permeable membrane bilayers against their concentration gradients. The process can be driven by ATP hydrolysis (primary active transporters) or by an electrochemical gradient (secondary active transporters). Amino acid–polyamine–organocation (APC) transporters are secondary active transporters with representatives in all kingdoms of life. By transporting amino acids and their derivatives such as S-methylmethionine and S-adenosylmethionine in and out of cells or organelles, APC transporters play vital roles in supplying nutrients, exporting toxic substances and exchanging information and signalling molecules (Shaffer et al., 2009 ▶). The crystal structures of the sodium-independent amino-acid transporter (ApcT) from Methanocaldococcus jannaschii (Shaffer et al., 2009 ▶) and of the arginine/agmantine antiporter AdiC (Gao et al., 2009 ▶) and the glutamate/GABA antiporter (GadC) from Escherichia coli (Ma et al., 2012 ▶), together with decades of biochemical and biophysical studies of these transporters, have provided important insights regarding their selectivity and molecular mode of action. However, our appreciation of the structure–function relationship as applied to this diverse family of transporters is still limited. Additional high-resolution crystal structures of a wider range of APC transporters are needed to understand the mechanistic similarities and differences among APC transporters.
The prokaryotic lysine permease LysP is an APC transporter. In E. coli, this 53 kDa protein has been shown to be involved in the specific uptake of l-lysine, which can be used by the cell as a source of carbon and nitrogen (Weill-Thevnet et al., 1979 ▶). Under acidic stress conditions, in addition to lysine transport, LysP interacts with the transcriptional regulator CadC to upregulate cadBA operon expression. The latter encodes proteins that decarboxylate lysine to cadarverine and exports this alkaline product to the environment to reduce acidity (Rauschmeier et al., 2014 ▶). Sharing 70% identity with its E. coli counterpart, LysP from Pseudomonas aeruginosa has been shown to specifically transport l-lysine in liposomes using energy derived from a proton gradient (Nji et al., unpublished work). Based on homology modelling, a number of residues that impact on lysine transport by LysP from Salmonella typhimurium have been identified (Kaur et al., 2014 ▶). Isothermal titration calorimetry was used to establish that residues Lys163, Glu222 and Arg395 are important in this process. These residues are well conserved in the APC family, suggesting that LysP shares a similar transport mechanism to other APC members (Kaur et al., 2014 ▶). However, the detailed mechanism of substrate recognition, selectivity and transport have yet to be elucidated. In this work, we describe the cloning, recombinant expression, purification, crystallization and preliminary diffraction from crystals of LysP from the human pathogen P. aeruginosa. The results reported here are a first step towards the determination of a high-resolution crystal structure of this important permease.
2. Materials and methods
2.1. Cloning and GFP-based overexpression of LysP-GFP8His
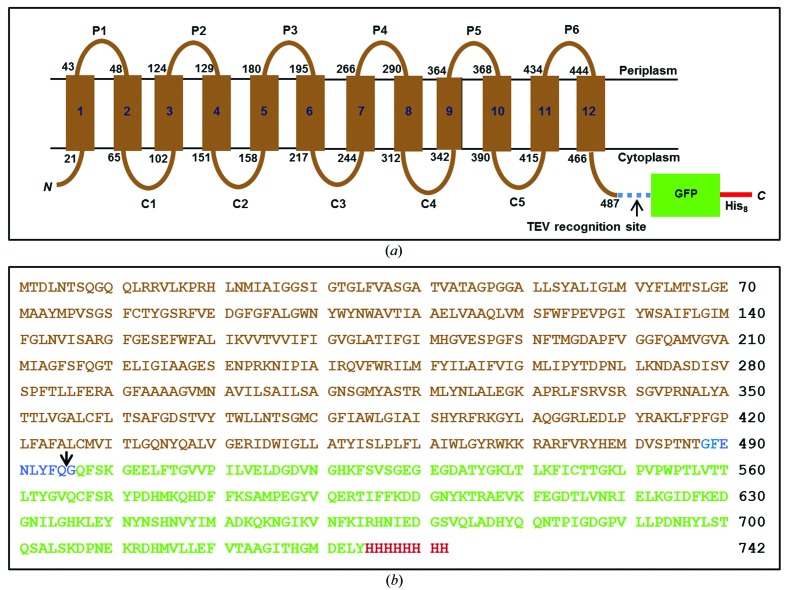
The lysP gene without a stop codon was amplified by PCR using the primer pair 5′-CACCCATATGACTGACCTGAACACCAGCCAG-3′ and 5′-GGATCCGGTATTGGTCGGGCTGACGTC-3′ with P. aeruginosa strain PAO1 cells as the template. The cells release genomic DNA during the PCR heat cycling. The PCR product was cloned into the pET151-TOPO vector (Invitrogen) following the manufacturer’s instructions. After verification by DNA sequencing (MWG Biotech), the lysP gene was cut using NdeI and BamHI and was inserted into the pWaldo-GFPd vector (Drew et al., 2006 ▶) treated with the same restriction enzymes. This resulted in a construct that encodes LysP fused to a TEV protease recognition site followed by enhanced GFP with eight consecutive His residues at the C-terminus (Fig. 1 ▶). The construct is referred to as LysP-GFP8His.
Figure 1.
Schematic representation of the LysP-GFP8His fusion construct. (a) The topology of LysP predicted by the TMHMM online server (http://www.cbs.dtu.dk/services/TMHMM-2.0/) shows 12 transmembrane helices (numbered rectangles). The start and end residue numbers for each transmembrane helix are shown at the membrane boundary (black lines). P1–P6 and C1–C5 designate the periplasmic and cytoplasmic loops, respectively. The C-terminal GFP8His fused to LysP via a linker that has a TEV protease recognition site (blue dashed line) is shown as a green box with the extension as a red line. The Cin topology ensures that the GFP resides in the reducing environment of the cytoplasm, which is necessary for proper folding of this β-barrel reporter. (b) The deduced amino-acid sequence of the LysP-GFP8His construct. Sequences corresponding to LysP, the TEV protease-containing linker, the GFP and the His tag are shown in brown, blue, green and red, respectively. The arrow marks the TEV protease cut site.
E. coli C43 (DE3) cells (Shaw & Miroux, 2003 ▶) carrying the recombinant plasmid were used to overexpress LysP-GFP8His. The cells were cultured in the presence of 50 µg ml−1 kanamycin. A single colony of freshly transformed cells was inoculated into 60 ml Luria–Bertani (LB) broth. After 16 h at 37°C with shaking at 200 rev min−1 (INFORS HT Multitron), the culture was seeded into 6 × 1 l LB and allowed to grow to an OD600 of 0.3 (typically after 2 h), at which point the temperature of the shaker was adjusted to 25°C. At an OD600 of 0.6 (typically after 3–4 h), the cells were induced with 0.4 mM IPTG (Melford) for 16 h at 25°C with shaking at 200 rev min−1 (OD600 of ∼5). Cells were harvested by centrifugation at 4000g for 10 min at 4°C. Pellets containing the biomass were either stored at −80°C or used directly as described below.
2.2. Isolation of membranes containing LysP-GFP8His
The following steps were carried out at 4°C unless otherwise noted. The cells from 6 l of culture were resuspended in 100 ml lysis buffer consisting of 1× PBS (137 mM NaCl, 2.7 mM KCl, 10 mM Na2HPO4, 2 mM KH2PO4 pH 7.4), 1 mM MgCl2, 1 mg ml−1 Pefabloc protease inhibitor (Sigma) and 100 U ml−1 DNase I (Sigma) and were broken by sonication for 5 min using a probe sonicator (Probe KE76, Model HD2200, Bandelin) at a power setting of 65% with a 1 min pause each minute. The unbroken cells and debris (∼10 ml in total) were removed by centrifugation at 15 000g for 10 min. The supernatant (80 ml) was centrifuged for 1 h at 120 000g (Beckman Optima L-100 XP ultracentrifuge, Beckman 45 Ti rotor) to pellet the membranes. The green pellets, resuspended by homogenizing in 30 ml ice-cold 1× PBS buffer, were rapidly frozen (30 ml aliquot in a 50 ml Falcon tube) in liquid nitrogen and stored at −80°C until use.
2.3. Purification of LysP
The following steps were carried out at 4°C unless otherwise noted. The frozen membrane suspension (30 ml) from §2.2 was thawed in a beaker under running cold tap water for 30 min. Membranes were added to 330 ml ice-cold solubilization buffer consisting of 1× PBS, 10%(v/v) glycerol, 150 mM NaCl, 1%(w/v) n-dodecyl-β-d-maltopyranoside (DDM) and solubilized by gentle stirring for 1 h. Unsolubilized material was removed by centrifuging the sample at 150 000g for 1 h. The resulting supernatant (360 ml) containing the solubilized LysP-GFP8His was incubated with 15 ml Ni2+–NTA resin (Qiagen) for 2 h. To minimize nonspecific binding, 10 mM imidazole was included during the incubation. The slurry (360 ml) was loaded into a glass Econo gravity column (Bio-Rad). The resin was washed with 20 column volumes (CV) of 10 mM imidazole in wash buffer [1× PBS, 10%(v/v) glycerol, 150 mM NaCl, 0.1%(w/v) DDM] followed by 30 CV of 20 and 35 mM imidazole in the wash buffer. The LysP-GFP8His fusion protein was eluted from the column with 40 ml elution buffer (0.25 M imidazole in wash buffer). To the fusion protein-containing fractions (determined by GFP fluorescence; ∼30 ml), His-tagged Tobacco etch virus (TEV) protease, purified in-house using a published protocol (Lucast et al., 2001 ▶), was added at a TEV:GFP molar ratio of 1:1. GFP was quantified using the natural fluorescence of the protein calibrated with solutions of known pure GFP concentration. For this purpose, 0.1 ml LysP-GFP8His solution was placed in a 96-well plate and its fluorescence emission at 512 nm was recorded with an excitation wavelength of 485 nm in a plate reader (SpectraMax M2e). With this arrangement, a conversion factor of 4000 fluorescence units per microgram of pure GFP was measured and used consistently throughout the study. The mixture containing TEV protease and LysP-GFP8His was dialysed (14 kDa molecular-weight cutoff, Sigma) against 3 l dialysis buffer consisting of 20 mM Tris–HCl pH 7.5, 150 mM NaCl, 0.03%(w/v) DDM for 16 h with gentle stirring to remove imidazole, which inhibits the TEV protease. After protease digestion, the 50 ml slightly cloudy sample was filtered using 0.22 µm Millipore filters to remove large protein aggregates. The clear filtrate was loaded onto a 5 ml Ni2+–NTA Fast Flow column (GE Healthcare) pre-equilibrated with buffer A [150 mM NaCl, 20 mM Tris–HCl pH 7.5, 0.03%(w/v) DDM] at a rate of 0.2 ml min−1. This is referred to as the reverse IMAC step because the free LysP cleaved from the LysP-GFP8His flows through the column, while the GFP8His His-tagged TEV protease and uncut LysP-GFP8His are retained. The flowthrough, amounting to ∼55 ml and containing GFP-free LysP (referred to as LysP in this paper), was collected and concentrated using a 50 kDa molecular-weight concentrator (YM-50, Millipore) by centrifugation at 3500g at 4°C. To avoid aggregation of locally concentrated protein at the bottom of the concentrator, the sample was mixed thoroughly by pipette after every 5 min spin. The concentrated sample (typically 2 ml at 1.5 mg ml−1) was loaded onto a HiLoad 16/60 Superdex 200 column (GE Healthcare) pre-equlibrated with 2 CV buffer A for size-exclusion chromatography (SEC) at a flow rate of 1.0 ml min−1 with buffer A as the mobile phase. The fractions containing LysP were concentrated as outlined above to 10 mg ml−1. The concentration of LysP was determined by using absorbance at 280 nm, a calculated molar extinction coefficient of 97 290 M −1 cm−1 (Pace et al., 1995 ▶) and a molecular weight of 54 kDa.
For SDS–PAGE analysis, the LysP solution was mixed with SDS loading buffer, applied onto 12%(w/v) SDS–PAGE gels (ThermoFisher Scientific) and run at 150 V for 1 h at room temperature. Samples were not heated before loading. Gels were stained with Coomassie Blue.
2.4. Mass spectrometry
The total molecular mass of purified LysP (§2.3) was determined by electrospray ionization-mass spectrometry (ESI-MS). 5 µl of LysP at 10 mg ml−1 in buffer A was added to 0.1%(w/v) trichloroacetic acid (TCA), 10%(v/v) ammonia in acetone in a 1.5 ml Eppendorf tube. The mixture was vortexed for 2 min and incubated on ice for 30 min. Precipitated LysP was collected by centrifugation for 3 min at 4000g at 22°C. The pellet was washed with 750 µl ice-cold acetone:hexane mixture [2:1(v:v)]. After centrifugation for 3 min at 4000g at room temperature, the supernatant was removed. The pellet was dried and sent to the Astbury Center for Structural Molecular Biology (University of Leeds, England) for ESI-MS analysis.
2.5. Crystallization of LysP
2.5.1. In surfo crystallization
Initial in surfo sitting-drop crystallization trials were set up in MRC 2-well crystallization plates (Hampton Research) using a Mosquito robot (TTP Labtech) at 20°C. For each well, 100 nl protein solution at 9.5 mg ml−1 and 100 nl precipitant solution were combined over a reservoir containing 70 µl precipitant solution. The plate was sealed with ClearSeal Film (Hampton Research) and incubated at 18°C. The MemGold kit (Molecular Dimensions) was used for screening. When ligands were used, either l-lysine or l-4-thialysine (Sigma) was added to the LysP protein solution to a final concentration of 5 mM (26:1 molar ratio of ligand:protein) and incubated for 30 min on ice prior to setting up the crystallization trials. No ligand was added to the precipitant solution.
Optimization trials were carried out in 24-well sitting-drop Cryschem plates (Hampton) by hand at 20°C. 1–2 µl protein solution at 10 mg ml−1 (with or without ligand) was mixed with 1–2 µl precipitant solution before being sealed in a well containing 0.5 ml reservoir solution. The plates were incubated at 20°C for crystal growth. Optimization screens were designed by varying the concentration of precipitants, salts and buffer around the initial hit conditions. Additive screening (Additive Screen, Hampton Research) was also performed using additives at 10% of the stock concentration.
2.5.2. In meso crystallization
The LysP protein was reconstituted into the lipid bilayer of the cubic phase following established protocols (Caffrey & Cherezov, 2009 ▶) using monoolein (9.9 MAG) (catalogue No. M239, Nu-Chek Prep), 7.8 MAG and 7.7 MAG (Caffrey et al., 2009 ▶) as host lipids. Protein at 10 mg ml−1 was incubated with 0.2 M ligand on ice for 30 min, followed by homogenization with the MAGs in a coupled syringe mixing device (Caffrey & Cherezov, 2009 ▶) at 20°C to form the cubic phase. The protein solution:lipid volume ratio used was 2:3 for monoolein and 1:1 for the other two MAGs (Caffrey et al., 2012 ▶). In meso crystallization trials were set up by dispensing 50 nl cubic phase onto a silanized 96-well glass plate, which was then covered with 800 nl ligand-free precipitant solution using a SIAS robot (Cherezov et al., 2004 ▶). After sealing, the glass sandwich plates were stored at 20°C in an automated imager (RI1500, Formulatrix). The wells were monitored on days 0, 1, 3, 5, 7, 14 and 30 post-setup under normal light and between cross-polarizers. The commercial screens PACT premier, MemSys, MemStart, MemGold (Molecular Dimensions), MembFac, SaltRX (Hampton Research) and Cubic Screen (Emerald Bio), diluted to 65–70% of their full strength with Milli-Q water (Li et al., 2013 ▶), were used as the precipitant solutions.
2.6. Crystal harvesting, X-ray diffraction data collection and processing
Crystals from the in surfo crystallization plates were harvested using micro-loops (MiTiGen) and cryocooled in liquid nitrogen without added cryoprotectants. Diffraction data were collected either on beamline I24 at Diamond Light Source (DLS), England using a PILATUS 6M detector with a sample-to-detector distance of 400–600 mm using 0.978 Å wavelength X-rays or on beamlines 23-ID-B and 23-ID-E at the Advanced Photon Source (APS), USA using a MAR CCD detector with a sample-to-detector distance of 450–600 mm using 0.9792 Å wavelength X-rays. For each frame, crystals were exposed to the full unattenuated beam for 1 s while being rotated by 1°. Data were processed using HKL-2000 (Otwinowski & Minor, 1997 ▶).
3. Results and discussion
3.1. Expression and purification of LysP
LysP is predicted to have 12 transmembrane helices, with the N- and C-terminus in the cytoplasm (Sonnhammer et al., 1998 ▶; Krogh et al., 2001 ▶; Fig. 1 ▶). To fuse a GFP reporter protein at the C-terminus, the Cin topology is important because it ensures that the GFP is in a reducing environment, which is necessary for its proper folding (Drew et al., 2006 ▶). In turn, the GFP tag can be used to qualitatively assess the expression level, folding and integrity of the membrane protein, as well as to guide the purification process, which includes detergent solubilization and fractionation.
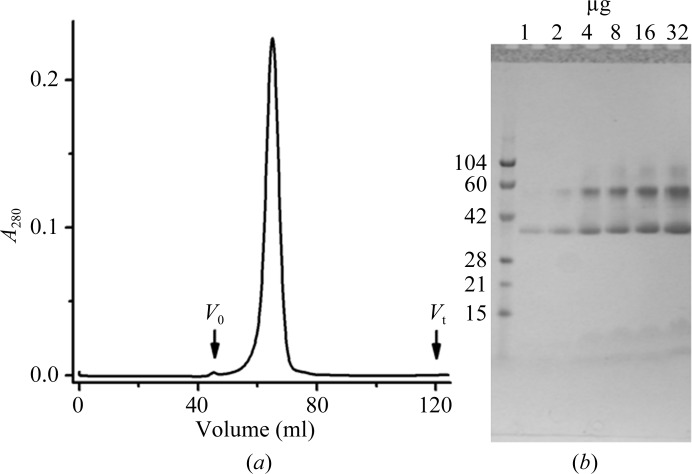
In this study, the GFP approach was implemented following an established protocol (Drew et al., 2006 ▶). Briefly, this involved initial purification of LysP-GFP8His by IMAC. The GFP was cleaved from the fusion protein by means of TEV protease, which recognizes a cleavage site between the LysP and the GFP (§2.3, Fig. 1 ▶). LysP, now free of the His tag, was separated from uncut LysP-GFP8His, His-tagged TEV protease and free GFPHis via reverse IMAC, which selectively binds unwanted proteins while the free LysP passes through the column. The purified LysP showed a symmetric Gaussian peak on size-exclusion chromatography (Fig. 2 ▶ a), consistent with it being monodisperse. The elution volume (V e) of 64.5 ml corresponded to an apparent molecular weight of 167 kDa for the LysP–DDM complex based on a separate V e–apparent molecular weight calibration profile established for the column. Membrane proteins typically bind detergents to the extent of between 70 and 330 moles of detergent per mole of protein (Møller & le Maire, 1993 ▶). In a simulation study with a closely related transporter LeuT, one molecule of protein was shown to bind up to 226 molecules of DDM (Khelashvili et al., 2013 ▶), corresponding to a molecular weight of 115 kDa. With a protein molecular weight of 54 kDa, the observed elution behaviour therefore suggests that LysP exists in micellar solution as a monomer. This is consistent with a separate report concerning the oligomeric state of LysP from S. typhimurium (Kaur et al., 2014 ▶).
Figure 2.
Purification of LysP. (a) Gel-filtration chromatogram of LysP. V 0 and V t mark the void and total column volumes, respectively. The elution volume (V e) of LysP is at 64.5 ml. The near-Gaussian-shaped elution profile is consistent with a monodisperse protein preparation suitable for crystallization trials. (b) The protein purity post-gel filtration was estimated at >92% on the basis of a protein loading series analyzed by SDS–PAGE with Coomassie Blue staining. Three bands observed in the lanes loaded with higher protein concentrations are proposed to include the fast migrating monomers (37 kDa), dimers (56 kDa) and trimers (88 kDa) of LysP. Molecular-weight standards are in the left lane (labelled in kDa). The amount of LysP loaded in each lane is indicated at the top. Samples were not heated prior to SDS–PAGE analysis.
The concentrated SEC-purified LysP was analysed on 12%(w/v) SDS–PAGE (Fig. 2 ▶ b). Three major bands at 37, 56 and 88 kDa were revealed. To determine whether all three bands were from LysP, the protein sample was subjected to ESI-MS (§2.5). The result revealed only one major peak with a molecular weight of 54 044.19 ± 5.65 Da. This is consistent with a theoretical molecular weight of 54 037.2 Da for LysP. Therefore, the three bands are likely to represent different oligomerization states of LysP. The 37 kDa band is probably the fast-moving monomer. Such behaviour is not uncommon for membrane proteins (Rath et al., 2009 ▶). The 56 and 88 kDa bands may correspond to SDS-induced dimers and trimers, respectively. Interestingly, the SEC profile is consistent with a uniform population of monomers, while the SDS–PAGE data showed heterogeneity in oligomerization states. We speculate that the oligomers observed by SDS–PAGE arise owing to the denaturing detergent SDS and/or to the modest heat generated during electrophoresis. The SEC results were obtained with LysP dispersed in mild detergent and should better reflect the native state of the protein. Based on the loading series shown in Fig. 2 ▶(b), the protein purity was estimated to be >92% (Fig. 2 ▶ b). The protein was therefore considered of sufficient quality to enter crystallization trials.
3.2. Crystallization of LysP
Despite extensive in meso screening that covered over 2000 conditions, including seven 96-condition screen kits and three types of monoacylglycerols as hosting lipids, recognizable crystals were not obtained.
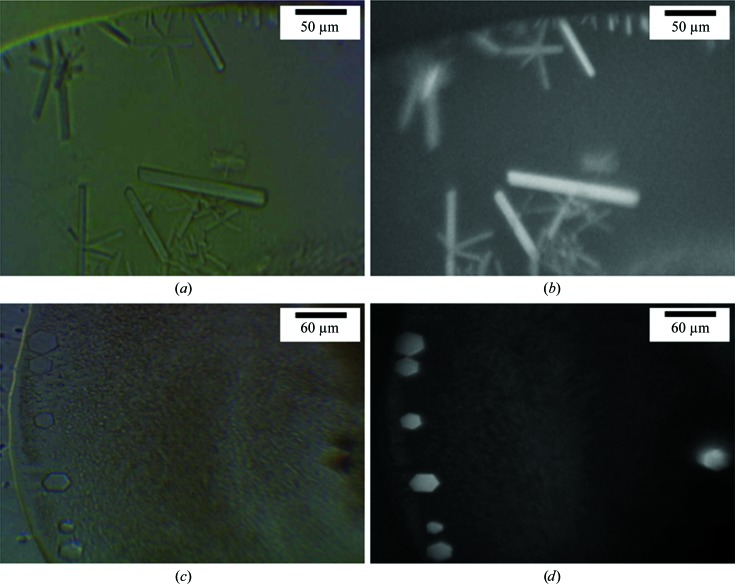
For in surfo crystallization, heavy precipitation was observed in the absence of ligand. Initial hits were obtained (Fig. 3 ▶) when l-lysine or l-4-thialysine was present. The in surfo crystals appeared in 1 d and grew to full size (5 × 10 × 100 µm rods or 5 × 30 × 40 µm hexagons) in two weeks. When illuminated at 280 nm under a UV microscope (Korima), the crystals were clearly visible as a result of intrinsic tryptophan fluorescence (Figs. 3 ▶ b and 3 ▶ d). LysP has 12 tryptophan residues. This, together with the fact that crystals only appeared in the presence of ligands, suggested that the crystals were formed of protein. Optimization was carried out by varying the PEG and salt concentrations, drop size and the protein:precipitant volume ratio in the drop and by using organic and detergent additives. Larger crystals of dimensions 10 × 50 × 200 µm were generally obtained with higher PEG concentrations than in the original hits (Figs. 3 ▶ and 4 ▶).
Figure 3.
Initial in surfo crystallization hits with LysP. In (a) and (b) the precipitant solution consisted of 50 mM magnesium acetate, 26%(v/v) PEG 350 MME, 0.1 M MES pH 5.4 in the presence of 5 mM l-lysine. The crystals in (c) and (d) were grown using precipitant consisting of 0.1 M MgCl2, 0.1 M NaCl, 33%(v/v) PEG 400, 0.1 M Tris–HCl pH 8.5 in the presence of 5 mM l-lysine. Images were recorded under visible light (a, c) and UV light (b, d) using a Korima UV microscrope.
Figure 4.
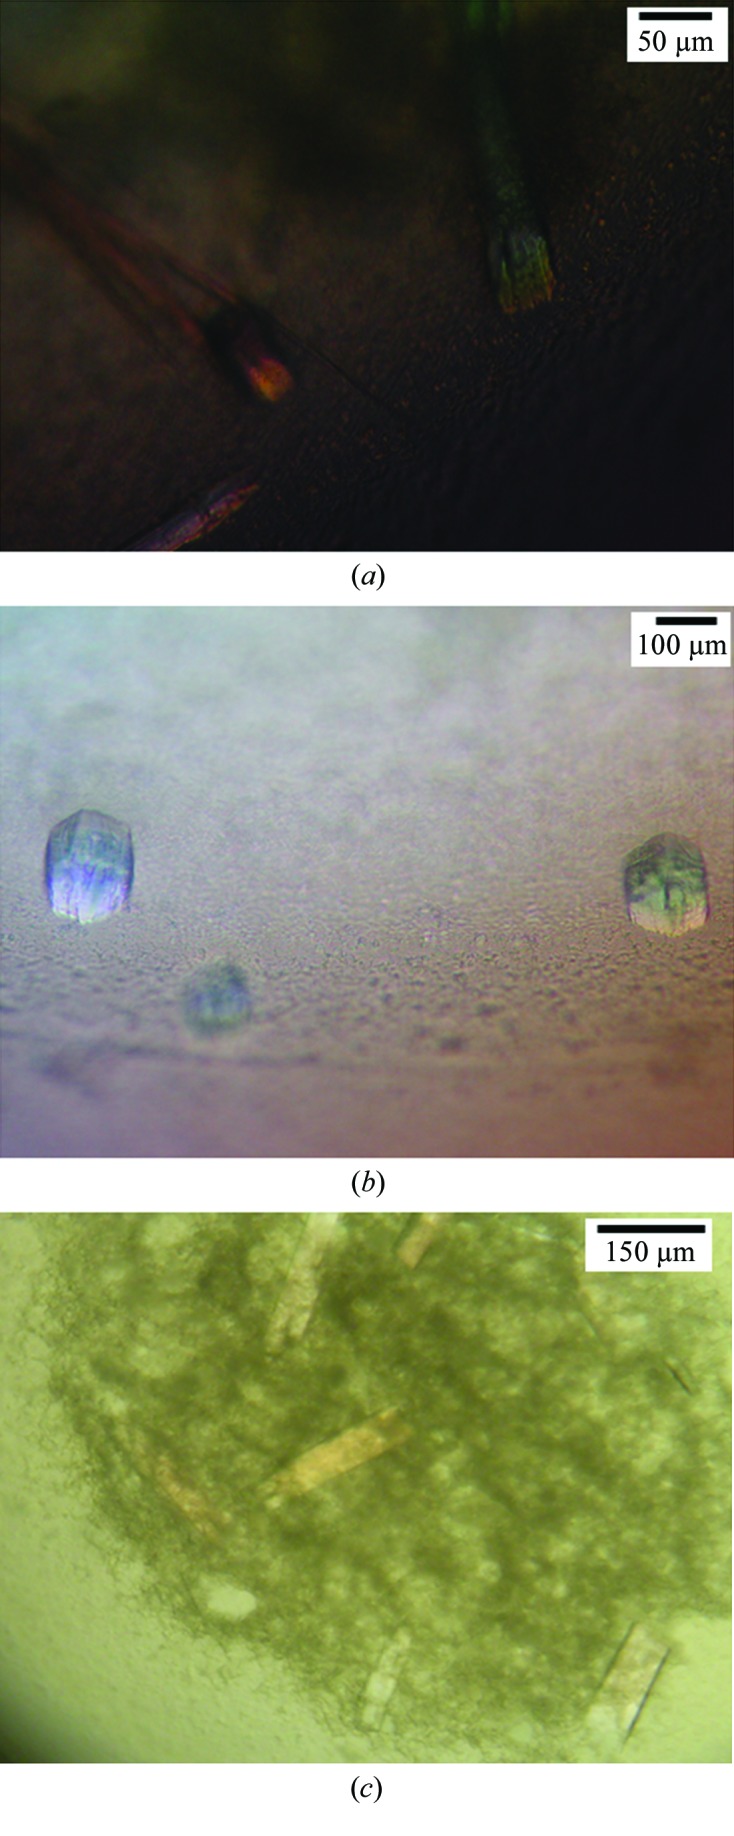
Optimizing the in surfo crystallization of LysP. (a) Long rod-shaped crystals were grown in a precipitant consisting of 0.1 M MgCl2, 0.1 M NaCl, 39%(v/v) PEG 400, 0.1 M Tris–HCl pH 8.5 in the presence of 5 mM l-lysine. (b) Blocky crystals were obtained with a precipitant consisting of 0.1 M MgCl2, 0.1 M NaCl, 38%(v/v) PEG 400, 0.1 M Tris–HCl pH 8.5 in the presence of 5 mM l-lysine. (c) Plate-shaped crystals were grown in a precipitant consisting of 0.1 M MgCl2, 0.1 M NaCl, 38%(v/v) PEG 400, 0.1 M Tris–HCl pH 8.5, 4%(v/v) 1,3-propanediol (Additive Screen) in the presence of 5 mM l-4-thialysine. Crystals took six weeks to grow to maximum size at 20°C.
3.3. X-ray diffraction studies
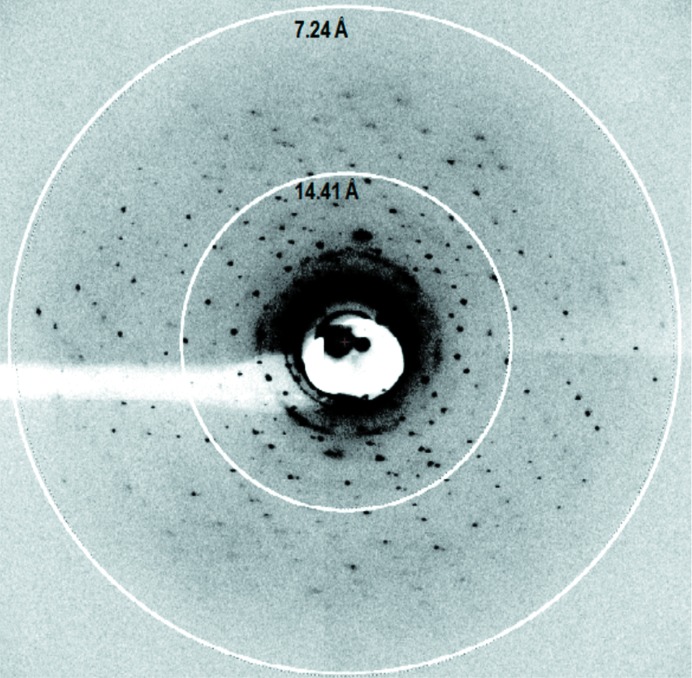
Several crystals from different crystallization conditions were tested for diffraction. The best crystals, which were grown in 0.1 M MgCl2, 0.1 M NaCl, 38%(v/v) PEG 400, 0.1 M Tris–HCl pH 8.5 in the presence of 5 mM l-lysine, diffracted to 7.5 Å resolution (Fig. 5 ▶, Table 1 ▶). The data were indexed in space group P6322, with unit-cell parameters a = 169.53, b = 169.53, c = 290.13 Å, γ = 120° (Table 1 ▶). Further optimization, including searching for more stable homologues and mutants, in combination with shorter chained detergents, such as lauryldimethylamine-N-oxide and β-octylglucoside (Sonoda et al., 2011 ▶), are in progress with a view to high-resolution structure determination of this important transporter.
Figure 5.
X-ray diffraction from a LysP crystal grown in surfo at 20°C. The diffraction pattern shown was recorded on a PILATUS 6M detector with 0.978 Å wavelength X-rays at 1° oscillation and 1 s exposure, a micro-focus beam size of 10 µm and a sample-to-detector distance of 450 mm.
Table 1. Data collection statistics for LysP.
Values in parentheses are for the highest resolution shell.
| Beamline | 23-ID-E, APS |
| Resolution () | 146.817.5 (7.77.5) |
| Wavelength () | 0.97916 |
| Temperature (K) | 100 |
| Space group | P6322 |
| Unit-cell parameters (, ) | a = b = 169.53, c = 290.13, = = 90, = 120 |
| R merge | 0.224 (2.178) |
| R p.i.m. | 0.058 (0.51) |
| I/(I) | 7.3 (1.6) |
| Completeness (%) | 100 (100) |
| Multiplicity | 17.8 (18.9) |
Acknowledgments
This work was supported by grants from the Science Foundation Ireland (12/IA/1255) and the National Institutes of Health (GM75915, P50GM073210 and U54GM094599). Special thanks go to D. Drew, Stockholm University for the pWaldo GFPd and TEV protease expression vectors, to F. O’Gara, University College Cork for the P. aeruginosa PAO1 cells and to D. Aragao, V. Pye and A. Khan for help at the synchrotron.
References
- Caffrey, M. & Cherezov, V. (2009). Nature Protoc. 4, 706–731. [DOI] [PMC free article] [PubMed]
- Caffrey, M., Li, D. & Dukkipati, A. (2012). Biochemistry, 51, 6266–6288. [DOI] [PMC free article] [PubMed]
- Caffrey, M., Lyons, J., Smyth, T. & Hart, D. J. (2009). Curr. Top. Membr. 63, 83–108.
- Cherezov, V., Peddi, A., Muthusubramaniam, L., Zheng, Y. F. & Caffrey, M. (2004). Acta Cryst. D60, 1795–1807. [DOI] [PubMed]
- Drew, D., Lerch, M., Kunji, E., Slotboom, D. J. & de Gier, J. W. (2006). Nature Methods, 3, 303–313. [DOI] [PubMed]
- Gao, X., Lu, F., Zhou, L., Dang, S., Sun, L., Li, X., Wang, J. & Shi, Y. (2009). Science, 324, 1565–1568. [DOI] [PubMed]
- Kaur, J., Olkhova, E., Malviya, V. N., Grell, E. & Michel, H. (2014). J. Biol. Chem. 289, 1377–1387. [DOI] [PMC free article] [PubMed]
- Khelashvili, G., LeVine, M. V., Shi, L., Quick, M., Javitch, J. A. & Weinstein, H. (2013). J. Am. Chem. Soc. 135, 14266–14275. [DOI] [PMC free article] [PubMed]
- Krogh, A., Larsson, B., von Heijne, G. & Sonnhammer, E. L. (2001). J. Mol. Biol. 305, 567–580. [DOI] [PubMed]
- Li, D., Shah, S. T. A. & Caffrey, M. (2013). Cryst. Growth Des. 13, 2846–2857. [DOI] [PMC free article] [PubMed]
- Lucast, L. J., Batey, R. T. & Doudna, J. A. (2001). Biotechniques, 30, 544–554. [DOI] [PubMed]
- Ma, D., Lu, P., Yan, C., Fan, C., Yin, P., Wang, J. & Shi, Y. (2012). Nature (London), 483, 632–636. [DOI] [PubMed]
- Møller, J. V. & le Maire, M. (1993). J. Biol. Chem. 268, 18659–18672. [PubMed]
- Otwinowski, Z. & Minor, W. (1997). Methods Enzymol. 267, 307–326. [DOI] [PubMed]
- Pace, C. N., Vajdos, F., Fee, L., Grimsley, G. & Gray, T. (1995). Protein Sci. 4, 2411–2423. [DOI] [PMC free article] [PubMed]
- Rath, A., Glibowicka, M., Nadeau, V. G., Chen, G. & Deber, C. M. (2009). Proc. Natl Acad. Sci. USA, 106, 1760–1765. [DOI] [PMC free article] [PubMed]
- Rauschmeier, M., Schüppel, V., Tetsch, L. & Jung, K. (2014). J. Mol. Biol. 426, 215–229. [DOI] [PubMed]
- Shaffer, P. L., Goehring, A., Shankaranarayanan, A. & Gouaux, E. (2009). Science, 325, 1010–1014. [DOI] [PMC free article] [PubMed]
- Shaw, A. Z. & Miroux, B. (2003). Methods Mol. Biol. 228, 23–35. [DOI] [PubMed]
- Sonnhammer, E. L., von Heijne, G. & Krogh, A. (1998). Proc. Int. Conf. Intell. Syst. Mol. Biol. 6, 175–182. [PubMed]
- Sonoda, Y., Newstead, S., Hu, N.-J., Alguel, Y., Nji, E., Beis, K., Yashiro, S., Lee, C., Leung, J., Cameron, A. D., Byrne, B., Iwata, S. & Drew, D. (2011). Structure, 19, 17–25. [DOI] [PMC free article] [PubMed]
- Weill-Thevnet, N. J., Hermann, M. & Vandecasteele, J.-P. (1979). J. Gen. Microbiol. 111, 263–269.


