

Abstract
Aims/Introduction
A low level of high‐density lipoprotein cholesterol (HDLC) is a common feature of metabolic syndrome. We have reported that Japanese–Americans who share a virtually identical genetic makeup with native Japanese, but who have lived Westernized lifestyles for decades, have lower HDLC levels and a high prevalence of type 2 diabetes compared with native Japanese. However, the impact of low HDLC level on type 2 diabetes is unclear. The aims of the present study were to evaluate whether serum HDLC level was associated with development of type 2 diabetes and if the effect might be modified by lifestyle.
Materials and Methods
We examined 1,133 non‐diabetic Japanese–Americans and 1,072 non‐diabetic Japanese, who underwent the 75‐g oral glucose tolerance test (OGTT) and were followed for an average of 8.8 and 7.0 years, respectively. We analyzed whether serum HDLC level is a risk factor for development of type 2 diabetes based on the Cox proportional hazards model.
Results
After adjustment for age and sex, hazard ratios for development of type 2 diabetes per unit of serum HDLC level (mmol/L) were 0.292 (95% confidence interval [CI] 0.186–0.458, P < 0.0001) among Japanese–Americans and 0.551 (95% CI 0.375–0.88, P = 0.0023) among native Japanese. Comparable hazard ratios after further adjustment for category of OGTT and body mass index were 0.981 (95% CI 0.970–0.993, P = 0.0018) and 0.991 (95% CI 0.980–1.002, P = 0.112), respectively.
Conclusions
HDLC level was associated with development of type 2 diabetes in both Japanese–Americans and native Japanese. However, these results suggest that the impact of high‐density lipoprotein on glucose metabolism might be affected by lifestyle.
Keywords: High‐density lipoprotein cholesterol, Type 2 diabetes, Westernized lifestyle
Introduction
Epidemiological studies have shown that low levels of high‐density lipoprotein (HDL) cholesterol (HDLC) are associated with cardiovascular disease risk1. A recent report showed that HDL protects against cardiovascular disease in both males and females, independent of age, smoking status, systolic blood pressure and total cholesterol3. In addition, considering the global epidemics of type 2 diabetes and metabolic syndrome, the impact of low HDLC level as a risk factor for cardiovascular disease is likely to increase rapidly in the future4.
HDL exerts anti‐atherogenic actions through its intrinsic anti‐oxidative and anti‐inflammatory properties6. In addition, increased reactive oxygen species levels are thought to be an important trigger of insulin resistance7, a common feature of type 2 diabetes. Accordingly, low HDL level might be associated with impaired glucose tolerance (IGT) and development of type 2 diabetes.
Japanese–Americans who share a virtually identical genetic makeup with native Japanese currently living in Japan have lived Westernized lifestyles for decades8. We have reported that the prevalence of metabolic syndrome among Japanese–Americans is significantly higher, and serum HDLC levels are significantly lower, than among native Japanese10. In addition, we have reported that the prevalences of type 2 diabetes and cardiovascular disease among Japanese–Americans are significantly higher than among native Japanese8. The purpose of the present study was to investigate the impact of serum HDLC level on the development of type 2 diabetes, and to investigate whether its effect was modified by Westernized lifestyle based on a comparison between Japanese–Americans living in Hawaii and Los Angeles, and Japanese living in Japan.
Materials and Methods
Study Participants and Methods
The Hawaii–Los Angeles–Hiroshima study, initiated in 1970, is part of a long‐term epidemiological study of risk factors for diabetes and cardiovascular disease in which subjects living in Hawaii and Los Angeles, California, were limited to a population genetically identical to the Japanese population. This epidemiological study was previously described in detail elsewhere10. The Hiroshima Atomic Bomb Casualty Council, Health Management and Promotion Center provides health management services to approximately 110,000 atomic bomb survivors living primarily in Hiroshima, Japan14.
Study participants were Japanese–Americans consisting of 487 men and 646 women who were enrolled in medical surveys carried out from 1988 to 2010, and native Japanese consisting of 438 men and 634 women, matched on age and sex to the Japanese–Americans, who were enrolled in medical surveys carried out from 1963 to 2012. Participants were free from diabetes at start of follow up, as ascertained by the 75‐g oral glucose tolerance test (OGTT), and were examined at least twice during the study periods.
Participants underwent physical examinations and provided blood samples after an overnight fast. The Japanese–American participants underwent the OGTT during each follow‐up examination. The Japanese participants underwent the OGTT a few days later if their plasma glucose was ≥5.55 mmol/L at fasting, ≥7.21 mmol/L within 1.5 h after eating, ≥6.66 mmol/L between 1.5 and 2.5 h after eating, or ≥6.10 mmol/L beyond 2.5 h after eating, and if they showed glycosuria in the course of a screening health examination at the Hiroshima Atomic Bomb Casualty Council, Health Management and Promotion Center14. All incident diabetes cases were diagnosed on the basis of the OGTT according to the 1997 American Diabetes Association criteria (fasting glucose ≥7.0 mmol/L or 2‐h glucose ≥11.1 mmol/L after an OGTT)15.
Participants were free of infectious symptoms, autoimmune diseases and other acute conditions, as assessed by medical interview. Written informed consent was obtained. The study was approved by the ethics committees of Hiroshima University, the Council of Hiroshima Kenjin‐Kai Association in Hawaii and Los Angeles, and the Hiroshima Atomic Bomb Casualty Council, Health Management and Promotion Center.
Statistical Analysis
Data are described as mean ± standard deviation. Because the triglyceride and body mass index (BMI) variables did not conform to normal distributions, they were analyzed after logarithmic transformation. Continuous variables were compared by analysis of covariance. Differences in frequency between the Japanese–Americans and native Japanese were tested by the χ2‐test. To test the significance of HDLC level as a predictor of incidence of type 2 diabetes, HDLC concentration was divided into quartiles based on population values (<1.11, 1.11–1.37, 1.38–1.60 and >1.60 mmol/L in Japanese–Americans; and <1.34, 1.34–1.60, 1.61–1.89, and >1.89 mmol/L in native Japanese); quartile‐specific hazard ratios were estimated with the Cox proportional hazards model. With respect to potential confounders, adjustment was made for continuous age and BMI, as well as categorical sex and OGTT (normal glucose tolerance [NGT] and IGT). Hazard ratios were estimated after adjustment by two sets of potential confounders: the first set comprised age and sex only, and the second set comprised age, sex, category of OGTT, and BMI. The proportional hazards assumption was verified by inspection of log–log survival curves, and by examination of Schoenfeld partial residuals16. The SAS software package version 8.2 (SAS Institute, Cary, NC, USA) was used for analyses.
Results
Japanese–American participants were followed for an average of 8.75 ± 5.27 years, and the mean age at the time of follow‐up initiation was 61.3 ± 10.8 years. Native Japanese participants were followed for an average of 7.00 ± 4.39 years, with the mean age at the time of follow‐up initiation being 61.9 ± 7.1 years. Baseline clinical characteristics of the participants are shown in Table 1. A total of 181 and 175 participants developed diabetes during the follow‐up period among Japanese–Americans and native Japanese, respectively. The proportion of IGT participants among the native Japanese was greater than among Japanese–Americans (P < 0.0001). The Japanese–Americans had significantly higher systolic blood pressure (SBP; P < 0.0001), BMI (P = 0.013), triglycerides (P < 0.0001) and non‐HDL cholesterol (P < 0.0001) compared with the native Japanese. The Japanese–Americans had significantly lower fasting glucose (P < 0.0001), 2‐h glucose (P < 0.0001) and HDLC level (P < 0.0001) compared with the native Japanese.
Table 1. Clinical characteristics at baseline among Japanese–American and native Japanese study participants.
| Japanese–Americans | Native Japanese | P | |
|---|---|---|---|
| n (Men/women) | 1133 (487/646) | 1072 (438/634) | 0.312 |
| NGT/IGT (n) | 894/239 | 654/418 | <0.0001 |
| Developed type 2 diabetes (n) | 181 | 175 | |
| Age (years) | 61.3 ± 10.8 | 61.9 ± 7.1 | 0.782 |
| SBP (mmHg) | 136 ± 20 | 131 ± 18 | <0.0001 |
| DBP (mmHg) | 77 ± 11 | 77 ± 10 | 0.399 |
| BMI (kg/m2) | 23.5 ± 3.6 | 23.0 ± 3.0 | 0.013 |
| Fasting glucose (mmol/L) | 4.94 ± 0.55 | 5.44 ± 0.55 | <0.0001 |
| 2‐h glucose (mmol/L) | 6.22 ± 1.78 | 6.99 ± 1.66 | <0.0001 |
| Total cholesterol (mmol/L) | 5.79 ± 0.96 | 5.74 ± 0.93 | 0.091 |
| Triglycerides (mmol/L) | 1.74 ± 1.40 | 1.37 ± 0.86 | <0.0001 |
| HDL cholesterol (mmol/L) | 1.39 ± 0.38 | 1.63 ± 0.43 | <0.0001 |
| Non‐HDL cholesterol (mmol/L) | 4.39 ± 0.99 | 4.11 ± 0.95 | <0.0001 |
Data are expressed as mean ± standard deviation. BMI, body mass index; DBP, diastolic blood pressure; HDL, high‐density lipoprotein; IGT, impaired glucose tolerance; NGT, normal glucose tolerance; SBP, systolic blood pressure.
Clinical characteristics of participants at baseline, divided by quartiles of HDLC after adjustment for age, sex and category of OGTT, are shown in Tables 2 and 3. Among Japanese–Americans, the participants in the third and fourth quartiles were significantly older, and had lower 2‐h glucose compared with participants in the first quartile (P < 0.05). Participants in the second, third and fourth quartiles had significantly lower BMI, lower fasting glucose, lower triglycerides, and lower non‐HDL cholesterol compared with participants in the first quartile (P < 0.05). Participants in the fourth quartile had significantly higher total cholesterol compared with participants in the first quartile (P < 0.05; Table 2). Among the native Japanese, participants in the second and fourth quartiles had significantly lower DBP compared with participants in the first quartile (P < 0.05). Participants in the third and fourth quartiles had significantly lower BMI, lower fasting glucose, lower 2‐h glucose and lower non‐HDL cholesterol compared with participants in the first quartile (P < 0.05). Participants in the second, third, and fourth quartiles had significantly higher total cholesterol and lower triglycerides compared with participants in the first quartile (P < 0.05; Table 3).
Table 2. Clinical characteristics at baseline among Japanese–American participants.
| HDLC | ||||
|---|---|---|---|---|
| First quartile (<1.11) | Second quartile (1.11–1.37) | Third quartile (1.38–1.60) | Fourth quartile (>1.60) | |
| n (NGT/IGT) | 306 (184/122) | 293 (127/166) | 252 (97/155) | 282 (79/203) |
| Developed type 2 diabetes (n) | 77 | 45 | 31 | 28 |
| Age (years) | 59.5 ± 12.1 | 61.5 ± 10.2 | 62.5 ± 10.8* | 62.0 ± 10.9* |
| SBP (mmHg) | 137 ± 20 | 137 ± 20 | 135 ± 20 | 133 ± 21 |
| DBP (mmHg) | 79 ± 11 | 78 ± 11 | 76 ± 12 | 75 ± 12 |
| BMI (kg/m2) | 25.0 ± 3.0 | 23.7 ± 3.1* | 23.2 ± 3.4* | 21.9 ± 3.5* |
| Fasting glucose (mmol/L) | 5.05 ± 0.55 | 4.94 ± 0.50* | 4.88 ± 0.50* | 4.83 ± 0.55* |
| 2‐h glucose (mmol/L) | 6.55 ± 1.83 | 6.33 ± 1.78 | 5.99 ± 1.83* | 5.94 ± 1.61* |
| Total cholesterol (mmol/L) | 5.66 ± 1.01 | 5.79 ± 0.96 | 5.77 ± 0.96 | 5.92 ± 0.88* |
| Triglycerides (mmol/L) | 2.68 ± 2.13 | 1.66 ± 0.80* | 1.40 ± 0.75* | 1.11 ± 0.51* |
| Non‐HDL cholesterol (mmol/L) | 4.68 ± 1.01 | 4.53 ± 0.95* | 4.26 ± 0.96* | 4.04 ± 0.89* |
Data are expressed as mean ± standard deviation. *P < 0.05 compared with the first quartile, adjusted for age, sex and category of oral glucose tolerance test. BMI, body mass index; DBP, diastolic blood pressure; HDL, high‐density lipoprotein; HDLC, high‐density lipoprotein cholesterol; IGT, impaired glucose tolerance; NGT, normal glucose tolerance; SBP, systolic blood pressure.
Table 3. Clinical characteristics at baseline among native Japanese participants.
| HDLC | ||||
|---|---|---|---|---|
| First quartile (<1.34) | Second quartile (1.34–1.60) | Third quartile (1.61–1.89) | Fourth quartile (>1.89) | |
| n (NGT/IGT) | 310 (170/140) | 257 (105/152) | 249 (88/161) | 256 (75/181) |
| Developed type 2 diabetes (n) | 69 | 35 | 38 | 33 |
| Age (years) | 62.3 ± 7.6 | 61.6 ± 7.1 | 61.9 ± 6.6 | 61.5 ± 6.9 |
| SBP (mmHg) | 132 ± 18 | 131 ± 17 | 132 ± 18 | 129 ± 19 |
| DBP (mmHg) | 79 ± 10 | 76 ± 10* | 77 ± 10 | 76 ± 11* |
| BMI (kg/m2) | 24.0 ± 2.8 | 23.5 ± 2.9 | 22.5 ± 2.8* | 21.8 ± 2.9* |
| Fasting glucose (mmol/L) | 5.49 ± 0.50 | 5.49 ± 0.50 | 5.38 ± 0.52* | 5.33 ± 0.55* |
| 2‐h glucose (mmol/L) | 7.33 ± 1.61 | 7.16 ± 1.66 | 6.94 ± 1.78* | 6.60 ± 1.66* |
| Total cholesterol (mmol/L) | 5.48 ± 0.93 | 5.77 ± 0.93* | 5.77 ± 0.96* | 5.97 ± 0.83* |
| Triglycerides (mmol/L) | 1.77 ± 0.89 | 1.43 ± 1.03* | 1.21 ± 0.73* | 0.99 ± 0.43* |
| Non‐HDL cholesterol (mmol/L) | 4.34 ± 0.92 | 4.29 ± 0.94 | 4.02 ± 0.97* | 3.75 ± 0.84* |
Data are expressed as mean ± standard deviation. *P < 0.05 compared with the first quartile, adjusted for age, sex and category of oral glucose tolerance test. BMI, body mass index; DBP, diastolic blood pressure; HDL, high‐density lipoprotein; HDLC, high‐density lipoprotein cholesterol; IGT, impaired glucose tolerance; NGT, normal glucose tolerance; SBP, systolic blood pressure.
Hazard ratios per unit of serum HDLC level (mmol/L) after adjustment for age and sex were 0.292 (95% confidence interval [CI] 0.186–0.458, P < 0.0001) among Japanese–Americans, and 0.551 (95% CI 0.375–0.88, P = 0.0023) among native Japanese. Corresponding hazard ratios after adjustment for age, sex, category of OGTT, and BMI were 0.981 (95% CI 0.970–0.993, P = 0.0018) and 0.991 (95% CI 0.980–1.002, P = 0.112), respectively. In the Cox proportional hazards model including quartiles of HDLC level, hazard ratios for development of diabetes adjusted for age and sex by increasing quartile of HDLC level were 1.0, 0.587 (95% CI 0.404–0.851), 0.468 (95% CI 0.307–0.714), and 0.358 (95% CI 0.229–0.558) among Japanese–Americans, respectively (P < 0.0001 for trend), and after adjustment for age, sex, category of OGTT, and BMI hazard ratios were 1.0, 0.821 (95% CI 0.560–1.204), 0.722 (95% CI 0.468–1.115), and 0.565 (95% CI 0.355–0.898), respectively (P = 0.012 for trend) (Figure 1a). Hazard ratios for development of diabetes adjusted for age and sex by increasing quartile of HDLC level were 1.0, 0.558 (95% CI 0.371–0.840), 0.620 (95% CI 0.415–0.926), and 0.533 (95% CI 0.350–0.814) among native Japanese, respectively (P = 0.0038 for trend), and after adjustment for age, sex, category of OGTT, and BMI hazard ratios were 1.0, 0.601 (95% CI 0.401–0.904), 0.799 (95% CI 0.531–1.204), and 0.818 (95% CI 0.527–1.271), respectively (P = 0.936 for trend; Figure 1b).
Figure 1.
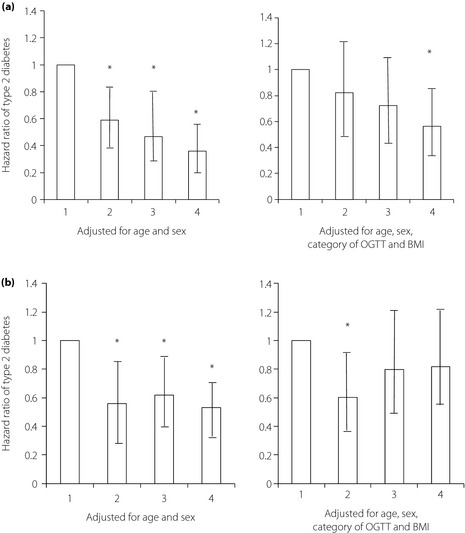
(a) Adjusted hazard ratios of type 2 diabetes among Japanese–Americans according to baseline serum HDLC concentrations from a Cox proportional hazards model. Bars represent 95% confidence intervals. Statistical significance of trend analysis: P < 0.0001 adjusted for age and sex (left side), P = 0.012 adjusted for age, sex, category of oral glucose tolerance test (OGTT; right side) and body mass index (BMI; right side). (b) Corresponding hazard ratios among native Japanese participants. Bars represent 95% confidence intervals. Statistical significance of trend analysis: P = 0.038 adjusted for age and sex (left side), P = 0.936 adjusted for age, sex, category of OGTT and BMI (right side). *P < 0.05 compared with the first quartile.
Discussion
The main finding of the present study is that a relationship exists between serum HDLC level and the development of type 2 diabetes both in Japanese–Americans and native Japanese. In addition, low serum HDLC level is strongly indicative of development of diabetes in Japanese–Americans compared with native Japanese. This result suggests that low HDLC level should be recognized as a risk factor for diabetes, especially among highly Westernized subjects.
In the present study, we assumed that serum HDLC level serves as an indicator of HDL. In other words, a high HDLC level indicates a high level of HDL anti‐atherosclerosis and antidiabetes properties, such as anti‐inflammatory and anti‐oxidative effects of paraoxonase and apolipoprotein A‐I (apoA‐I) activity17. Accordingly, low HDL level was associated with development of type 2 diabetes after simple adjustment for age and sex in both Japanese–Americans and native Japanese. In addition, recent studies have shown that HDL level could be linked to the pathogenesis of type 2 diabetes because of the capacity of HDL to enhance pancreatic β‐cell function and glucose uptake by skeletal muscle through adenosine monophosphate‐activated protein kinase18. HDL also protects against stress‐induced β‐cell apoptosis and islet inflammation20. Consequently, individuals with low HDLC level might have insufficient insulin secretion and inadequate glucose uptake in skeletal muscle. In contrast, higher HDLC level, as well as higher HDLC/apoA‐I and HDLC/apoA‐II ratios, are reported to lower the risk of future development of type 2 diabetes22. In mice, a global deletion of apoA‐I resulted in impaired glucose tolerance23, whereas apoA‐I overexpression increased insulin sensitivity24. ApoA‐I stimulates the adenosine monophosphate‐activated protein kinase pathway in myocytes in vitro23. Therefore, HDL and apoA‐I could increase insulin sensitivity and decrease insulin resistance. This raises the possibility that differences in apoA‐I concentration might be related to the varied HDL effects on type 2 diabetes between Japanese–Americans and native Japanese.
We showed that, although trend analysis of the effect of HDLC on the development of type 2 diabetes after adjustment for age and sex was statistically significant both in Japanese–Americans and native Japanese, trend analysis after further adjustment for category of OGTT and BMI was statistically significant only in Japanese–Americans. With respect to category of HDLC level in the present study, the first and second quartiles among Japanese–Americans corresponded approximately to the first quartile among native Japanese, and the third quartile among Japanese–Americans overlapped almost completely with the second quartile among native Japanese. Therefore, it is possible that the trend in effect of HDLC level on development of type 2 diabetes among Japanese–Americans provides evidence of the same effect in the first and second quartiles among native Japanese. It suggests that, although HDLC level plays a protective role in prevention of type 2 diabetes in Japanese–Americans and native Japanese, it might be rate limiting, especially when HDLC level is very low.
The present study had several limitations. First, although participants did not have diabetes at baseline, medications for other medical conditions might have affected the study's findings. However, as far as we could ascertain in our investigations, medication use did not differ among the four quartiles of HDLC participants (data not shown). Second, in only native Japanese participants, we had no data regarding family history of diabetes. Therefore, we were unable to use family history of diabetes as an adjustment factor. Third, HDLC level is generally known to be higher among women than among men, but we analyzed both sexes together. However, the numbers of men and women were almost the same in both populations of Japanese–Americans and native Japanese, and we used sex as an adjustment factor in all analyses, which provides a more powerful analysis than subset analyses separately for each sex as long as the sex adjustment is valid (i.e., there was no interaction between sex and other factors, as such interactions were not included in our models). Fourth, in the present study, fasting glucose and 2‐h glucose were significantly higher in native Japanese than in Japanese–Americans, because the criteria for undergoing OGTT differed between Japanese–Americans and native Japanese. Furthermore, the number of IGT participants was larger among native Japanese than among Japanese–Americans, although the number of developed type 2 diabetes was lower among native Japanese than among Japanese–Americans, which might have affected the results. Finally, the present study was observational. Hence, whether low HDLC is a cause of diabetes development is unclear. Further examination will be required.
In summary, we provide evidence that low HDLC level might be a risk factor for development of type 2 diabetes. This finding has the potential to add a new dimension to understanding the clinical relationship between glucose metabolism and HDLC level. The present study also suggests that HDL could exert a beneficial metabolic effect for prevention not only of cardiovascular disease, but also diabetes, especially in Japanese–American subjects with low HDLC level.
Acknowledgements
The authors received no specific funding for this article and have declared that no competing interests exist. The authors thank the members of Hiroshima Atomic Bomb Casualty Council, Health Management and Promotion Center, as well as the Hiroshima Kenjin‐Kai of Hawaii and Southern California for their participation. We are indebted to the late Dr Seiryo Takashina, former president of Hiroshima General Hospital, and Dr Kazufumi Ishida and Dr Hirofumi Usui, Hiroshima General Hospital, for carrying out sample assays.
J Diabetes Invest 2014; 5: 501–506
References
- 1.Gordon T, Castelli WP, Hjortland MC, et al High density lipoprotein as a protective factor against coronary heart disease. The Framingham Study. Am J Med 1977; 62: 707–714 [DOI] [PubMed] [Google Scholar]
- 2.Gordon DJ, Probstfield JL, Garrison RJ, et al High‐density lipoprotein cholesterol and cardiovascular disease. Four prospective American studies. Circulation 1989; 79: 8–15 [DOI] [PubMed] [Google Scholar]
- 3.Cooney MT, Dudina A, De Bacquer D, et al HDL cholesterol protects against cardiovascular disease in both genders, at all ages and at all levels of risk. Atherosclerosis 2009; 206: 611–616 [DOI] [PubMed] [Google Scholar]
- 4.Cameron AJ, Zimmet PZ, Shaw JE, et al The metabolic syndrome: in need of a global mission statement. Diabet Med 2009; 26: 306–309 [DOI] [PubMed] [Google Scholar]
- 5.Després JP, Lemineux I, Bergeron J, et al Abdominal obesity and the metabolic syndrome: contribution to global cardiometabolic risk. Arterioscler Thromb Vasc Biol 2008; 28: 1039–1049 [DOI] [PubMed] [Google Scholar]
- 6.Murphy AJ, Westerterp M, Yvan‐Charvet L, et al Anti‐atherogenic mechanisms of high density lipoprotein: effects on myeloid cells. Biochim Biophys Acta 2012; 1821: 513–521 [DOI] [PMC free article] [PubMed] [Google Scholar]
- 7.Houstis N, Rosen ED, Lander ES. Reactive oxygen species have a causal role in multiple forms of insulin resistance. Nature 2006; 440: 944–948 [DOI] [PubMed] [Google Scholar]
- 8.Nakanishi S, Okubo M, Yoneda M, et al A comparison between Japanese‐Americans living in Hawaii and Los Angeles and native Japanese: the impact of lifestyle westernization on diabetes mellitus. Biomed Pharmacother 2004; 58: 571–577 [DOI] [PubMed] [Google Scholar]
- 9.Awaya T, Yokosaki Y, Yamane K, et al Gene‐environment association of an ITGB2 sequence variant with obesity in ethnic Japanese. Obesity 2008; 16: 1463–1466 [DOI] [PubMed] [Google Scholar]
- 10.Yoneda M, Yamane K, Jitsuiki K, et al Prevalence of metabolic syndrome compared between native Japanese and Japanese‐Americans. Diabetes Res Clin Pract 2008; 79: 518–522 [DOI] [PubMed] [Google Scholar]
- 11.Nakanishi S, Yamane K, Kamei N, et al Elevated C‐reactive protein is a risk factor for the development of type 2 diabetes in Japanese Americans. Diabetes Care 2003; 26: 2754–2757 [DOI] [PubMed] [Google Scholar]
- 12.Egusa G, Murakami F, Ito C, et al Westernized food habits and concentrations of serum lipids in the Japanese. Atherosclerosis 1993; 100: 249–255 [DOI] [PubMed] [Google Scholar]
- 13.Nakashima R, Kamei N, Yamane K, et al Decreased total and high molecular weight adiponectin are independent risk factors for the development of type 2 diabetes in Japanese‐Americans. J Clin Endocrinol Metab 2006; 91: 3873–3877 [DOI] [PubMed] [Google Scholar]
- 14.Ito C, Mito K, Hara H. Review of criteria for diagnosis of diabetes mellitus based on results of follow‐up study. Diabetes 1983; 32: 343–351 [DOI] [PubMed] [Google Scholar]
- 15.Report of the Expert Committee on the Diagnosis and Classification of Diabetes Mellitus. Diabetes Care 1997; 20: 1183–1197 [DOI] [PubMed] [Google Scholar]
- 16.Schoenfeld D. Partial residuals for the proportional hazards regression model. Biometrika 1982; 69: 239–241 [Google Scholar]
- 17.Navab M, Berliner JA, Subbanagounder G, et al HDL and the inflammatory response induced by LDL‐derived oxidized phospholipids. Arterioscler Thromb Vasc Biol 2001; 21: 481–488 [DOI] [PubMed] [Google Scholar]
- 18.Drew BG, Rye KA, Duffy SJ, et al The emerging role of HDL in glucose metabolism. Nat Rev Endocrinol 2012; 8: 237–245 [DOI] [PubMed] [Google Scholar]
- 19.von Eckardstein A, Sibler RA. Possible contributions of lipoproteins and cholesterol to the pathogenesis of diabetes mellitus type 2. Curr Opin Lipidol 2011; 22: 26–32 [DOI] [PubMed] [Google Scholar]
- 20.Kruit JK, Brunham LR, Verchere CB, et al HDL and LDL cholesterol significantly influence beta‐cell function in type 2 diabetes mellitus. Curr Opin Lipidol 2010; 21: 178–185 [DOI] [PubMed] [Google Scholar]
- 21.Donath MY, Böni‐Schnetzler M, Ellingsgaard H, et al Islet inflammation impairs the pancreatic beta‐cell in type 2 diabetes. Physiology (Bethesda) 2009; 24: 325–331 [DOI] [PubMed] [Google Scholar]
- 22.Abbasi A, Corpeleijn E, Gansevoort RT, et al Role of HDL cholesterol and estimates of HDL particle composition in future development of type 2 diabetes in the general population: The PREVEND Study. J Clin Endocrinol Metab 2013; 98: 1352–1359 [DOI] [PubMed] [Google Scholar]
- 23.Han R, Lai R, Ding Q, et al Apolipoprotein A‐I stimulates AMP‐activated protein kinase and improves glucose metabolism. Diabetologia 2007; 50: 1960–1968 [DOI] [PubMed] [Google Scholar]
- 24.Ruan X, Li Z, Zhang Y, et al Apolipoprotein A‐I possesses an anti‐obesity effect associated with increase of energy expenditure and up‐regulation of UCP1 in brown fat. J Cell Mol Med 2011; 15: 763–772 [DOI] [PMC free article] [PubMed] [Google Scholar]