

Abstract
Aims/Introduction
Sasang constitutional medicine (SCM) has existed in traditional Korean medicine for more than 100 years. SCM consists of four different types: So‐Eum (SE), So‐Yang (SY), Tae‐Eum (TE) and Tae‐Yang (TY). It is of great importance that the Sasang constitution type (SCT) be evaluated accurately and recognized by medical communities.
Materials and Methods
From the Ansung–Ansan prospective cohort study, 10,038 participants were recruited from the years 2001–2002. Of 10,038 original participants, 2,460 participants underwent SCT evaluation. The Cox proportional hazard model was used to predict diabetes during the 10‐year follow‐up period.
Results
During 10 years of follow up (22,007 person‐years), 472 incidence cases (215/10,000 Incidence Density) of type 2 diabetes mellitus were documented. We identified that the TE group was significantly older, more obese, and had higher blood pressure, glucose metabolic values and lipid profiles levels. Relative risk (RR) and 95% confident intervals (CI) for type 2 diabetes were 1.696 (95% CI 1.204–2.39, P = 0.003) for TE when compared with the SE type. After controlling all potential confounders, the Cox proportional hazard model showed that RR was 1.635 (95% CI 1.111–2.406) in non‐obese (body mass index <25) TE, and RR was 1.725 (95% CI 1.213–2.452) in obese (body mass index ≥25) TE when compared with the SE type. We did not find any differences when comparing SE and SY types. The findings shows that TE is a higher risk factor for type 2 Diabetes, independent of obesity level.
Conclusions
The present study suggests that the TE type, independent of obesity level, is a strong risk factor of type 2 diabetes.
Keywords: Prospective study, Sasang constitutional medicine, Type 2 diabetes mellitus
Introduction
Constitutional medicine is a form of oriental medicine (Chinese and Korean) to classify individuals into groups, utilizing various phenotypic characteristics. Traditionally, the classification was used for diagnosis of diseases, predictions and treatments. In the late 1970s, the Chinese medical profession proposed a constitutional theory based on an individual's phenotypic and behavioral characteristics, such as the shape of the human body, functions, psychology and personality. The study proposed constitutions into nine modules based on the aforementioned criteria1. However, the Korean traditional medical profession views the same issues with a different approach, including more phenotypic characteristics, such as voice, shape of face, favorite types of food, digestive patterns and vowel patterns, and proposed four to 32 modules2. Furthermore, the concept of SCM, which shares similar views to tailored medicine, has been in existence in traditional Korean medicine for more than 100 years. Korean medical scholar, Lee Jae‐ma (1837–1900), classified people into four types of constitutions: (Sasang), So‐Eum, So‐Yang, Tae‐Em and Tae‐Yang. He presented the physiology, pathology, and guidelines for a healthy life in relation to the physical and psychological attributes of each constitutional type. He also added that genetic factors and the surrounding environment influence constitution2. According to the traditional SCM theory, each SCT represents different temperaments, body shapes and functional activities of the four viscera: lungs, liver, spleen and kidneys. Typically, a person with a TY type is creative, positive and heroic, and has a more‐developed lung area and a less‐developed liver area. The TE type refers to a cautious and endurable personality, and people with this type have a more developed liver area and a less developed lung area. The SE type can be characterized by an inactive and self‐directed personality, and people characterized by this type typically have a more developed kidney area and a less developed spleen area. The SY type has a sharp temperament, easily gets bored and, unlike the SE type, is characterized by a developed spleen area and a less developed kidney area. Each SCT also represents differently developed appearances: developed nape area in the TY type; developed chest in the SY type; developed waist in the TE type; developed hip in the SE type. Furthermore, based on previous studies that examined physical traits of SCT, the TE type has relatively elevated levels of body fat mass, blood pressure and blood lipids, such as total cholesterol, triglyceride and low‐density lipoprotein, as compared with the SY and SE types3. Researchers have not only been attempting to develop methods that can objectively and reliably classify constitution types, but have also been investigating the relationship between SCTs and various kinds of pathological conditions. As a result of these efforts, over the past decade, there has been a growing body of evidence showing that SCTs might be independently associated with different types of chronic diseases. It has been reported that individual SCTs have different blood glucose levels, high‐density lipoprotein (HDL) cholesterol, blood pressure (BP), serum triglycerides (TG) and abdominal obesity, which are well‐known risk factors for metabolic syndrome (MetS)4. The TE and SY types, in particular, have a higher risk for MetS as compared with the SE type. In addition, it has been found that the four SCTs have a different prevalence for diabetes mellitus5 and hypertension6, and might function as risk factors for the disease. This suggests that the appropriate classification of patients, according to SCTs, might be helpful in predicting susceptibility to such types of disease.
Constitutional typology has been an area of interest in both Eastern and Western countries since ancient times7. It is of great importance that SCTs are determined accurately, are recognized by medical communities and are utilized as a better therapeutic treatment, as well as an early diagnosis and prevention tool. Therefore, we integrated constitutional medicine with an ongoing prospective cohort epidemiological study to evaluate its values for early diagnosis of chronic diseases, such as type 2 diabetes mellitus.
Materials and Methods
The design and baseline characteristics of the Ansung–Ansan cohort study have been published, and a detailed description of the study is reported elsewhere8. Briefly, it is an ongoing prospective, community‐based cohort study as part of the Korean Genome and Epidemiology Study (KoGES), a community‐based epidemiological survey to investigate the trends in diabetes and associated risk factors. The baseline examination was carried out in 2001–2002, and biennial follow‐up examinations are ongoing. The eligibility criteria included an age of 40–69 years, residence within the borders of the survey area for at least 6 months before examination, and sufficient mental and physical ability to participate. A total of 10,038 participants were recruited from the residents of two Korean communities, Ansung (rural) and Ansan (urban). In Ansung, 5,018 were surveyed (70% response rate) using a cluster‐sampling method stratified by age, sex and residential district. Ansan had a population of 554,998 in 2000, and we successfully recruited 5,020 from the 124,775 eligible subjects (4.0%) using a random sampling method of the local telephone directory. At the fourth follow‐up examination (year 2009–10), we integrated SCM classification tools and stratified the study cohort according to the four different types. Of the total of 10,038 participants from the rural community, 6,525 were evaluated for SCTs, and 3,022 were successfully classified9. However, after excluding participants missing any part of the classification variables, with pre‐existing type 2 diabetes mellitus, and dropouts after the year 2010, a total of 2,460 participants fulfilled the classification criteria and are the participants of the current analyses.
Throughout the study, the same trained researchers and instruments were used to collect the data. Anthropometric parameters and blood pressure were measured by standard methods. The fasting plasma concentrations of glucose, insulin, total cholesterol, triglycerides, HDL cholesterol and high‐sensitivity C reactive protein (hsCRP) were measured in a central laboratory. After 8–14 h of overnight fasting, all participants underwent a 2 h, 75‐g oral glucose tolerance test at inclusion and biennially to diagnose type 2 diabetes mellitus according to the 1997 American Diabetes Association criteria: fasting plasma glucose concentration ≥7.0 mmol/L (126 mg/dL), or postprandial 2‐h glucose concentration ≥11.1 mmol/L (200 mg/dL), or current treatment by oral antidiabetic drugs or insulin. Glycated hemoglobin level was measured using high‐performance liquid chromatography (VARIANT II; BioRad Laboratories, Hercules, CA, USA). Pancreatic β‐cell function and insulin resistance were calculated by the homeostasis model assessment (HOMA‐β and HOMA‐IR, respectively).
Each constitutional type was determined by an integrated diagnostic model developed with a multinomial logistic regression based on four individual quantitative data areas, such as facial characteristics, body shapes, voice analysis and questionnaire responses that were recorded in a previous study9. The diagnostic power of the model adapted to classify SCT in the present study is superior to that of the Questionnaire for the Sasang Constitution Classification II10, which has been commonly used for the classification of SCT11. Briefly, the facial images of participants were taken with a digital camera, and several facial points and contours were automatically generated by image‐processing procedures. Variables for facial points and contours include the following: width, height, areas, angle and depth, and ratio of face shape, forehead, eye, upper eyelid, and nose. For the body shape analysis, eight circumferences (forehead circumference, neck circumference, axillary circumference, chest circumference, rib circumference, waist circumference, pelvic circumference and hip circumference) in addition to height, weight and body mass index (BMI), were used to express body shape characteristics. A voice analysis was made by using two voice‐analysis programs, Hidden Markov Model Toolkit (HTK) and Praat. A voice signal, having a minimum duration of 40 ms, was used for feature extraction. More than 200 features from the vowels and the sentences were extracted as an initial set, and 88 features were finally selected for a final diagnostic model after applying a genetic algorithm‐based feature selection technique. The questionnaire for SCTs includes personality characteristics, which consisted of 15 questions and can specify general temperament, eating habits (e.g., whether having regular meals, frequency of eating meals a day and eating speed) and physiological symptoms (e.g., perspiration, excrement, discomfort in the body, site of discomfort when unwell and existence of fatigue).
The data are presented as the mean ± standard deviation, as numbers and percentages, or as relative risks (RR) with 95% confidence interval (CI). Fasting insulin, triglyceride, hsCRP concentrations, HOMA‐β and HOMA‐IR were highly skewed, and were normalized by logarithmic transformation. The means were compared by Student's t‐tests or by ancova. For qualitative variables, the results are expressed as percentages and were compared by χ2 test. Pearson's correlation analysis was also used to determine the relationships among the study variables. The risk of new‐onset diabetes according to the constitutional medicine was modelled using the Cox proportional hazard model, after adjusting for the putative study variables. We first examined unadjusted Sasang variables on the 10‐year incidence of diabetes (model A). Model B comprised model A with further adjustments for age, sex and place of residency. Model C was the adjusted model B plus smoking and family history of type 2 diabetes mellitus. Finally, model D was the adjusted model C plus systolic blood pressure, HOMA‐IR, β‐cell function, total cholesterol and triglyceride. The BMI level showed a significant interaction with TU; we stratified BMI and carried out subgroup analysis. The final Cox models fulfilled the proportional hazards assumption. All other analyses were carried out using the spss software (version 18.0; spss, Inc., Chicago, IL, USA). Significance was defined as P < 0.05 for two‐sided tests. Informed written consent was obtained from all participants. The study protocol was approved by the ethics committee of the Korean Center for Disease Control and Ajou University School of Medicine Institutional Review Board.
Results
We identified 314 SE, 876 SY and 1,270 TE, and no TY, which is consistent with the previous finding that the TY type is extremely low in the Korean population5. Therefore, only the data from TE, SE and SY constitutions were evaluated in the present study. The demographic and clinical characteristics of all participants are shown in Table 1, according to the SCT. The mean age was 48.4 ± 7.28 years in SE, 50.45 ± 8.1 years in SY and 51.04 ± 8.22 years in TE (P < 0.001). The level of obesity, defined by BMI, was also significantly different among the study groups; that is, 21.49 ± 1.97 in SE, 23.28 ± 2.29 in SY and 26.49 ± 2.5 in TE (P < 0.001). As shown in Table 1, a similar trend was also shown in blood pressures, glucose and insulin levels, as well as in lipid profiles; that is, lower in SE, SY middle, and high in TE type (all P < 0.001). The 10‐year cumulative incidence of type 2 diabetes mellitus was 38 out of 314 (12.1%) in SE, 125 out of 876 (14.3%) in SY and 309 out of 1,270 (24.3%) in TE type (P < 0.01). To identify the independent relationships among the putative risk factors, including SCT variables and onset of type 2 diabetes mellitus, we carried out the Cox proportional hazard analysis. The model showed that BMI, sex, urban residence, family history of diabetes, smoking, systolic blood pressure and HOMA‐IR remain as independent risk factors, but not the SCT. However, we are inclined to believe that the reason for SCT not appearing as an independent risk factor for type 2 diabetes mellitus was due to the masking effects. Many known risk factors for type 2 diabetes mellitus were included in the model and all of these variables, especially the level of obesity, were significantly higher in the TE type. Thus, we stratified the TE group into two subgroups according to BMI levels to evaluate the SCT effects on the onset of type 2 diabetes mellitus, independent of obesity level. As shown in Table 2, we found trend relationships in all study variables when compared among the four groups, highest in the obese (BMI ≥25 kg/m2) TE group and followed by the non‐obese (BMI <25 kg/m2) TE, SE and SY types. The known risk factors for type 2 diabetes mellitus were significantly higher in obese TE when compared with non‐obese TE, SE or SY type. For example, waist circumference in obese TE was 89.05 ± 6.71 cm, 81.9 ± 5.6 cm in non‐obese TE, 78.22 ± 7.62 cm in SY, and 74.93 ± 6.74 cm in the SE type (P < 0.001). We also observed a similar pattern in hemodynamic variables, systolic blood pressure in obese TE was 119.33 ± 17.29 mmHg, 115.08 ± 17.07 mmHg in non‐obese TE, 113.55 ± 17.28 mmHg in SE and 110.63 ± 14.91 mmHg in the SY type (P < 0.001). This pattern was persistent in metabolic variables, such as fasting and 2‐h glucose values. For example, the 2‐h glucose value in obese TE was 6.87 ± 1.64 mmol/L, 6.41 ± 1.74 mmol/L in non‐obese TE, 6.40 ± 1.67 mmol/L in SE and 6.20 ± 1.63 mmol/L in the SY type (P < 0.001). In this analysis, we observed TE in higher obesity (i.e., P < 0.001). We observed TE in glycated hemoglobin levels and insulin levels, but poor lipid profiles. These differences were all statistically significant (P < 0.001). We identified that numerous factors were associated with Sasang classification, independent of obesity levels. Thus, we further analyzed the apparent independent relationship between Sasang classification and onset of type 2 diabetes mellitus controlling potential risk factors using a multivariate analysis. The frequency of type 2 diabetes mellitus within the 10‐year follow‐up period was 12.1% in SE, 14.3% in SY, 23.2% in non‐obese TE and 24.8% in obese TE (Table 3). As shown in Table 3, Cox proportional hazard analysis revealed statistically significant differences in the multivariate unadjusted RR when compared with the SE type: SY (RR 1.204, 95% CI 0.837–1.73, P = 0.316), non‐obese TE (RR 2.053, 95% CI 1.4–3.009, P < 0.001) and obese TE (RR 2.178, 95% CI 1.544–3.071, P < 0.001). Furthermore, when all the potential risk factors for type 2 diabetes mellitus were adjusted, in model D, SY (RR 1.137, 95% CI 0.789–1.641, P = 0.49), non‐obese TE (RR 1.635, 95% CI 1.111–2.406, P = 0.013) and obese TE (RR 1.725, 95% CI 1.213–2.452, P = 0.002) were significantly higher risks for type 2 diabetes mellitus than the SE type, with the exception of the SY type. Furthermore, the risk of type 2 diabetes mellitus was not different between the SE and SY, and non‐obese and obese TE type, but the TE type was at high risk for type 2 diabetes mellitus when compared with SE or SY types. Our findings are indicative of the TE type being at high risk of type 2 diabetes mellitus independent of BMI. Furthermore, when TE not stratified by the level of obesity was compared with the SE type, the risk of developing type 2 diabetes mellitus within 10 years was 1.696‐fold greater (95% CI 1.204–2.39, P = 0.003).
Table 1. Demographic and clinical characteristics by the Sasang constitutional type.
| Variables | So‐Eum | So‐Yang | Tae‐Eum | P‐value |
|---|---|---|---|---|
| n | 314 | 876 | 1,270 | |
| Men | 156 (49.7%) | 312 (35.6%) | 632 (49.8%) | <0.001 |
| Age (years) | 48.40 ± 7.28 | 50.45 ± 8.10 | 51.04 ± 8.22 | <0.001 |
| BMI (kg/m2) | 21.49 ± 1.97 | 23.28 ± 2.29 | 26.49 ± 2.50 | <0.001 |
| Waist circumference (cm) | 74.93 ± 6.74 | 78.22 ± 7.62 | 87.00 ± 7.18 | <0.001 |
| Weight (kg) | 55.67 ± 6.92 | 58.02 ± 8.08 | 69.16 ± 8.74 | <0.001 |
| Fat mass (kg) | 12.30 ± 4.10 | 15.11 ± 4.07 | 19.73 ± 4.98 | <0.001 |
| Fat (%) | 22.17 ± 6.96 | 26.17 ± 6.42 | 28.72 ± 6.75 | <0.001 |
| Lean mass (kg) | 40.86 ± 6.58 | 40.45 ± 7.21 | 46.63 ± 8.00 | <0.001 |
| Lean (%) | 73.27 ± 6.75 | 69.65 ± 6.25 | 67.28 ± 6.53 | <0.001 |
| Waist to hip ratio | 0.84 ± 0.07 | 0.86 ± 0.08 | 0.90 ± 0.07 | <0.001 |
| Systolic blood pressure (mmHg) | 110.63 ± 14.91 | 113.55 ± 17.28 | 118.11 ± 17.33 | <0.001 |
| Diastolic blood pressure (mmHg) | 71.31 ± 10.03 | 72.90 ± 10.83 | 76.30 ± 11.62 | <0.001 |
| Fasting plasma glucose (mmol/L) | 4.62 ± 0.44 | 4.65 ± 0.46 | 4.79 ± 0.51 | <0.001 |
| 2‐h glucose (mmol/L) | 6.20 ± 1.63 | 6.40 ± 1.67 | 6.74 ± 1.68 | <0.001 |
| HbA1c (%) | 5.27 ± 0.35 | 5.31 ± 0.37 | 5.41 ± 0.40 | <0.001 |
| Fasting insulin (pmol/L) | 39.14 ± 17.00 | 43.36 ± 25.88 | 49.80 ± 31.02 | <0.001 |
| HOMA‐IR | 1.35 ± 0.62 | 1.50 ± 0.92 | 1.78 ± 1.12 | <0.001 |
| β‐Cell function | 135.48 ± 88.18 | 153.26 ± 142.22 | 151.34 ± 139.23 | 0.118 |
| QUICKI index | 0.75 ± 0.33 | 0.71 ± 0.19 | 0.69 ± 0.29 | 0.004 |
| Total cholesterol (mmol/L) | 4.82 ± 0.88 | 4.89 ± 0.86 | 5.16 ± 0.91 | <0.001 |
| HDL cholesterol (mmol/L) | 1.27 ± 0.29 | 1.25 ± 0.29 | 1.15 ± 0.26 | <0.001 |
| Triglyceride (mmol/L) | 1.40 ± 0.66 | 1.48 ± 0.84 | 1.91 ± 1.21 | <0.001 |
| CRP | 0.18 ± 0.39 | 0.21 ± 0.89 | 0.22 ± 0.28 | 0.540 |
| WBC | 6.41 ± 1.64 | 6.26 ± 1.78 | 6.64 ± 1.75 | <0.001 |
| RBC | 4.40 ± 0.45 | 4.32 ± 0.44 | 4.49 ± 0.47 | <0.001 |
| Hemoglobin | 13.35 ± 1.66 | 13.16 ± 1.62 | 13.82 ± 1.58 | <0.001 |
| Hematocrit | 40.57 ± 4.54 | 39.83 ± 4.54 | 41.60 ± 4.56 | <0.001 |
| Platelet | 259.37 ± 61.62 | 265.14 ± 60.81 | 269.50 ± 61.68 | 0.022 |
| AST | 26.30 ± 14.33 | 26.28 ± 12.33 | 27.26 ± 12.06 | 0.154 |
| ALT | 22.07 ± 14.40 | 22.67 ± 15.64 | 28.28 ± 22.53 | <0.001 |
| Center (Ansung) | 132 (42.0%) | 456 (52.1%) | 583 (45.9%) | 0.002 |
| Family history of diabetes | 40 (12.7%) | 86 (9.8%) | 162 (12.8%) | 0.095 |
| Smoker | 84 (27.3%) | 151 (17.5%) | 294 (23.4%) | <0.001 |
| Sporting activity | 88 (28.0%) | 308 (35.2%) | 522 (41.1%) | <0.001 |
| Alcohol intake | 46 (15.0%) | 134 (15.9%) | 359 (28.7%) | <0.001 |
ALT, alanine aminotransferase; AST, aspartate aminotransferase; BMI, body mass index; CRP, C‐reactive protein; HbA1c, glycated hemoglobin; HDL, high‐density lipoprotein; HOMA‐IR, homeostasis model assessment of insulin resistance; QUICKI, Quantitative Insulin Sensitivity Check Index; RBC, red blood cells, WBC, white blood cells.
Table 2. Demographic and clinical characteristics by the Sasang constitutional type after subgrouping Tae‐Eum type by the level of body mass index.
| Variables | So‐Eum | So‐Yang | Tae‐Eum BMI <25 (kg/m2) | Tae‐Eum BMI ≥25 (kg/m2) | P‐value |
|---|---|---|---|---|---|
| n | 314 | 876 | 366 | 904 | |
| Men | 156 (49.7%) | 312 (35.6%) | 214 (58.5%) | 418 (46.2%) | <0.001 |
| Age (years) | 48.40 ± 7.28 | 50.45 ± 8.10 | 51.27 ± 8.59 | 50.95 ± 8.08 | <0.001 |
| BMI (kg/m2) | 21.49 ± 1.97 | 23.28 ± 2.29 | 23.79 ± 1.10 | 27.58 ± 2.03 | <0.001 |
| Waist circumference (cm) | 74.93 ± 6.74 | 78.22 ± 7.62 | 81.90 ± 5.60 | 89.05 ± 6.71 | <0.001 |
| Weight (kg) | 55.67 ± 6.92 | 58.02 ± 8.08 | 63.76 ± 6.48 | 71.35 ± 8.59 | <0.001 |
| Fat mass (kg) | 12.30 ± 4.10 | 15.11 ± 4.07 | 15.65 ± 3.39 | 21.38 ± 4.56 | <0.001 |
| Fat (%) | 22.17 ± 6.96 | 26.17 ± 6.42 | 24.70 ± 5.82 | 30.34 ± 6.42 | <0.001 |
| Lean mass (kg) | 40.86 ± 6.58 | 40.45 ± 7.21 | 45.52 ± 7.01 | 47.08 ± 8.34 | <0.001 |
| Lean (%) | 73.27 ± 6.75 | 69.65 ± 6.25 | 71.10 ± 5.76 | 65.74 ± 6.18 | <0.001 |
| Waist to hip ratio | 0.84 ± 0.07 | 0.86 ± 0.08 | 0.88 ± 0.07 | 0.91 ± 0.07 | <0.001 |
| Systolic blood pressure (mmHg) | 110.63 ± 14.91 | 113.55 ± 17.28 | 115.08 ± 17.07 | 119.33 ± 17.29 | <0.001 |
| Diastolic blood pressure (mmHg) | 71.31 ± 10.03 | 72.90 ± 10.83 | 73.82 ± 11.50 | 77.30 ± 11.53 | <0.001 |
| Fasting plasma glucose (mmol/L) | 4.62 ± 0.44 | 4.65 ± 0.46 | 4.73 ± 0.49 | 4.82 ± 0.51 | <0.001 |
| 2‐h glucose (mmol/L) | 6.20 ± 1.63 | 6.40 ± 1.67 | 6.41 ± 1.74 | 6.87 ± 1.64 | <0.001 |
| HbA1c (%) | 5.27 ± 0.35 | 5.31 ± 0.37 | 5.33 ± 0.37 | 5.45 ± 0.41 | <0.001 |
| Fasting insulin (pmol/L) | 39.14 ± 17.00 | 43.36 ± 25.88 | 42.50 ± 22.72 | 52.76 ± 33.37 | <0.001 |
| HOMA‐IR | 1.35 ± 0.62 | 1.50 ± 0.92 | 1.49 ± 0.79 | 1.89 ± 1.20 | <0.001 |
| β‐cell function | 135.48 ± 88.18 | 153.26 ± 142.22 | 137.92 ± 119.50 | 156.75 ± 146.15 | 0.025 |
| QUICKI index | 0.75 ± 0.33 | 0.71 ± 0.19 | 0.72 ± 0.23 | 0.68 ± 0.32 | 0.002 |
| Total cholesterol (mmol/L) | 4.82 ± 0.88 | 4.89 ± 0.86 | 5.06 ± 0.92 | 5.20 ± 0.90 | <0.001 |
| HDL cholesterol (mmol/L) | 1.27 ± 0.29 | 1.25 ± 0.29 | 1.19 ± 0.28 | 1.14 ± 0.25 | <0.001 |
| Triglyceride (mmol/L) | 1.40 ± 0.66 | 1.48 ± 0.84 | 1.79 ± 1.28 | 1.96 ± 1.18 | <0.001 |
| CRP | 0.18 ± 0.39 | 0.21 ± 0.89 | 0.20 ± 0.27 | 0.23 ± 0.29 | 0.520 |
| WBC | 6.41 ± 1.64 | 6.26 ± 1.78 | 6.43 ± 1.74 | 6.73 ± 1.76 | <0.001 |
| RBC | 4.40 ± 0.45 | 4.32 ± 0.44 | 4.47 ± 0.46 | 4.51 ± 0.47 | <0.001 |
| Hemoglobin | 13.35 ± 1.66 | 13.16 ± 1.62 | 13.80 ± 1.49 | 13.83 ± 1.61 | <0.001 |
| Hematocrit | 40.57 ± 4.54 | 39.83 ± 4.54 | 41.66 ± 4.36 | 41.57 ± 4.64 | <0.001 |
| Platelet | 259.37 ± 61.62 | 265.14 ± 60.81 | 263.94 ± 59.43 | 271.75 ± 62.46 | 0.008 |
| AST | 26.30 ± 14.33 | 26.28 ± 12.33 | 26.66 ± 13.47 | 27.50 ± 11.44 | 0.177 |
| ALT | 22.07 ± 14.40 | 22.67 ± 15.64 | 26.73 ± 30.28 | 28.91 ± 18.49 | <0.001 |
| Center (Ansung) | 132 (42.0%) | 456 (52.1%) | 132 (42.0%) | 456 (52.1%) | 0.001 |
| Family history of diabetes | 40 (12.7%) | 86 (9.8%) | 52 (14.2%) | 110 (12.2%) | 0.124 |
| Smoker | 84 (27.3%) | 151 (17.5%) | 103 (28.4%) | 191 (21.4%) | <0.001 |
| Sporting activity | 88 (28.0%) | 308 (35.2%) | 154 (42.1%) | 368 (40.7%) | <0.001 |
| Alcohol intake | 46 (15.0%) | 134 (15.9%) | 113 (31.3%) | 246 (27.6%) | <0.001 |
ALT, alanine aminotransferase; AST, aspartate aminotransferase; BMI, body mass index; CRP, C‐reactive protein; HbA1c, glycated hemoglobin; HDL, high‐density lipoprotein; HOMA‐IR, homeostasis model assessment of insulin resistance; QUICKI, Quantitative Insulin Sensitivity Check Index; RBC, red blood cells, WBC, white blood cells.
Table 3. Cox proportional hazard model to predict type 2 diabetes according to the Sasang constitutional type.
| So‐Eum | So‐Yang | Tae‐Eum BMI <25 (kg/m2) | Tae‐Eum BMI ≥25 (kg/m2) | ||||
|---|---|---|---|---|---|---|---|
| Reference | Relative risk (95% CI) | P‐value | Relative risk (95% CI) | P‐value | Relative risk (95% CI) | P‐value | |
| Total number | 314 | 876 | 366 | 904 | |||
| No. events (%) | 38 (12.1%) | 125 (14.3%) | 85 (23.2%) | 224 (24.8%) | |||
| Model A | 1.000 | 1.204 (0.837–1.731) | 0.316 | 2.053 (1.400–3.009) | <0.001 | 2.178 (1.544–3.071) | <0.001 |
| Model B | 1.000 | 1.192 (0.827–1.717) | 0.346 | 1.771 (1.205–2.602) | 0.004 | 2.069 (1.466–2.921) | <0.001 |
| Model C | 1.000 | 1.180 (0.819–1.702) | 0.375 | 1.737 (1.182–2.554) | 0.005 | 2.061 (1.459–2.911) | <0.001 |
| Model D | 1.000 | 1.137 (0.789–1.641) | 0.491 | 1.635 (1.111–2.406) | 0.013 | 1.725 (1.213–2.452) | 0.002 |
Model A, unadjusted; model B, age, sex adjusted; model C, model B + smoking, family history of diabetes adjusted; model D, model C + systolic blood pressure, homeostasis model assessment of insulin resistance, total cholesterol adjusted. BMI, body mass index; CI, confidence interval.
Finally, during the 10 years of follow up (22,007 person‐years), 472 incidence cases (215/10,000 incidence density) of type 2 diabetes mellitus were documented. The incidence density of SE was 131 out of 10,000, SY 157 out of 10,000, and followed by TE (BMI <25) 264 out of 10,000, and TE (BMI ≥25) with 283 out of 10,000. We carried out 10‐year survival analysis after adjusting all potential risk factors for type 2 diabetes mellitus and compared rates. As shown in Figure 1, 12.1% of the SE and 14.3% of the SY developed type 2 diabetes mellitus during the 10‐year follow‐up period, whereas 23.2% in non‐obese TE and 24.8% in the obese TE type developed type 2 diabetes mellitus during the 10‐year follow‐up period. These findings show the incidence of type 2 diabetes mellitus was higher in TE groups when compared with SE, P < 0.01 (when compared with BMI <25 TE, P = 0.014, and P = 0.003 when compared with BMI ≥25 TE type), respectively, but no differences were observed between the two TE groups (non‐obese vs obese, P = 0.718).
Figure 1.
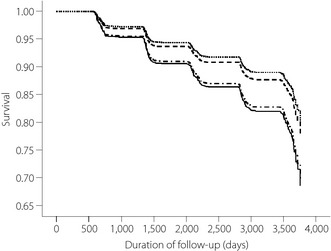
The 10‐year survival analysis of type 2 diabetes mellitus by the Sasang constitutional
type. Adjusted for age, sex, smoking status, family history of diabetes, systolic blood pressure,
homeostasis model assessment of insulin resistance and total cholesterol.
 So‐Eum;
 So‐Yang;
  Tae‐Eum body mass index <25 (kg/m2);
  Tae‐Eum body
mass index ≥25 (kg/m2).
Tae‐Eum body
mass index ≥25 (kg/m2).
Discussion
The objective of the present study was to evaluate the Korean traditional medicine, SCM, as the key indicator for early diagnosis of type 2 diabetes mellitus. The SCM is well defined and recognized by the Korean traditional medical profession, and has been utilized for early diagnosis and treatment of both communicable and non‐communicable diseases for more than 100 years. However, its value as a medical tool is yet to be recognized by the Western medical society, but consists of important values as a tailored medicine. Therefore, to evaluate SCM, we integrated the four types into the ongoing community cohort study, which has been ongoing since 2001. This is a community‐based prospective epidemiological study, and the goal is to evaluate the putative risk factors associated with type 2 diabetes mellitus. It is one of the largest community cohort studies funded by the Korean National Government, Ministry of Health and Welfare.
In previous publications using the same cohort, we reported newly identified risk factors for type 2 diabetes mellitus, including liver function measured by alanine aminotransferase levels, smoking and MetS8. However, those variables do not provide enough evidence to give a high probability of identifying type 2 diabetes mellitus. One of the weakest areas was identifying the phenotypic variables, and the only compromise variable was the obesity level. Therefore, we continue to explore potential risk factors that could best describe individuals' phenotypic characteristics. We chose SCT, which has been used by the Korean traditional medical profession for diagnosis, treatment, and prevention of both communicable and non‐communicable diseases for centuries. There are numerous recent publications supporting that SCM has the potential to be a scientific tool for the diagnosis, treatment and prevention of diseases, a concept similar to the MetS criteria6. Thus, we integrated such concepts into the ongoing prospective community cohort study for better and early diagnosis of type 2 diabetes mellitus. The frequency of type 2 diabetes mellitus within the 10‐year follow‐up period was 12.1% in SE, 14.3% in SY and 24.3% in TE. However, when we carried out SCT as an independent risk factor for the onset of type 2 diabetes mellitus, it did not remain in the model. Thus, we are inclined to believe that independent association between SCT and the onset of type 2 diabetes mellitus was masked by the many potential risk variables, such as the levels of obesity, which are significantly higher in the TE type. Jang et al.17 reported the TE type had a higher frequency of abdominal obesity when compared with the SE and SY types in males (odds ratio [OR] 1.79, 95% CI 1.02–3.15, P = 0.044; and OR 1.74, 95% CI 1.18–2.58, P = 0.006, respectively) and females (OR 1.51, 95% CI 1.03–2.23, P = 0.037; and OR 1.88, 95% CI 1.32–2.68, P < 0.001, respectively). The results persisted even after adjusting for the potential confounders, such as age, BMI, hypertension, diabetes mellitus, hypertriglyceridemia and low HDL cholesterol. That study suggested the TE type was independently associated with abdominal obesity17. Another study, reported by Cha et al.18 showed that higher obesity in the TE type was responsible of genetic association. He reported that the TE type was susceptible to obesity through sensitive to energy intake as a result of an imbalance toward preserving energy. Common variants of fat mass and obesity‐associated and melanocortin 4 receptor genes have been associated with increased BMI by affecting energy intake. That study concluded fat mass and obesity‐associated and melanocortin 4 receptor polymorphisms appear to play an important role in weight gain, whereas only fat mass and obesity‐associated variants play a role in weight loss after lifestyle intervention, and such differences were observed among the SCT18.
Metabolic syndrome is a complex disorder. Song et al.19 assessed the effects of the SCT on the risk of MetS in the Korean population. They are limited, but two studies showed the TE type is at high risk for insulin resistance and type 2 diabetes mellitus. Choi et al.20 reported the frequency of insulin resistance was higher in TE when compared with the other SCTs. A study by Lee et al.21, carried out in a hospital setting, showed that the TE type was at a greater risk for type 2 diabetes mellitus when compared with the other types; the adjusted OR of 2.01 (95% CI 0.77–5.26) when compared with SE type, and 3.96 (95% CI 1.48–10.60) with SY type. From the previous reports, the researchers showed levels of obesity, frequency of MetS, insulin resistance and type 2 diabetes mellitus rate differences among the SCT. However, all these findings are strongly associated with obesity. Thus, we attempted to re‐analyse our data after adjusting for the level of obesity, and to show an independent association of SCT and the onset of type 2 diabetes mellitus. Our primary analysis showed significant differences in the incidence of type 2 diabetes mellitus among the SCTs, but when we adjusted for the level of obesity by using the BMI, such an association no longer existed. Thus, we further stratified TE by the level of obesity, stratifying by BMI <25 and ≥25. After controlling for all the potential risk variables for type 2 diabetes mellitus, we identified that non‐obese (BMI <25) TE type was 1.6‐fold at greater risk for type 2 diabetes mellitus, and 1.7‐fold greater in the obese (BMI ≥25) TE type (Table 3). These findings further suggest that independent of the level of obesity, SCT is equally and independently associated with onset of type 2 diabetes mellitus. According to the survival analysis (Figure 1), we also showed that an onset of type 2 diabetes mellitus within 10 years of the follow‐up period was identical between the SE and SY types, and non‐obese and obese TE types.
In conclusion, the findings from the present study show that the incidence of type 2 diabetes mellitus was higher in the TE type, and the TE type is an independent risk factor for type 2 diabetes mellitus. Therefore, we would like to suggest that SCT is novel and merits its scientific value. It also has the potential to be developed and utilized in early identification as well as prevention of type 2 diabetes mellitus in various ethnic groups.
Acknowledgments
This research was supported by the National Genome Research Institute, the Korean Center for Disease Control and Prevention (contract #2001‐347‐6111‐221, 2002‐347‐6111‐221, 2003‐347‐6111‐221, 2004‐E71001‐00, 2005‐E71001‐00, 2006‐E71005‐00, 2006‐E71006‐00, 2007‐E71001‐00, 2007‐E71003‐00, 2008‐E71001‐00, 2008‐E71005‐00, 2009‐E71002‐00, 2009‐E71007‐00, 2010‐E71001‐00, 2010‐E71004‐00, 2011‐E71004‐00, 2011‐E71008‐00, 2012‐E71008‐00, 2012‐E71005‐00) and the National Research Foundation of Korea (NRF) funded by the Ministry of Science, ICT & Future Planning (Grant# NRF‐2009‐0090899, NRF‐2009‐0090900, NRF‐2012‐0009830). The funding source had no role in the collection of the data or in the decision to submit the manuscript for publication. No potential conflicts of interest relevant to this article were reported. All authors contributed to subsequent versions of the report and had responsibility for decision to submit for publication. We are grateful to the Ajou University Hospital Center for Clinical Epidemiology for carrying out a quality study, data management and statistical analysis.
J Diabetes Invest 2014; 5: 525–532
References
- 1.Wang J, Li Y, Ni C, et al Cognition research and constitutional classification in Chinese medicine. Am J Chin Med 2011; 39: 651–660 [DOI] [PubMed] [Google Scholar]
- 2.Song IB, Kho BH, Lee EJ. Sasang Constitutional Medicine, 2nd edn Jipmoondang, Seoul, 2004; 325–335 [Google Scholar]
- 3.Chae H, Lyoo IK, Lee SJ, et al An alternative way to individualized medicine: psychological and physical traits of Sasang typology. J Altern Complement Med 2003; 9: 519–528 [DOI] [PubMed] [Google Scholar]
- 4.Song KH, Yu SG, Kim JY. Prevalence of metabolic syndrome according to sasang constitutional medicine in Korean subjects. Evid Based Complement Alternat Med 2012; 2012: 1–8 [DOI] [PMC free article] [PubMed] [Google Scholar]
- 5.Lee T, Koh B, Lee S. Sasang constitution as a risk factor for diabetes mellitus: a cross‐sectional study. Evid Based Complement Alternat Med 2009; 6: 99–103 [DOI] [PMC free article] [PubMed] [Google Scholar]
- 6.Lee J, Lee J, Lee E, et al The sasang constitutional types can act as a risk factor for hypertension. Clin Exp Hypertens 2011; 33: 525–532 [DOI] [PubMed] [Google Scholar]
- 7.Lee EJ. Taeyangin Soyangin Taeumin Soeumin: Finding Out One's Constitutional Type. Jipmoondang, Seoul, 2002; 11–12 [Google Scholar]
- 8.Cho NH, Jang HC, Choi SH, et al Abnormal liver function test predicts type 2 diabetes: a community‐based prospective study. Diabetes Care 2007; 30: 2566–2568 [DOI] [PubMed] [Google Scholar]
- 9.Do JH, Jang E, Ku B, et al Development of an integrated Sasang constitution diagnosis method using face, body shape, voice, and questionnaire information. BMC Complement Altern Med 2012; 12: 85–93 [DOI] [PMC free article] [PubMed] [Google Scholar]
- 10.Yoo J, Kim J, Kim K, et al Sasangin diagnosis questionnaire: test of reliability. J Altern Complement Med 2007; 13: 111–122 [DOI] [PubMed] [Google Scholar]
- 11.Park H, Chun JJ, Kim J, et al A study on clinical application of the QSCCll (Questionnaire for the Sasang Constitution Classification ll). J Sasang Constitut Med 2002; 14: 35–44 [Google Scholar]
- 12.Lee JM. Longevity and Life preservation in Oriental Medicine, translated by S‐H. Kyung Hee University Press, Choi, 1996 [Google Scholar]
- 13.Cho NH, Chan JC, Jang HC, et al Cigarette smoking is an independent risk factor for type 2 diabetes: a four‐year community‐based prospective study. Clin Endocrinol (Oxf) 2009; 71: 679–685 [DOI] [PubMed] [Google Scholar]
- 14.Lim S, Lee HK, Kimm KC, et al A rural‐urban comparison of the characteristics of metabolic syndrome by gender in Korea: the Korean Health and Genome Study (KHGS). J Endocrinol Invest 2006; 29: 313–319 [DOI] [PubMed] [Google Scholar]
- 15.Ahn SY, Park SH, Han SR, et al Association between subclinical hypothyroidism and Sasang constitution in a Korean population. Exp Ther Med 2012; 3: 740–744 [DOI] [PMC free article] [PubMed] [Google Scholar]
- 16.Cooper EL. Contributions of sasang constitutional medicine. Evid Based Complement Alternat Med 2009; 6(Suppl 1): 1–3 [DOI] [PMC free article] [PubMed] [Google Scholar]
- 17.Jang E, Baek Y, Park K, et al Could the Sasang constitution itself be a risk factor of abdominal obesity? BMC Complement Altern Med 2013; 13: 72–76 [DOI] [PMC free article] [PubMed] [Google Scholar]
- 18.Cha S, Koo I, Park BL, et al Genetic effects of FTO and MC4R polymorphisms on body mass in constitutional types. Evid Based Complement Alternat Med 2011; 2011: 1–7 [DOI] [PMC free article] [PubMed] [Google Scholar]
- 19.Song KH, Yu SG, Kim JY. Prevalence of metabolic syndrome according to Sasang constitutional medicine in Korean subjects. Evid Based Complement Alternat Med 2012; 2012: 9–16 [DOI] [PMC free article] [PubMed] [Google Scholar]
- 20.Choi K, Lee J, Yoo J, et al Sasang constitutional types can act as a risk factor for insulin resistance. Diabetes Res Clin Pract 2011; 91: 57–60 [DOI] [PubMed] [Google Scholar]
- 21.Lee TG, Koh B, Lee S. Sasang constitution as a risk factor for diabetes mellitus: a cross‐sectional study. Evid Based Complement Alternat Med 2009; 6(Suppl 1): 99–103 [DOI] [PMC free article] [PubMed] [Google Scholar]