Abstract
We analyzed data from a large population-based prospective cohort study of household contacts of tuberculosis patients in Lima, Peru, to estimate the importance of within-household transmission relative to community-based transmission. We identified all adults (older than 15 years of age) who had incident pulmonary tuberculosis diagnosed at any of 106 public health centers in Lima from September 2009 to August 2012. A total of 14,041 household contacts of 3,446 index patients were assessed for tuberculosis infection and disease. We compared the prevalence of latent tuberculosis infection (LTBI) among persons who had received the Bacillus Calmette–Guérin vaccine in households with and without a microbiologically confirmed index case to estimate the age-specific risk of infection and excess risk of LTBI from household and community exposures. We found that the risk of infection from household and community sources increased from birth until 20 years of age. However, a large proportion of infections among child and young-adult household contacts could have been the result of household exposure. Excess infection risk associated with household exposure accounted for 58% (95% confidence interval: 47, 66) of LTBI prevalence among exposed children younger than 1 year of age, 48% (95% confidence interval: 39, 57) among 10-year-old children, and 44% (95% confidence interval: 34, 51) among 15-year-old adolescents. These findings suggest that expanded access to preventive therapy for older children and young-adult household contacts of known tuberculosis cases may be beneficial.
Keywords: household transmission, preventive therapy, tuberculosis
In 2011, there were an estimated 8.7 million new cases of tuberculosis and 1.4 million deaths attributable to the disease worldwide (1), making it a leading infectious cause of morbidity and mortality. Despite recent gains, clear gaps between international targets and current tuberculosis trends have stimulated discussion about revising the central features of the global tuberculosis policy (1). For example, although the World Health Organization Stop TB strategy has emphasized passive case detection (i.e., waiting for persons with tuberculosis symptoms to self-present to a health provider), recent recommendations have focused on active approaches to community-based identification of tuberculosis cases (2). Although evidence in support of community-wide active case finding is limited (3), more intensive efforts to increase targeted screening among high-risk persons may help identify cases earlier in their course of disease, thereby improving treatment outcomes and reducing transmission (4).
One clear opportunity for targeted screening is in households of patients recently diagnosed with tuberculosis. Screening close contacts of tuberculosis patients is a global standard (5), and standardized approaches for these interventions have been outlined previously (2). Household-based contact tracing can identify undetected active tuberculosis cases (which are invariably more common within these households than in the rest of the community (6, 7)) and allow recently infected contacts at high risk of developing tuberculosis to receive preventive therapy. Although such interventions are deployed regularly in resource-rich, low-tuberculosis settings, they have yet to be rolled out broadly in resource-constrained, higher-incidence settings (1, 6). A better understanding of the relative contributions of household and community exposure may help guide routine contact investigations in high-burden settings.
A specific benefit of household-based contact tracing is in reducing the burden of pediatric tuberculosis (3, 8). Systematic reviews of household contact investigations have found a high risk of active disease among children in homes of known tuberculosis cases (4, 6, 9). Because of the relative difficulty of diagnosing pediatric tuberculosis, the rate of detection among children less than 15 years of age has consistently lagged behind that in adults (2, 10). Furthermore, because latently infected children in these households may have been infected very recently, preventive therapy may be especially useful in preventing pediatric tuberculosis among children with household exposure (11).
Understanding the potential benefit of household-based interventions to overall tuberculosis control efforts requires estimating the relative importance of household versus community transmission of tuberculosis. Infection with Mycobacterium tuberculosis, the causative agent of tuberculosis, may occur after a susceptible person inhales M. tuberculosis–laden droplet nuclei expired by an infectious person. Though the infectious dose is typically small (<10 mycobacteria) (6, 12), observational studies have indicated that even in high-risk environments, such as inpatient tuberculosis wards, prolonged exposure is required for transmission to occur (13). Household studies indicated that only approximately half of household contacts of persons diagnosed with the most transmissible forms of pulmonary tuberculosis show evidence of latent tuberculosis infection (LTBI), despite the fact that household exposure likely occurred for months before diagnosis (14–17). However, in tuberculosis-endemic settings, it is clear that household contacts of persons with infectious tuberculosis are also at substantial risk of infection in the community. Previous studies in which investigators used M. tuberculosis genotype data to identify transmission chains suggested that in some high-incidence settings, the majority of cases of secondary disease among household contacts may be due to exposures outside the home (18).
In the present study, we show a novel approach to estimating age-specific risks of infection (ROI) from household and community sources in Lima, Peru. Although previous studies have addressed relative risks from household and community tuberculosis exposure (19), ours is the first to provide estimates of the age-specific ROI from household exposure. To do this, we used information on variation in probable infectiousness among persons with active tuberculosis to estimate the age-specific ROI for their household contacts and compared this with the age-specific annual risk of infection (ARI) from community exposure.
METHODS
Data
Our analysis is based on data that we collected during a large population-based prospective cohort study of households in Lima, Peru. Between September 2009 and August 2012, we identified all adults (>15 years of age) with incident pulmonary tuberculosis who were diagnosed at any of 106 participating public health centers located in our study catchment area, which contained approximately 3.3 million inhabitants. Within 1 month of diagnosis of tuberculosis in these “index patients,” a study nurse visited the patient's home and invited exposed household contacts to participate in a baseline assessment of tuberculosis infection and disease. Of the 14,041 household contacts of 3,446 index cases, 2,851 contacts and 306 index cases were excluded from this analysis because of missing or incomplete records. Of the 2,851 contacts with missing data, 1,986 were excluded because they did not receive a tuberculin skin test (TST) at baseline, 809 were excluded because we were missing data on whether they had received a Bacillus Calmette–Guérin (BCG) vaccination, and 56 were excluded because their household index case was excluded. Although BCG vaccination often leaves a characteristic scar, vaccinated persons may not scar (20). Therefore, to ensure an accurate representation of the impact of vaccination, we use the person's self-reported vaccination status rather than the presence of a BCG vaccine scar to estimate protective associations of BCG with disease. Of the 306 missing index cases, 79 were excluded because of missing sputum smear or culture results, whereas the remaining 227 were excluded either because they lived alone or because all of their household contacts were missing TST results. For results of a full analysis of the potential impact of these missing data on our results, see Web Appendix 1, Web Tables 1 and 2, and Web Figures 1–3, available at http://aje.oxfordjournals.org/.
In the present analysis, we took advantage of the fact that 22% of enrolled index cases who were diagnosed with tuberculosis based on clinical presentation and initiated treatment were eventually found to have negative sputum smear and culture results; that is, there was no microbiological evidence of M. tuberculosis after a thorough work-up. Although microbiologically unconfirmed tuberculosis cases are included in official notification statistics (21), these persons are substantially less infectious than smear-positive tuberculosis cases (15).
We isolated the age-specific associations of household exposure from cumulative community exposure by contrasting the infection status of household contacts of smear-positive/culture-positive index cases (SCPIs) and smear-negative/culture-positive index cases (CPIs) against those of persons of the same age who were exposed to a smear-negative/culture-negative index case (NIs). Consistent with previous observations (14–16), we hypothesized that SCPIs are the most infectious, followed by CPIs, and then NIs. Figure 1 illustrates the hypothesized levels of infectiousness from these types of contacts and Figure 2 compares the age-specific prevalence of LTBI among contacts of SCPIs and NIs. Because they were identified via the same passive surveillance process as were SCPIs, NIs are likely to have community exposure profiles more similar to SCPIs than community controls selected via another mechanism, such as random sampling and propensity matching. However, to ensure that our results were not confounded by systematic differences between SCPIs, CPIs, and NIs, all analyses were adjusted for the following factors: 1) household overcrowding, defined as having 3 or more persons per bedroom; 2) index case age, which is likely to provide information on the cumulative exposure of the household; and 3) whether the household has an improved (i.e., metal or concrete) or unimproved (mud or thatch) roof. This reflects both the socioeconomic status and indoor environmental quality of the household. In addition, because transmission risk may scale with household size (22), we adjusted for whether the person lived in a large household. This was defined as 6 or more persons, which corresponds to the 75th percentile of the household size distribution in our sample. For a full analysis of the differences between exposure groups, see Web Appendix 2, Web Table 3, and Web Figures 4–6.
Figure 1.
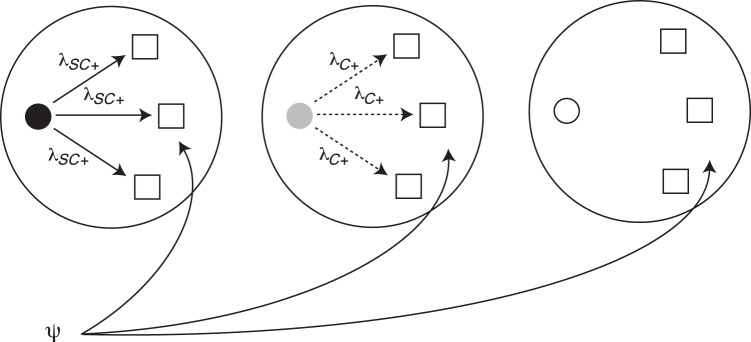
The figure illustrates the different sources of tuberculosis infection in the infection risk model. Smear-positive/culture-positive index cases (black circle) are hypothesized to be the most infectious, followed by smear-negative/culture-positive index cases (gray circle) and then smear-negative/culture-negative index cases (white circle). λSC+ and λC+ indicate the risk of infection for an uninfected household contact (white square) exposed to a smear-positive/culture-positive index case or smear-negative/culture-positive index case, respectively. ψ is the community risk of infection to which all households are subject. The solid arrows indicate a higher hypothesized level of infectiousness than values represented by the dashed arrows. Random intercepts are included in the model at the household and health center level to account for correlated responses within these units.
Figure 2.
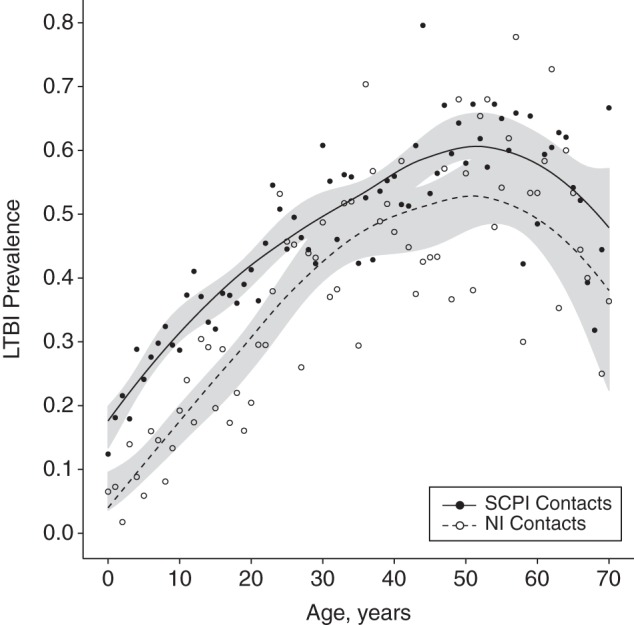
Prevalence of latent tuberculosis infection (LTBI) by age and exposure, Lima, Peru, 2009–2012. The solid dark line shows the smoothed age-specific prevalence of LTBI among persons exposed to a smear-positive/culture-positive index case (SCPI). The dashed line shows the prevalence of LTBI among persons exposed to a smear-negative/culture-negative index case (NI). Filled and empty circles show the raw age-specific prevalence of LTBI for persons exposed to SCPIs and NIs, respectively. Shaded regions indicate 95% confidence intervals for the smoothed prevalence estimates.
Models
Our analysis proceeded in 3 stages. First, we used a finite-mixture model to differentiate between latently infected and uninfected household contacts using the size (in millimeters) of the TST reaction. Second, we fitted a generalized additive mixed logistic regression model to these data to estimate age-specific risk factors for infection. Finally, we used predictions from this model to estimate household and community risks of infection, that is, the probability that an uninfected person would progress to LTBI after a single episode of household exposure or a year of community exposure.
Identifying latently infected persons
LTBI is usually diagnosed after the TST by measuring the diameter of the raised induration at the injection site 48–72 hours after subcutaneous injection of tuberculin. TST results are typically reported as binary outcomes in which indurations with a diameter of 10 mm or greater are considered positive, although a diameter of up to 15 mm may be used in some high-burden contexts (23). This cutoff is meant to minimize error in prediction of LTBI, but its diagnostic utility is not consistent across populations. We used a finite-mixture model fitted to the continuous TST responses of persons exposed to an NI to assign contacts to the latently infected and uninfected classes. To assess the sensitivity of our results to the choice of mixture model, we replicated our analysis using the 10-mm cutoff. A full description of the mixture model and results for the cutoff model are presented in Web Appendix 3, Web Appendix 4, and Web Figures 7–9.
Models to identify risk factors for latent infection
We use a generalized additive mixed model to estimate age-specific risk factors for LTBI. Generalized additive models are semiparametric regression models, similar to generalized linear models, except that they model an outcome as a smooth function of predictors rather than assuming a linear relationship (24). All models were fitted using the gamm4 package in R, version 3.02 (R Foundation for Statistical Computing, Vienna, Austria). The outcome for each person was the value of the LTBI status, yi, assigned by the mixture model from the previous section. We referred to the prevalence of TST-positivity for persons of age a without BCG vaccination who were exposed to an NI as the age-specific intercept for age a. We also estimated age-specific odds ratios for CPI and SCPI exposure and BCG vaccination. Age-specific odds ratios were considered statistically significant if the 95% confidence interval for the association did not overlap the 95% confidence interval of the odds ratio of the corresponding age-specific intercept.
We included random intercepts because our sample was nested at 2 levels. First, persons were nested within 3,120 households, and index cases typically had more than 1 household contact. Each household fell within 1 of 106 different health center catchment areas in Lima, which corresponded to geographic areas of the city with varying average socioeconomic statuses and other tuberculosis risk factors. We accounted for correlated responses that arose from repeated measures of the association of exposure to a specific household index case, as well as unobserved household- and health center–level risks by allowing each household and health center to have a random intercept. We derived confidence intervals for model coefficients and quantities derived from these coefficients using the method described by Marra and Wood (25) and assessed goodness of fit for the ROI model using a posterior predictive check (Web Appendix 5, Web Figures 10 and 11).
Household and community risk of infection
We first calculated the ROIs posed by SCPIs and CPIs to their household contacts. We then estimated the age-specific community-associated ARIs among persons exposed to an NI and contrasted this with household ROIs for SCPIs to estimate the relative risk of infection associated with these 2 types of exposure.
We defined the age-specific household ROI as the probability that an uninfected person of age ω would develop LTBI as a result of contact with a single household case. We denoted the ROI for exposure to an SCPI as λSC+ and the ROI for exposure to a CPI as λC+. Similar to Middelkoop et al. (26), we defined the community ROI (ψ) as the probability that an uninfected person exposed to an NI would become infected over the course of a year, reflecting the assumption that the rate of transmission from NIs within the household is negligible. We characterized household and community ROI using the marginal distributions of the fitted model parameters, setting random intercepts to 0 so that our estimates reflected expected ROIs across all spatial units. For simplicity, we present models in which all persons have received the BCG vaccination, live in an uncrowded household with an improved roof and fewer than 6 persons, and were exposed to an index case who was 30 years old, which was the mean index age in our sample. Because the prevalence of LTBI decreases beyond age 50 years (see Figure 2), we estimated age-specific ROI sonly for those persons younger than 50 years of age.
Excess risk
Excess risk was interpreted as the change in the proportion of the population with LTBI between the condition in which everyone was exposed to an SCPI/CPI and the condition in which no one had such an exposure, expressed as a fraction of the prevalence in the fully exposed condition (27). This provided a measure of the contribution of household transmission to the overall burden of infection in the community for each age group (27). For additional details on the calculation of ROI and excess risk, see Web Appendix 6.
RESULTS
TST mixture model
For uninfected persons with a positive TST result, the mean induration size μE was 5.56 mm and the standard deviation σE was 1.99 mm. For persons with LTBI, the mean and standard deviation of the underlying Gaussian distribution for the lognormal component were 2.5 and 0.26, respectively, with a mean of 12.6 mm and standard deviation of 3.3 mm for the resulting lognormal distribution. Figure 3 illustrates the fit of the mixture model to the TST responses of the 1,356 persons with an induration greater than 0 mm who were exposed to an NI.
Figure 3.
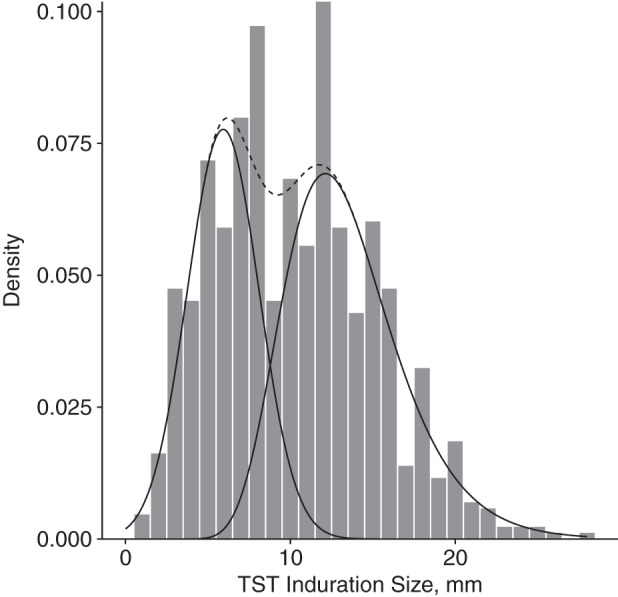
Tuberculin skin test (TST) responses of persons exposed to a smear-negative/culture-negative index case in the fitted mixture model, Lima, Peru, 2009–2012. Solid lines indicate the fitted densities for the Gaussian mixture component for exposed noninfected persons (mean induration size = 5.56; standard deviation, 1.99; left) and the lognormal mixture component for persons with LTBI (mean induration size = 2.55, standard deviation for the lognormal mixture component, 0.26; right). The dashed line illustrates the sum of the fitted densities from both mixture components.
Risk factor of infection model
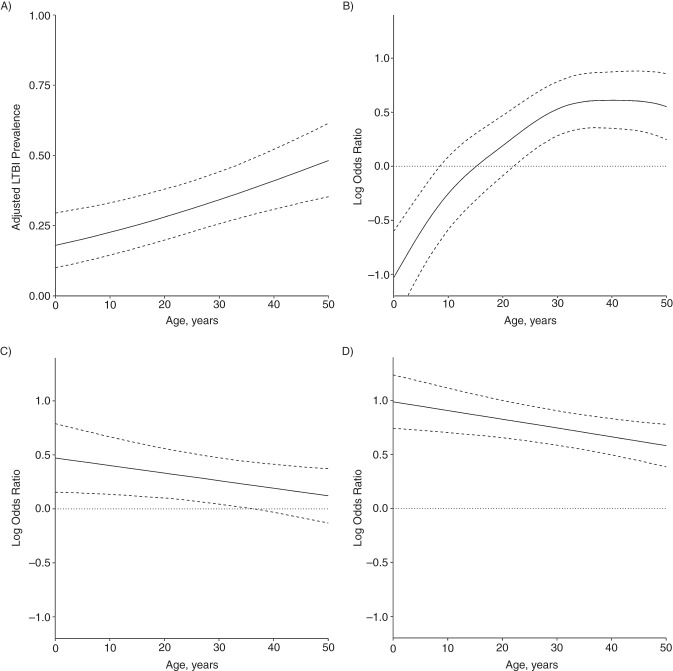
Because we modelled risk factors using smooth functions, we present parameter estimates graphically in Figure 4. Coefficients are expressed as log odds ratios relative to the age-specific intercept (Figure 4A). Solid lines in each panel illustrate point estimates by age, and the dashed lines are 95% confidence intervals at each point. If the confidence intervals for an age fall on both sides of the dotted line at zero, the association is considered nonsignificant at this age. An alternate model including the age-specific association of sex in addition to the covariates discussed here was estimated. This association was nonsignificant at all ages and therefore is omitted from the final model. We note that the odds ratio associated with BCG vaccination (Figure 4B), which shows a diminished risk of LTBI associated with BCG vaccination among small children, likely reflects the high-risk population from which our sample was drawn rather than population-level associations of BCG with TST reactivity. For the potential impact of social and environmental factors, see Web Appendix 2.
Figure 4.
Adjusted prevalence of latent tuberculosis infection (LTBI) and age-specific log odds ratios for Bacillus Calmette–Guérin vaccination and exposure to a smear-positive/culture-positive index case or smear-negative/culture-positive index case, Lima, Peru, 2009–2012. Solid lines in each panel are point estimates; dashed lines are 95% confidence intervals. Confidence intervals are interpreted over the entire age range, that is, the highest value is the upper limit in the trend by age. A) Adjusted age-specific prevalence of latent tuberculosis infection among persons exposed to a smear-negative/culture-negative index case who have not received Bacillus Calmette–Guérin vaccination (the age-specific intercept). B) Age-specific log odds ratios of tuberculin skin test–positivity associated with Bacillus Calmette–Guérin vaccination, relative to the baseline prevalence in A. C–D) Age-specific log odds ratios for smear-negative/culture-positive index case and smear-positive/culture-positive index case exposure relative to the age-specific intercept (A). Dotted lines in B–D are provided as a guide for assessing statistical significance, which is assessed in terms of the difference in predicted prevalence from the age-specific intercept.
Risk of infection
Household ROI
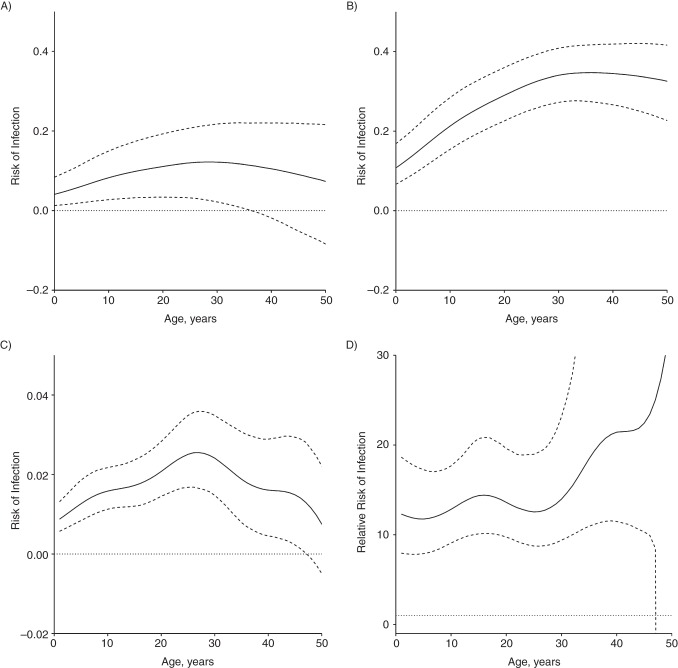
Figure 5A illustrates the age-specific household ROI from a CPI, which is 0.04 (95% confidence interval (CI): 0.01, 0.09) for children younger than 1 year of age and increases to 0.11 before becoming nonsignificant at age 37 years. Figure 5B illustrates age-specific household ROI from a SCPI. For children younger than 1 year of age, the ROI for contact with a SCPI is 0.11 (95% CI: 0.07, 0.17). This association grows to 0.35 at age 35 years (95% CI: 0.27, 0.41) before declining and becoming nonsignificant.
Figure 5.
Household and community risks of infection, Lima, Peru, 2009–2012. A–B) Age-specific risk of infection for a household contact exposed to a culture-positive index case (A) or smear-positive/culture-positive index case (B). C) Change in annual risk of infection from community contact. D) Risk ratio comparing age-specific risk of infection from a single episode of household exposure to a smear-positive/culture-positive index case to community annual risk of infection for an uninfected person of the same age.
Community ARI
Figure 5C illustrates the age-specific community ARI, which increases from 0.009 (95% CI: 0.006, 0.013) at 1 year of age to 0.023 (95% CI: 0.016, 0.032) at 27 years of age, after which it declines and then become nonsignificant at 48 years of age. Figure 5D illustrates SCPI household ROI relative to community ARI at each age. For 1-year-old children, the risk posed by an episode of SCPI exposure was roughly 12 times greater than the risk from a year of exposure in the community (95% CI: 7.9, 15.6); this association increased with age, before becoming nonsignificant at 47 years of age.
Excess risk of infection due to household exposure
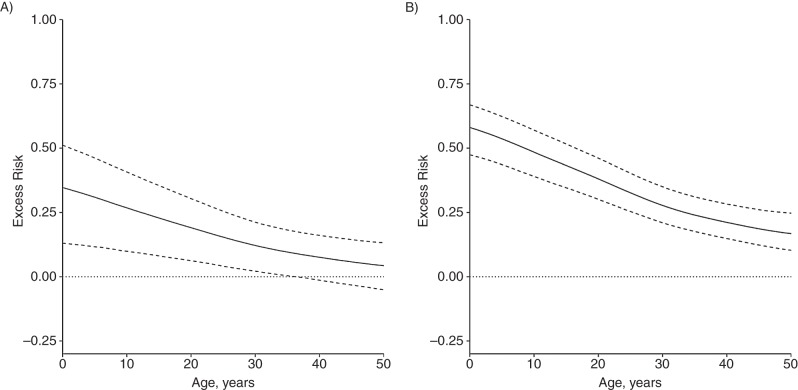
Figure 6 illustrates the excess risk associated with exposure to a CPI (Figure 6A) or SCPI (Figure 6B). For children younger than 1 year of age, the excess risk associated with CPI exposure was 34% (95% CI: 13, 51) of the total LTBI prevalence among exposed children; it was 27% (95% CI: 10, 40) among 10-year-old children and 22% (95% CI: 8, 35) among 15-year-old adolescents. It became nonsignificant at 37 years of age. For SCPI exposure, the excess risk was 58% (95% CI: 47, 66) of LTBI prevalence among exposed children younger than 1 year of age, 48% (95% CI: 39, 57) among 10-year-old children, and 44% (95% CI: 34, 51) among 15-year-old adolescents, and it remained significant among older age groups. These results show that although both community and household ROIs increase with age, a larger fraction of the total number of infections among younger household contacts is explained by household exposure, because younger persons are less likely to have been previously infected at home or in the community.
Figure 6.
Excess risk associated with household exposure to culture-positive cases and smear-positive/culture-positive cases, Lima, Peru, 2009–2012. Excess risk is measured as the proportion reduction in prevalence between the condition in which all persons are exposed to a culture-positive case (A) or smear-positive/culture-positive case (B) and the condition in which no persons are exposed. The solid line shows the point estimate as a function of age and the dashed lines show 95% confidence intervals. The dotted line is a guide for assessing statistical significance.
DISCUSSION
Our results suggest that the age-specific ROIs from contact with an SCPI and from community exposure increase from birth until approximately 30 years of age. Although prior studies have compared tuberculosis prevalence among persons with and without household exposure (19) and quantified the age-specific annual risk of tuberculosis infection in the community (26), none has addressed the age-specific household ROI. Our results show that comparing household and community ROIs provides a better understanding of age-specific risks in both contexts. For example, the similar peaks in community and household infection risk during young adulthood suggest a potential biological basis of vulnerability in young adults. If the increasing risk of infection were due solely to having a higher number of social contacts in the community during young adulthood, as suggested by Middelkoop et al. (26), we would have expected a prominent peak in community ARI and a constant household ROI across all age groups.
Importantly, our results also demonstrate that, despite the lower ROI for younger contacts of SCPIs, the burden of new infections associated with household exposure may still fall disproportionately on children and young adults because they are less likely to have been previously infected. Taken in conjunction with recent findings that household-based contact interventions that include treatment of latent infections may prevent progression to disease in young contacts of index patients in settings with a high tuberculosis burden (11), these results support current guidelines for preventive therapy in children younger than 5 years of age (8) and suggest that expanding the use of preventive therapy among childhood contacts into their late teens is appropriate. This suggestion of expanded age eligibility for preventive therapy is consistent with a recommendation suggested in a recent systematic review of contact-tracing studies (6).
It is important to highlight potential limitations of our findings. Nyboe (28) showed that transmission risks estimated using age-prevalence curves are sensitive to changes in community incidence. If tuberculosis incidence across all age groups has changed dramatically over the lifetimes of the persons in our cohort, our estimates of community ROI may be biased. However, because our comparison of community and household ROIs relies only on comparing persons in adjacent age groups, the impact of this bias should be minimal. We chose to present results for persons who had received the BCG vaccine to increase the clinical applicability of these findings to high-burden settings in which BCG vaccination is common. However, the modest relative associations of tuberculosis infection with BCG vaccination and household social and environmental factors among younger age groups as compared with those of SCPI exposure ensure that our conclusions regarding the outsize risk experienced by children and young adults from household exposure are robust. In addition, although we included random intercepts to account for unobserved household and community risks, it is possible that clustering of cases within households or neighborhoods may still result from unobserved genetic or exposure factors. However, our analyses of differences between households with SCPIs and those with NIs, as well as the inclusion of controls for index case attributes, provide confidence that our estimates reflect household transmission risks. It is also possible that some NIs may have taken antibiotics before sputum collection, which may have caused culture conversion in advance of the clinical tuberculosis diagnosis (29). However, this type of misclassification would diminish our estimates of household ROI, suggesting that our qualitative conclusions are robust to this potential association.
Current tests for LTBI provide information about prior infection but do not distinguish between primary infections and reinfections. Consequently, decreasing household ROI among persons older than 35 years of age and decreasing prevalence among persons older than 50 years of age should not be interpreted to mean that these persons are protected against reinfection. Instead, this likely reflects the inability of TST to document reinfection events, which are expected to be more common among older persons, as well as decreasing TST reactivity with age (30, 31). However, these associations are likely to be less pronounced among the younger persons, who are the focus of our policy and practice recommendations. Nonetheless, future studies combining TST data with mechanistic models that account for reinfection, such as the one by Cohen et al. (32), may be useful for dealing with this limitation.
Because the household and community risk of infection have a more mechanistic interpretation than do other measures of relative household and community infection risk (19), our approach provides a blueprint for dynamic epidemiologic models to build on these findings using molecular data that can definitively identify transmission links (33). Such models will be useful for extending our findings to understand the role of household transmission in overall community risk and determining the optimal use of household screening in high-incidence, resource-constrained settings.
Supplementary Material
ACKNOWLEDGMENTS
Author affiliations: Department of Ecology and Evolutionary Biology, Princeton University, Princeton, New Jersey (Jonathan L. Zelner, Bryan T. Grenfell); Fogarty International Center, National Institutes of Health, Bethesda, Maryland (Jonathan L. Zelner, Bryan T. Grenfell); Department of Global Health and Social Medicine, Harvard Medical School, Boston, Massachusetts (Megan B. Murray, Mercedes C. Becerra); Department of Epidemiology, Harvard School of Public Health, Boston, Massachusetts (Megan B. Murray, Ted Cohen); Partners in Health, Boston, Massachusetts (Jerome Galea, Leonid Lecca, Roger Calderon, Rosa Yataco, Carmen Contreras); Socios En Salud, Lima, Peru (Jerome Galea, Leonid Lecca, Roger Calderon, Rosa Yataco, Carmen Contreras); and Division of Global Health Equity, Brigham and Women's Hospital, Boston, Massachusetts (Zibiao Zhang, Ted Cohen).
J.L.Z. and B.T.G. were supported by the Research and Policy for Infectious Disease Dynamics program of the Science and Technology Directorate, Department of Homeland Security and the Fogarty International Center, National Institutes of Health. B.T.G. was funded by the Bill and Melinda Gates Foundation. M.B.M., M.C.B., J.G., L.L., R.C., R.Y., C.C., Z.Z., and T.C. were funded by the National Institutes of Health (grant U19 A1076217).
Conflict of interest: none declared.
REFERENCES
- 1.World Health Organization. Global Tuberculosis Report 2012. Geneva, Switzerland: World Health Organization; 2012. [Google Scholar]
- 2.World Health Organization. Recommendations for Investigating Contacts of Person With Infectious Tuberculosis in Low- and Middle-Income Countries. Geneva, Switzerland: World Health Organization; 2012. [PubMed] [Google Scholar]
- 3.Kranzer K, Afnan-Holmes H, Tomlin K, et al. The benefits to communities and individuals of screening for active tuberculosis disease: a systematic review. Int J Tuberc Lung Dis. 2013;17(4):432–446. doi: 10.5588/ijtld.12.0743. [DOI] [PubMed] [Google Scholar]
- 4.Lönnroth K, Corbett E, Golub J, et al. Systematic screening for active tuberculosis: rationale, definitions and key considerations. Int J Tuberc Lung Dis. 2013;17(3):289–298. doi: 10.5588/ijtld.12.0797. [DOI] [PubMed] [Google Scholar]
- 5.Tuberculosis Coalition for Technical Assistance. International Standards for Tuberculosis Care. The Hague, Netherlands: Tuberculosis Coalition for Technical Assistance; 2006. [Google Scholar]
- 6.Fox GJ, Barry SE, Britton WJ, et al. Contact investigation for tuberculosis: a systematic review and meta-analysis. Eur Respir J. 2013;41(1):140–156. doi: 10.1183/09031936.00070812. [DOI] [PMC free article] [PubMed] [Google Scholar]
- 7.Shapiro AE, Variava E, Rakgokong MH, et al. Community-based targeted case finding for tuberculosis and HIV in household contacts of patients with tuberculosis in South Africa. Am J Respir Crit Care Med. 2012;185(10):1110–1116. doi: 10.1164/rccm.201111-1941OC. [DOI] [PMC free article] [PubMed] [Google Scholar]
- 8.World Health Organization Stop TB Partnership Childhood TB Subgroup. Chapter 4: childhood contact screening and management. Int J Tuberc Lung Dis. 2007;11(1):12–15. [PubMed] [Google Scholar]
- 9.Morrison J, Pai M, Hopewell PC. Tuberculosis and latent tuberculosis infection in close contacts of people with pulmonary tuberculosis in low-income and middle-income countries: a systematic review and meta-analysis. Lancet Infect Dis. 2008;8(6):359–368. doi: 10.1016/S1473-3099(08)70071-9. [DOI] [PubMed] [Google Scholar]
- 10.World Health Organization. The Global Plan to Stop TB: 2011–2015. Geneva, Switzerland: World Health Organization; 2011. [Google Scholar]
- 11.Zelner JL, Murray MB, Becerra MC, et al. Bacillus Calmette-Guérin and isoniazid preventive therapy protect contacts of patients with tuberculosis. Am J Respir Crit Care Med. 2014;189(7):853–859. doi: 10.1164/rccm.201310-1896OC. [DOI] [PMC free article] [PubMed] [Google Scholar]
- 12.Wells WF, Ratcliffe HL, Grumb C. On the mechanics of droplet nuclei infection; quantitative experimental air-borne tuberculosis in rabbits. Am J Hyg. 1948;47(1):11–28. doi: 10.1093/oxfordjournals.aje.a119179. [DOI] [PubMed] [Google Scholar]
- 13.Riley RL. The hazard is relative. Am Rev Respir Dis. 1967;96(4):623–625. doi: 10.1164/arrd.1967.96.4.623. [DOI] [PubMed] [Google Scholar]
- 14.van Geuns HA, Meijer J, Styblo K. Results of contact examination in Rotterdam, 1967–1969. Bull Int Union Tuberc. 1975;50(1):107–121. [PubMed] [Google Scholar]
- 15.Grzybowski S, Barnett GD, Styblo K. Contacts of cases of active pulmonary tuberculosis. Bull Int Union Tuberc. 1975;50(1):90–106. [PubMed] [Google Scholar]
- 16.Shaw JB, Wynn-Williams N. Infectivity of pulmonary tuberculosis in relation to sputum status. Am Rev Tuberc. 1954;69(5):724–732. doi: 10.1164/art.1954.69.5.724. [DOI] [PubMed] [Google Scholar]
- 17.Vidal R, Miravitlles M, Caylà JA, et al. Increased risk of tuberculosis transmission in families with microepidemics. Eur Respir J. 1997;10(6):1327–1331. doi: 10.1183/09031936.97.10061327. [DOI] [PubMed] [Google Scholar]
- 18.Verver S, Warren RM, Munch Z, et al. Proportion of tuberculosis transmission that takes place in households in a high-incidence area. Lancet. 2004;363(9404):212–214. doi: 10.1016/S0140-6736(03)15332-9. [DOI] [PubMed] [Google Scholar]
- 19.Madico G, Gilman RH, Checkley W, et al. Community infection ratio as an indicator for tuberculosis control. Lancet. 1995;345(8947):416–419. doi: 10.1016/s0140-6736(95)90401-8. [DOI] [PubMed] [Google Scholar]
- 20.Floyd S, Ponnighaus JM, Bliss L, et al. BCG scars in northern Malawi: sensitivity and repeatability of scar reading, and factors affecting scar size. Int J Tuberc Lung Dis. 2000;4(12):1133–1142. [PubMed] [Google Scholar]
- 21.World Health Organization. Definitions and Reporting Framework for Tuberculosis – 2013 Revision. Geneva, Switzerland: World Health Organization; 2013. [Google Scholar]
- 22.Uys P, Marais BJ, Johnstone-Robertson S, et al. Transmission elasticity in communities hyperendemic for tuberculosis. Clin Infect Dis. 2011;52(12):1399–1404. doi: 10.1093/cid/cir229. [DOI] [PubMed] [Google Scholar]
- 23.Rose DN, Schechter CB, Adler JJ. Interpretation of the tuberculin skin test. J Gen Intern Med. 1995;10(11):635–642. doi: 10.1007/BF02602749. [DOI] [PubMed] [Google Scholar]
- 24.Hastie TJ, Tibshirani RJ. Generalized Additive Models. New York, NY: Chapman & Hall/CRC; 1990. [Google Scholar]
- 25.Marra G, Wood SN. Coverage properties of confidence intervals for generalized additive model components. Scand J Stat. 2012;39(1):53–74. [Google Scholar]
- 26.Middelkoop K, Bekker L-G, Liang H, et al. Force of tuberculosis infection among adolescents in a high HIV and TB prevalence community: a cross-sectional observation study. BMC Infect Dis. 2011;11:156. doi: 10.1186/1471-2334-11-156. [DOI] [PMC free article] [PubMed] [Google Scholar]
- 27.Suzuki E, Yamamoto E, Tsuda T. On the relations between excess fraction, attributable fraction, and etiologic fraction. Am J Epidemiol. 2012;175(6):567–575. doi: 10.1093/aje/kwr333. [DOI] [PubMed] [Google Scholar]
- 28.Nyboe J. Interpretation of tuberculosis infection age curves. Bull World Health Organ. 1957;17(2):319–339. [PMC free article] [PubMed] [Google Scholar]
- 29.Chen TC, Lu PL, Lin CY, et al. Fluoroquinolones are associated with delayed treatment and resistance in tuberculosis: a systematic review and meta-analysis. Int J Infect Dis. 2011;15(3):e211–e216. doi: 10.1016/j.ijid.2010.11.008. [DOI] [PubMed] [Google Scholar]
- 30.Korzeniewska-Kosela M, Krysl J, Müller N, et al. Tuberculosis in young adults and the elderly. A prospective comparison study. Chest. 1994;106(1):28–32. doi: 10.1378/chest.106.1.28. [DOI] [PubMed] [Google Scholar]
- 31.Battershill JH. Cutaneous testing in the elderly patient with tuberculosis. Chest. 1980;77(2):188–189. doi: 10.1378/chest.77.2.188. [DOI] [PubMed] [Google Scholar]
- 32.Cohen T, Colijn C, Finklea B, et al. Exogenous re-infection and the dynamics of tuberculosis epidemics: local effects in a network model of transmission. J R Soc Interface. 2007;4(14):523–531. doi: 10.1098/rsif.2006.0193. [DOI] [PMC free article] [PubMed] [Google Scholar]
- 33.Roetzer A, Diel R, Kohl TA, et al. Whole genome sequencing versus traditional genotyping for investigation of a Mycobacterium tuberculosis outbreak: a longitudinal molecular epidemiological study. PLoS Med. 2013;10(2):e1001387. doi: 10.1371/journal.pmed.1001387. [DOI] [PMC free article] [PubMed] [Google Scholar]
Associated Data
This section collects any data citations, data availability statements, or supplementary materials included in this article.


