

Abstract
The delineation of the interrelationships between cognitive and physical functioning in older adults is critical to determining pathways to disability. By using longitudinal data from 395 initially high-functioning, community-dwelling older women in Baltimore, Maryland, from the Women's Health and Aging Study II (from 1994 to 2006), we simultaneously assessed associations of cognition with later physical functioning and associations of physical functioning with later cognition. The analysis included measures of global cognition and 2 cognitive domains (executive functioning and memory), as well as 2 measures of physical functioning (a Short Physical Performance Battery and a 4-meter test of usual walking speed). We found the strongest bidirectional associations of memory with physical functioning and less evidence of associations of physical functioning with executive functioning and global cognition. For a 1–standard deviation increase in walking speed, subsequent memory increased by 0.08 standard deviations (95% confidence interval: (0.03, 0.13)). For a 1–standard deviation increase in memory, subsequent walking speed increased by 0.07 standard deviations (95% confidence interval: 0.03, 0.10). Associations were similar in magnitude for models using a Short Physical Performance Battery. We did not find evidence that associations between cognitive and physical functioning varied over time. Our results suggest that cognition, and particularly memory, is associated with subsequent physical functioning and vice versa.
Keywords: aging, cognition, memory, physical functioning, structural equation models
In older adults, poor physical functioning and poor cognition are both associated with higher rates of disability and death (1–5). To fully examine pathways from physical and cognitive declines to disability and death, it is important to understand the interrelationships between cognitive and physical functioning. Epidemiologic studies have found that physical functioning is associated with cognition in older adults (6–13); however, current research has not conclusively determined the nature of the associations between physical and cognitive functioning.
Many epidemiologic studies have examined associations between cognitive and physical functioning on the basis of a priori hypothesized biological relationships. For example, some scientists have found that cognition is a predictor of physical functioning (8, 9, 14), and some have found that physical functioning is a predictor of cognition (15–18). Questions of interest are whether cognitive decline leads to subsequent physical decline, whether physical decline leads to subsequent cognitive decline, or whether the declines in function mutually influence one another. These pathways are driven by different underlying biological hypotheses that describe how cognition and physical functioning are interrelated. One hypothesis suggests that declines in physical activity lead to depleted cognitive reserves (19). Other researchers have found that frailty, which correlates with physical functioning, is related to subsequent cognitive decline (20). In older adults, cognitive monitoring (specifically, the ability to self-assess and attain feedback about one's physical performance) may be important for physical functioning, and declines in cognition may therefore lead to declines in physical functioning (14). The associations may be driven by central nervous system changes that first manifest in a decline of physical functioning and later manifest in cognitive decline (18, 21–24). Chronic inflammation, mental illness, or underlying pathology may also drive both cognitive and physical declines simultaneously (20).
No longitudinal studies have been conducted to determine conclusively whether the associations between cognitive and physical functioning are equally strong in both directions. Understanding the relationship between cognitive and physical functioning will improve our understanding of disability pathways, inform prediction of functional difficulty and disability, and possibly contribute to the development of targeted interventions to prevent or delay the progression to disability. We hypothesized that associations between cognitive and physical functioning are bidirectional, that they change over time, and that they vary by cognitive domain. To assess bidirectional associations between cognitive and physical functioning, we used data from the Women's Health and Aging Study II (WHAS II), a prospective study of community-dwelling women in Baltimore, Maryland. We estimated associations for global cognition and 2 domains important to functional independence and dementia: executive functioning and memory. We used a Short Physical Performance Battery (SPPB) and a test of usual walking speed to measure physical functioning.
METHODS
Study population
The WHAS II was a prospective study of 436 well-functioning, English-speaking, community-dwelling women in eastern Baltimore, Maryland. At baseline, this cohort was 70–79 years of age, had a mean Mini–Mental State Examination (MMSE) score above 23 points, and had difficulty in no more than 1 functional domain, including upper extremity function, mobility and exercise tolerance, higher-functioning tasks (a subset of instrumental activities of daily living, not including heavy housework), and basic self-care tasks (a subset of non–mobility-dependent activities of daily living) (12, 25, 26). Further details about the study population have been previously published (12, 25, 26).
We used observations at baseline (visit 1) and at 5 follow-up visits (visits 2–6) from the WHAS II for a total observation period of approximately 9 years. Study visits generally occurred at 1.5-year intervals, though visits 3 and 4 were separated by 3 years. We excluded participants who did not have at least 1 cognitive examination score across 6 visits, reducing our sample to 395 women (25).
Study outcomes
We modeled associations between physical functioning and 2 domains of cognition: executive functioning, measured by the Trail Making Test–Part B (TMT-B), and memory, measured by the Hopkins Verbal Learning Test–immediate recall (HVLT-IR) and the Hopkins Verbal Learning Test–delayed recall (HVLT-DR). The TMT-B is a timed test in which participants connect numbers and letters in ascending alphanumeric sequence (27). For the HVLT-IR and HVLT-DR tasks, participants must correctly recall lists of words (36 and 12 words, respectively) (28, 29). The HVLT-DR includes a delay of approximately 20 minutes before recall, which is filled with tasks unrelated to the HVLT-DR. We used the MMSE as a measure of global cognition (30). One limitation of using the HVLT-IR, HVLT-DR, and MMSE in a well-functioning cohort at baseline is that many study participants score close to the maximum, whereas the TMT-B may better discriminate between 2 participants who have high, but different, cognitive functioning.
To assess physical functioning, we used 2 measures: usual 4-meter walking speed (in meters per second) and the SPPB (31). For the SPPB, each participant scores from 0 to 4 points on 3 tasks (walking speed, chair stands, and balance) for a composite score ranging from 0 to 12 points, with a higher score indicating better functioning. The SPPB includes a wider range of physical tasks compared with the measure of walking speed.
Data analysis
We estimated the dynamic, bidirectional associations between cognition and physical functioning by using structural equation models. Compared with traditional modeling techniques, they can model the short-term, possibly dynamic, associations between 2 longitudinal outcomes. Structural equation models estimate hypothesized causal associations between observed variables. These causal associations are separate from causal inference, which is not addressed in this study but is an important area for future research. Figure 1 shows 4 possible true causal associations between physical functioning (xt) and cognitive functioning (yt): bidirectional effects of cognition on physical functioning and vice versa (Figure 1A); bidirectional effects, but with a stronger effect of cognition on physical functioning (Figure 1B); only an effect of cognition on physical functioning (Figure 1C); and only an effect of cognition on physical functioning with changing effect magnitudes to allow for possible time-varying effects (Figure 1D).
Figure 1.
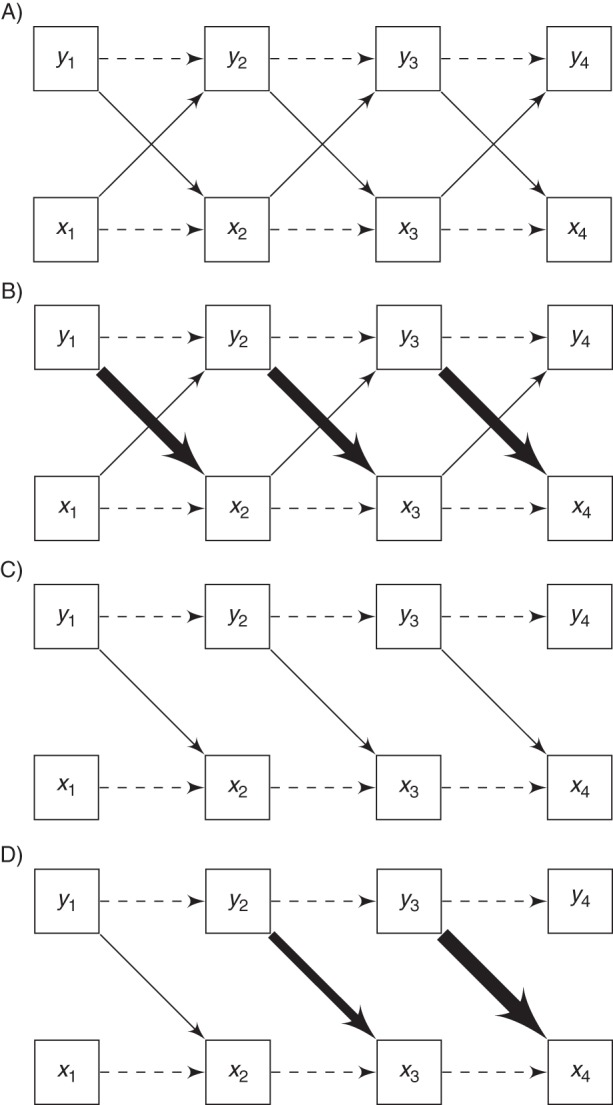
Four examples of cross-lagged associations. Arrows between physical functioning (xt) and cognitive functioning (yt) represent causal effects. A) Equal effects of physical functioning (xt) on cognitive functioning (yt) and vice versa, over time. B) Stronger effects from yt to xt, as depicted by heavier lines. C) Only effects from yt to xt and no effects from xt to yt. D) Only effects from yt to xt with effects increasing in magnitude over time. The autoregressive effects of xt−1 on xt and yt−1 on yt are also shown as dashed lines.
We fit the following 8 models: 1) TMT-B score and walking speed, 2) TMT-B score and SPPB score, 3) HVLT-IR score and walking speed, 4) HVLT-IR score and SPPB score, 5) HVLT-DR score and walking speed, 6) HVLT-DR score and SPPB score, 7) MMSE score and walking speed, and 8) MMSE score and SPPB score. We modeled autoregressive associations (e.g., the association between previous-visit cognition (y2) and current-visit cognition (y3)), controlling for covariates (Figure 1A). We also modeled cross-lagged associations (e.g., the association between previous-visit cognition (y1) and current-visit physical functioning (x2)), controlling for covariates. We included all associations at a lag of 1 visit on the basis of exploratory data analysis. Because life events that cannot be predicted by previous measures of functioning (e.g., fall-related injuries), but that may affect measures of current functioning may occur between visits, we allowed the residuals for cognitive and physical functioning to be correlated at each visit. Similar models have been applied in other fields to assess bidirectional, longitudinal associations (32, 33).
We included the covariates of age, race (white vs. nonwhite), years of education, score on the 30-item Geriatric Depression Scale (GDS) (34), visual impairment, and number of chronic diseases. We also incorporated a measure of psychomotor speed (i.e., the Trail Making Test–Part A (TMT-A)) as a time-varying covariate in models with the TMT-B to adjust for speed on the executive functioning component of the TMT-B (35). Additionally, we controlled for years since baseline measurement at each visit to adjust for the impact of aging (36).
For models with TMT-B score, both TMT-A score and TMT-B score were rescaled from “seconds to complete the examination” to “number of lines connected per minute,” so that higher scores on all longitudinal measures represented better performance. The distributions of HVLT-DR scores at each visit were left-skewed, so models were fit using the square of HVLT-DR score. Each functional measurement at each visit was standardized using baseline means and standard deviations to facilitate comparisons between visits and across measures.
To reduce the amount of missing data, we imputed missing values for the TMT-A using the MI procedure in SAS, version 9.0, software (SAS Institute, Inc., Cary, North Carolina). In the multiple imputation model for TMT-A, we included baseline covariates of years of education, age, race, GDS score, visual impairment, and number of chronic diseases. The structural equation models were fit with Mplus software (37), which computes the maximum likelihood estimates for all parameters. For the imputed data sets with TMT-A score, MPlus computes the maximum likelihood estimates for each imputed data set and then combines results across data sets. We used likelihood ratio tests to assess whether cross-lagged and autoregressive associations were the same across time to determine whether associations were dynamic.
Sensitivity analysis
To distinguish between pathological versus nonpathological aging or death-related characteristics of aging, we compared our results with those of models excluding persons diagnosed with dementia and excluding visits of persons who died within 6 months of a visit. We refit models using persons with complete data for all visits to assess the impact on our results of those lost to follow-up. We also refit models with SPPB, TMT-B, or MMSE score using censored Tobit regression (38) to account for “ceiling” and “floor” effects, because many participants scored the maximum on the SPPB or MMSE (12 or 30 points, respectively), and some participants did not complete the TMT-B within the allotted 420 seconds. We also compared cross-lagged associations between our models with autoregressive associations with models allowing residual correlations across time (36).
RESULTS
Summary statistics
We analyzed 395 (90.6%) of 436 women from the WHAS II who had cognitive measurements at baseline (visit 1) and at least 1 follow-up visit (visits 2–6) (25). Compared with our sample, the 41 women excluded from this analysis were more likely to be nonwhite (P < 0.01) and less educated (P = 0.03). On average, our sample was 73.9 (standard deviation (SD), 2.8) years of age, had 12.6 (SD, 3.3) years of education, and scored 4.02 (SD, 3.84) points on the GDS at baseline. The sample was primarily white (n = 327, 82.8%); 44.1% (n = 174) had more than 1 chronic disease; and 81.3% (n = 321) had been told by doctors that they had vision problems. We imputed the GDS score for 1 person who was missing GDS data at baseline. Table 1 shows the data summary of the longitudinal study outcomes at each visit. SPPB scores could not be computed for visit 4 because chair stands were not performed. In this sample, average functioning in each longitudinal measure declined over the course of the study.
Table 1.
Summary Statistics for Longitudinal Functional Measures From the Women's Health and Aging Study II, Baltimore, Maryland, 1994–2006a
| Visit No., by Measure | No. of Measurements | Mean (SD) | Range |
|---|---|---|---|
| HVLT–delayed recall, no. of wordsb |
|||
| 1 | 371 | 8.20 (2.64) | 0–12 |
| 2 | 373 | 8.02 (2.72) | 0–12 |
| 3 | 372 | 8.06 (2.91) | 0–12 |
| 4 | 300 | 7.35 (3.04) | 0–12 |
| 5 | 271 | 7.30 (3.19) | 0–12 |
| 6 | 239 | 7.10 (3.46) | 0–12 |
| HVLT–immediate recall, no. of wordsc |
|||
| 1 | 381 | 22.84 (5.02) | 7–35 |
| 2 | 373 | 22.52 (5.17) | 7–34 |
| 3 | 371 | 23.04 (5.83) | 7–34 |
| 4 | 301 | 21.53 (5.86) | 2–35 |
| 5 | 271 | 21.20 (5.62) | 6–36 |
| 6 | 241 | 21.85 (6.60) | 5–34 |
| MMSE score | |||
| 1 | 387 | 28.24 (1.73) | 22–30 |
| 2 | 372 | 28.18 (1.98) | 21–30 |
| 3 | 382 | 27.41 (2.56) | 17–30 |
| 4 | 319 | 27.75 (2.67) | 9–30 |
| 5 | 285 | 27.44 (2.81) | 17–30 |
| 6 | 272 | 27.08 (3.34) | 5–30 |
| SPPB score | |||
| 1 | 395 | 9.81 (1.71) | 2–12 |
| 2 | 376 | 9.74 (2.13) | 0–12 |
| 3 | 374 | 9.18 (2.23) | 2–12 |
| 5 | 273 | 8.27 (2.82) | 1–12 |
| 6 | 242 | 7.12 (2.84) | 1–12 |
| TMT–Part A, seconds to complete |
|||
| 1 | 366 | 45.95 (19.25) | 17.0–153.2 |
| 2 | 370 | 48.02 (22.33) | 20.9–240 |
| 3 | 371 | 52.62 (31.91) | 18.8–240 |
| 4 | 300 | 56.14 (32.50) | 19.0–240 |
| 5 | 270 | 58.80 (38.53) | 15.9–240 |
| 6 | 239 | 60.23 (35.38) | 18.1–240 |
| TMT–Part B, seconds to complete |
|||
| 1 | 364 | 127.53 (70.42) | 44.0–420 |
| 2 | 367 | 138.67 (87.64) | 35.5–420 |
| 3 | 371 | 165.46 (104.17) | 33.6–420 |
| 4 | 293 | 177.69 (104.62) | 43.7–420 |
| 5 | 269 | 192.47 (115.11) | 50.6–420 |
| 6 | 238 | 194.84 (112.42) | 52.0–420 |
| Walking speed, m/second |
|||
| 1 | 391 | 1.01 (0.27) | 0.42–2.11 |
| 2 | 371 | 0.93 (0.19) | 0.36–2.00 |
| 3 | 373 | 0.90 (0.22) | 0.06–1.67 |
| 4 | 300 | 0.85 (0.24) | 0.07–1.90 |
| 5 | 270 | 0.83 (0.23) | 0.18–1.54 |
| 6 | 239 | 0.80 (0.24) | 0.11–1.48 |
Abbreviations: HVLT, Hopkins Verbal Learning Test; MMSE, Mini–Mental State Examination; SPPB, Short Physical Performance Battery; TMT, Trail Making Test.
a Adapted from the work of Carlson et al. (25).
b Out of a total of 12 words.
c Out of a total of 36 words.
Structural equation models
The coefficients and standard errors for the cross-lagged associations are shown in Tables 2 and 3. Because we did not find evidence that cross-lagged associations varied by visit, we restricted these associations to be the same across visits. Results from the unrestricted models can be found in Web Tables 1 and 2, available at http://aje.oxfordjournals.org/.
Table 2.
Cross-Lagged Associations for Cognitive Functioning From the Women's Health and Aging Study II, Baltimore, Maryland, 1994–2006
| Model | Outcome at Visit t | Covariate at Visit t − 1 | Standard Deviationsa |
Units of Measurement |
|||
|---|---|---|---|---|---|---|---|
| Estimate | 95% CI | Estimate | 95% CI | Units | |||
| 1 | TMT-B score | Walking speed | 0.03 | −0.02, 0.07 | 0.16 | −0.11, 0.43 | Line connections |
| 2 | TMT-B score | SPPB score | 0.02 | −0.01, 0.05 | 0.11 | −0.08, 0.30 | Line connections |
| 3 | HVLT-IR score | Walking speed | 0.08 | 0.03, 0.13 | 0.40 | 0.13, 0.67 | Words |
| 4 | HVLT-IR score | SPPB score | 0.07 | 0.03, 0.11 | 0.35 | 0.15, 0.55 | Words |
| 5 | HVLT-DR score squared | Walking speed | 0.03 | −0.01, 0.08 | 1.24 | −0.54, 3.01 | Words squared |
| 6 | HVLT-DR score squared | SPPB score | 0.04 | 0.00, 0.07 | 1.39 | 0.08, 2.70 | Words squared |
| 7 | MMSE score | Walking speed | 0.06 | −0.03, 0.15 | 0.11 | −0.05, 0.27 | Questions answered correctly |
| 8 | MMSE score | SPPB score | 0.05 | −0.01, 0.12 | 0.09 | −0.02, 0.20 | Questions answered correctly |
Abbreviations: CI, confidence interval; HVLT-DR, Hopkins Verbal Learning Test–delayed recall; HVLT-IR, Hopkins Verbal Learning Test–immediate recall; MMSE, Mini–Mental State Examination; SPPB, Short Physical Performance Battery; TMT-B, Trail Making Test–Part B.
a Results are standardized as the increase in baseline standard deviations of cognitive functioning at visit t for a 1–baseline standard deviation increase in physical functioning at visit t − 1.
Table 3.
Cross-Lagged Associations for Physical Functioning From the Women's Health and Aging Study II, Baltimore, Maryland, 1994–2006
| Model | Outcome at Visit t | Covariate at Visit t − 1 | Standard Deviationsa |
Units of Measurement |
|||
|---|---|---|---|---|---|---|---|
| Estimate | 95% CI | Estimate | 95% CI | Units | |||
| 1 | Walking speed | TMT-B score | 0.02 | −0.02, 0.07 | 0.01 | −0.01, 0.02 | M/second |
| 3 | Walking speed | HVLT-IR score | 0.07 | 0.03, 0.10 | 0.02 | 0.01, 0.03 | M/second |
| 5 | Walking speed | HVLT-DR score squared | 0.06 | 0.02, 0.09 | 0.02 | 0.01, 0.03 | M/second |
| 7 | Walking speed | MMSE score | 0.05 | 0.02, 0.08 | 0.01 | 0.01, 0.02 | M/second |
| 2 | SPPB score | TMT-B score | 0.02 | −0.05, 0.10 | 0.04 | −0.09, 0.16 | Points |
| 4 | SPPB score | HVLT-IR score | 0.12 | 0.06, 0.18 | 0.20 | 0.10, 0.31 | Points |
| 6 | SPPB score | HVLT-DR score squared | 0.06 | 0.00, 0.13 | 0.11 | 0.00, 0.22 | Points |
| 8 | SPPB score | MMSE score | 0.06 | 0.00, 0.12 | 0.10 | 0.00, 0.20 | Points |
Abbreviations: CI, confidence interval; HVLT-DR, Hopkins Verbal Learning Test–delayed recall; HVLT-IR, Hopkins Verbal Learning Test–immediate recall; MMSE, Mini–Mental State Examination; SPPB, Short Physical Performance Battery; TMT-B, Trail Making Test–Part B.
a Results are standardized as the increase in baseline standard deviations of physical functioning at visit t for a 1–baseline standard deviation increase in cognitive functioning at visit t − 1.
Table 2 shows the estimated associations between physical functioning and subsequent cognition for all 8 models. Standardized coefficients represent the expected change in baseline standard deviation of current-visit cognition for a 1–baseline standard deviation increase in previous-visit physical functioning. We found some evidence of associations of physical functioning at visit t − 1 with memory at visit t. For a 1–standard deviation increase in walking speed, subsequent HVLT-IR score increased by 0.08 standard deviations (95% confidence interval (CI): 0.03, 0.13) and subsequent (HVLT-DR)2 increased by 0.03 standard deviations (95% CI: −0.01, 0.08). The associations for executive functioning and global cognition were similar in magnitude but were not statistically significant. The estimated associations using previous-visit SPPB scores were similar to those using previous-visit walking speeds.
The estimated associations between previous-visit cognition and current-visit physical functioning are shown in Table 3. Models using memory as the cognitive functioning measure had the strongest associations with subsequent physical functioning. Walking speed at visit t increased by 0.07 standard deviations (95% CI: 0.03, 0.10) for a 1–standard deviation increase in HVLT-IR score at visit t − 1 and 0.06 standard deviations (95% CI: 0.02, 0.09) for a 1–standard deviation increase in (HVLT-DR)2 at visit t − 1. Global cognition was also associated with walking speed, which increased by 0.05 standard deviations (95% CI: 0.02, 0.08) for a 1–standard deviation increase in MMSE score. We did not find that TMT-B score was associated with subsequent walking speed. Models with SPPB scores had cross-lagged associations similar to those of models with walking speeds. Using likelihood ratio tests, we did not find that standardized cross-lagged associations for cognition (Table 2) were significantly different from those for physical functioning (Table 3). We did not find that concurrent cognitive and physical functioning were correlated given covariates and previous functioning.
Figures 2 and 3 depict the autoregressive associations for cognition and physical functioning, respectively. These associations are interpreted as the increase in each functional measure at visit t for an increase in the same functional measure at visit t − 1, where the units are baseline standard deviations. Because all models include time since baseline visit, these autoregressive associations can be interpreted as the latent propensity for having higher or lower functioning after the impact of aging has been removed. Across all models, autoregressive associations were positive and larger in magnitude than cross-lagged associations and were statistically significantly different from 0.
Figure 2.

Autoregressive associations for cognitive functioning from the Women's Health and Aging Study II, Baltimore, Maryland, 1994–2006, for A) the Trail Making Test–Part B (TMT-B) (i.e., the change in TMT-B score at visit t corresponding to an increase in TMT-B score at visit t – 1); B) the Hopkins Verbal Learning Test–immediate recall (HVLT-IR); C) the Hopkins Verbal Learning Test–delayed recall squared (HVLT-DR)2; and D) the Mini–Mental State Examination (MMSE). Results are shown for models adjusting for walking speed (WS) and a Short Physical Performance Battery (SPPB). The units for each plot are standard deviations at baseline. Bars, 95% confidence intervals.
Figure 3.
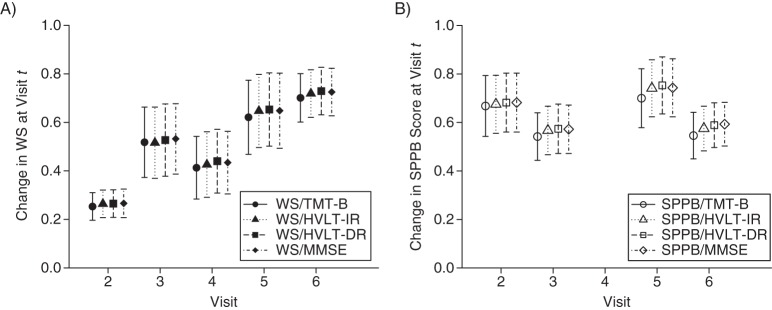
Autoregressive associations for physical functioning from the Women's Health and Aging Study II, Baltimore, Maryland, 1994–2006, for A) walking speed (WS) (i.e., the change in WS at visit t corresponding to an increase in WS at visit t – 1) and B) the Short Physical Performance Battery (SPPB). Results are shown for the Trail Making Test–Part B (TMT-B), the Hopkins Verbal Learning Test–immediate recall (HVLT-IR), the Hopkins Verbal Learning Test–delayed recall squared (HVLT-DR)2, and the Mini–Mental State Examination (MMSE). The units for each plot are standard deviations at baseline. Bars, 95% confidence intervals.
Trends in autoregressive associations across visits indicate whether the influence of each function on itself varies over time. Decreasing autoregressive associations might indicate that functioning becomes more influenced by other factors, such as poorer overall health. Using likelihood ratio tests, we found that autoregressive associations for TMT-B score decreased across visits in both models with walking speed (P < 0.01) and SPPB score (P < 0.01). Autoregressive associations for HVLT-IR score were larger at visit 6 (for walking speed, P < 0.01; for SPPB score, P = 0.01). For models with HVLT-DR score, autoregressive associations were also larger at visit 6, but the associations across visits were not statistically different. Autoregressive associations for MMSE score increased over time (for walking speed, P = 0.02; for SPPB score, P = 0.01). The autoregressive associations for walking speed increased across visits (all P < 0.01). For SPPB score, autoregressive associations did not differ significantly across visits. Comparisons between autoregressive associations for each outcome should be made with caution because the time separating visits 3 and 4 (or visits 3 and 5 for SPPB score) is greater than the time separating other visits.
Sensitivity analysis
We found that our results were qualitatively unchanged when excluding persons with any missing visits (n = 203), those later diagnosed with dementia (n = 102), or those who died within 6 months of the visit (n = 14). Accounting for censoring in the SPPB, TMT-B, and MMSE using censored Tobit regression did not substantially change our results. We did not find evidence that cross-lagged associations differed between models with autoregressive associations and models with residual correlations over time.
DISCUSSION
We found that short-term associations between physical functioning and subsequent cognition were similar in magnitude to associations between cognition and subsequent physical functioning. These associations did not differ substantially by physical functioning measure and were strongest for memory and weaker for executive functioning and global cognition. Our findings suggest that declines in memory may be lessened by efforts to preserve physical functioning and vice versa. We found that the associations between cognitive and physical functioning were stable over a fairly long, 9-year interval. To our knowledge, this is the first study to simultaneously estimate the longitudinal bidirectional associations between cognitive and physical functioning.
Previous studies have used regression modeling to estimate associations between cognitive and physical functioning assuming 1 of 2 hypotheses: 1) physical functioning predicts cognition, or 2) cognition predicts physical functioning. Studies using cross-sectional models have found that physical functioning predicts cognition (22); others have found that baseline physical functioning predicts cognitive change (11, 16, 17); and others have applied mixed models to longitudinal data, which estimate long-term associations that account for the within-person correlation over time (18). However, similar studies have found associations between cognitive and physical functioning in the reverse direction (6, 8–10). One meta-analysis found that physical functioning was a more consistent predictor of cognitive change than vice versa (13). Mielke et al. (15) found that the association between baseline gait speed and cognitive decline was stronger than the reverse association. In contrast, Atkinson et al. (14) found that global cognition was related to physical decline but not vice versa. Our results may differ from those of previous studies because we used different measures of physical and cognitive functioning. In addition, although a mixed modeling framework can capture how 1 function affects another, these models do not allow simultaneous modeling of bidirectional, dynamic relationships. We modeled changes in cognitive and physical functioning as cooccurring processes that affect each other over time and found that associations existed in both directions.
Although global cognition has been related to physical functioning (7, 9, 10), recent studies suggest that different domains of cognition are associated with physical functioning. Rosano et al. (22) found that gait speed and strength were more associated with executive functioning than global cognition, and Soumaré et al. (9) found that slower walking speed had a larger estimated association with psychomotor speed than with verbal fluency, executive functioning, visual memory, or global cognition. Mielke et al. (15) found strong associations of usual gait speed with declines in executive functioning, memory, language, and visuospatial and global cognition. In our study, we found larger associations of physical functioning with memory than with global cognition or executive functioning.
The bidirectional associations between physical functioning and memory could be explained in part by mediation by physical activity. Animal models have shown that physical activity, possibly measured indirectly by walking speed, upregulates brain-derived neurotrophic factor, which leads to stimulation of the dentate gyrus in the hippocampus, which is the region important to memory (39, 40). In humans, recent data have shown that physical activity influences hippocampal volume, which is associated with changes in memory (41, 42). Physical activity may affect cognition in other ways, including shifts in the cardiovascular profile, cardiovascular fitness, and cerebral blood flow and through environmental enrichment and spatial navigation (43). Decreased physical activity may lead to physical deconditioning and poorer physical functioning. We found stronger evidence of an association between physical functioning and memory compared with executive functioning. However, physical activity also affects the prefrontal cortex, an area of the brain connected to executive functioning (43), which supports an association between executive functioning and physical functioning.
The estimated autoregressive associations were positive and larger in magnitude than cross-lagged associations. For walking speed, the autoregressive associations increased across visits, indicating a possible floor effect, whereas for the SPPB, autoregressive associations were fairly constant across visits. Because the SPPB incorporates walking speed along with other measures of physical functioning, it may capture a greater range of functioning than walking speed. The autoregressive trends across visits in the HVLT-IR, HVLT-DR, and MMSE may reflect individual-level floor effects in memory and global cognition in the oldest adults. Increasing influence from other age-associated conditions, such as sensory impairments and multiple morbidities, may contribute to the decrease in autoregressive associations for the TMT-B over time. Therefore, the clinical utility of individual-level tracking of changes in physical and cognitive functioning over time is likely to vary by measures and/or domains of functioning, as well as by the stage of the disablement process.
The WHAS II is a study of the initially most high-functioning two-thirds of women, and our results may not be generalizable to other populations. However, starting with an impairment-free cohort allowed us to better capture natural, dynamic declines in functioning rather than progression in an impaired cohort. For studies of baseline functioning predicting functional change, the magnitude of associations may depend on how functionally impaired the cohort is at baseline, which may drive differences in findings between studies.
As with most studies of aging populations, our study had substantial loss to follow-up over time. In a sensitivity analysis, we did not find evidence that our results were sensitive to dropout. However, our results may still be driven by a healthier subset of the original sample, particularly at later visits. We included baseline visual impairment as a covariate in our models; however, we may not have completely eliminated confounding, because visual impairment may change over time.
The simplest model assumes that cognitive and physical functioning are interrelated in the same way for all women; however, it is possible that pathways differ for subgroups of women. For an older woman without impaired cognitive or physical functioning, consider 3 possible trajectories that exemplify different biological pathways:
Mrs. X has been experiencing difficulties with her memory and moves in with her daughter. She becomes physically sedentary, which leads to her becoming physically frail.
Mrs. X is physically active until she slips on ice during her daily walk and breaks her hip. Afterward, she reports feeling less steady on her feet and says that she no longer walks daily. At her next visit, her physician reports that she is cognitively impaired.
Mrs. X is hospitalized after a cerebral infarction. After discharge, she experiences difficulty walking half a mile. Later, her physician reports that she is cognitively impaired.
These examples demonstrate hypotheses supported by the academic literature that 1) declines in cognitive or mental health lead to physical frailty (20, 44), which is a geriatric syndrome that encompasses walking speed and physical strength (45); 2) physical activity increases cognitive reserves (19); and 3) brain infarcts lead to declines in both cognition (46) and gait speed (23) or, more generally, shared processes in the brain drive physical and cognitive declines (9, 47, 48). Future work can investigate whether subgroups of persons can be identified according to these different mechanistic pathways, each of which offers different strategies for intervention.
Strengths of our analysis include a novel modeling approach that allowed us to model the bidirectional, possibly dynamic, associations between cognitive and physical functioning. We used a longitudinal data set to model within-person changes in functioning over time. We were able to assess the associations between cognitive and physical functioning using 2 measures of physical functioning and 3 measures of cognition, allowing us to better determine the nature and specificity of these associations.
Conclusion
We found that the associations between cognition and physical functioning were bidirectional and similar in magnitude. The association between physical functioning and memory was stronger than associations with executive functioning or global cognition; however, we did not find that the associations between cognitive and physical functioning varied by physical functioning measure. Interdisciplinary collaborations between scientists studying cognition and those studying physical functioning will be critical to determining the mechanism that underlies the bidirectional associations between cognitive and physical functioning.
Supplementary Material
ACKNOWLEDGMENTS
Author affiliations: Department of Biostatistics, Johns Hopkins University, Baltimore, Maryland (Jenna R. Krall, Qian-Li Xue); Department of Mental Health, Johns Hopkins University, Baltimore, Maryland (Michelle C. Carlson); Center on Aging and Health, Johns Hopkins University, Baltimore, Maryland (Michelle C. Carlson, Qian-Li Xue); Mailman School of Public Health, Columbia University, New York, New York (Linda P. Fried); and Department of Medicine, Johns Hopkins University, Baltimore, Maryland (Qian-Li Xue).
This work was supported by the National Institutes of Health (grants T32-AG000247 to J.R.K., R01-AG011703 to L.P.F., and R01-AG019825 to M.C.C.) and by the Johns Hopkins Older Americans Independence Center (grant P30-AG021334 to Q.-L.X.).
Conflict of interest: none declared.
REFERENCES
- 1.Guralnik JM, Ferrucci L, Simonsick EM, et al. Lower-extremity function in persons over the age of 70 years as a predictor of subsequent disability. N Engl J Med. 1995;332(9):556–561. doi: 10.1056/NEJM199503023320902. [DOI] [PMC free article] [PubMed] [Google Scholar]
- 2.Dodge HH, Kadowaki T, Hayakawa T, et al. Cognitive impairment as a strong predictor of incident disability in specific ADL-IADL tasks among community-dwelling elders: the Azuchi Study. Gerontologist. 2005;45(2):222–230. doi: 10.1093/geront/45.2.222. [DOI] [PubMed] [Google Scholar]
- 3.Raji MA, Al Snih S, Ray LA, et al. Cognitive status and incident disability in older Mexican Americans: findings from the Hispanic Established Population for the Epidemiological Study of the Elderly. Ethn Dis. 2004;14(1):26–31. [PubMed] [Google Scholar]
- 4.Studenski S, Perera S, Patel K, et al. Gait speed and survival in older adults. JAMA. 2011;305(1):50–58. doi: 10.1001/jama.2010.1923. [DOI] [PMC free article] [PubMed] [Google Scholar]
- 5.Kelman HR, Thomas C, Kennedy GJ, et al. Cognitive impairment and mortality in older community residents. Am J Public Health. 1994;84(8):1255–1260. doi: 10.2105/ajph.84.8.1255. [DOI] [PMC free article] [PubMed] [Google Scholar]
- 6.Ble A, Volpato S, Zuliani G, et al. Executive function correlates with walking speed in older persons: the InCHIANTI Study. J Am Geriatr Soc. 2005;53(3):410–415. doi: 10.1111/j.1532-5415.2005.53157.x. [DOI] [PubMed] [Google Scholar]
- 7.Fitzpatrick AL, Buchanan CK, Nahin RL, et al. Associations of gait speed and other measures of physical function with cognition in a healthy cohort of elderly persons. J Gerontol A Biol Sci Med Sci. 2007;62(11):1244–1251. doi: 10.1093/gerona/62.11.1244. [DOI] [PubMed] [Google Scholar]
- 8.Tabbarah M, Crimmins EM, Seeman TE. The relationship between cognitive and physical performance: MacArthur Studies of Successful Aging. J Gerontol A Biol Sci Med Sci. 2002;57(4):M228–M235. doi: 10.1093/gerona/57.4.m228. [DOI] [PubMed] [Google Scholar]
- 9.Soumaré A, Tavernier B, Alpérovitch A, et al. A cross-sectional and longitudinal study of the relationship between walking speed and cognitive function in community-dwelling elderly people. J Gerontol A Biol Sci Med Sci. 2009;64(10):1058–1065. doi: 10.1093/gerona/glp077. [DOI] [PubMed] [Google Scholar]
- 10.Atkinson HH, Rosano C, Simonsick EM, et al. Cognitive function, gait speed decline, and comorbidities: the Health, Aging and Body Composition Study. J Gerontol A Biol Sci Med Sci. 2007;62(8):844–850. doi: 10.1093/gerona/62.8.844. [DOI] [PubMed] [Google Scholar]
- 11.Deshpande N, Metter EJ, Bandinelli S, et al. Gait speed under varied challenges and cognitive decline in older persons: a prospective study. Age Ageing. 2009;38(5):509–514. doi: 10.1093/ageing/afp093. [DOI] [PMC free article] [PubMed] [Google Scholar]
- 12.Carlson MC, Fried LP, Xue QL, et al. Association between executive attention and physical functional performance in community-dwelling older women. J Gerontol B Psychol Sci Soc Sci. 1999;54(5):S262–S270. doi: 10.1093/geronb/54b.5.s262. [DOI] [PubMed] [Google Scholar]
- 13.Clouston SAP, Brewster P, Kuh D, et al. The dynamic relationship between physical function and cognition in longitudinal aging cohorts. Epidemiol Rev. 2013;35(1):33–50. doi: 10.1093/epirev/mxs004. [DOI] [PMC free article] [PubMed] [Google Scholar]
- 14.Atkinson HH, Rapp SR, Williamson JD, et al. The relationship between cognitive function and physical performance in older women: results from the Women's Health Initiative Memory Study. J Gerontol A Biol Sci Med Sci. 2010;65(3):300–306. doi: 10.1093/gerona/glp149. [DOI] [PMC free article] [PubMed] [Google Scholar]
- 15.Mielke MM, Roberts RO, Savica R, et al. Assessing the temporal relationship between cognition and gait: slow gait predicts cognitive decline in the Mayo Clinic Study of Aging. J Gerontol A Biol Sci Med Sci. 2013;68(8):929–937. doi: 10.1093/gerona/gls256. [DOI] [PMC free article] [PubMed] [Google Scholar]
- 16.Inzitari M, Newman AB, Yaffe K, et al. Gait speed predicts decline in attention and psychomotor speed in older adults: the Health, Aging and Body Composition Study. Neuroepidemiology. 2007;29(3-4):156–162. doi: 10.1159/000111577. [DOI] [PMC free article] [PubMed] [Google Scholar]
- 17.Taniguchi Y, Yoshida H, Fujiwara Y, et al. A prospective study of gait performance and subsequent cognitive decline in a general population of older Japanese. J Gerontol A Biol Sci Med Sci. 2012;67(7):796–803. doi: 10.1093/gerona/glr243. [DOI] [PubMed] [Google Scholar]
- 18.Alfaro-Acha A, Al Snih S, Raji MA, et al. Does 8-foot walk time predict cognitive decline in older Mexicans Americans? J Am Geriatr Soc. 2007;55(2):245–251. doi: 10.1111/j.1532-5415.2007.01039.x. [DOI] [PubMed] [Google Scholar]
- 19.Kramer AF, Erickson KI. Capitalizing on cortical plasticity: influence of physical activity on cognition and brain function. Trends Cogn Sci. 2007;11(8):342–348. doi: 10.1016/j.tics.2007.06.009. [DOI] [PubMed] [Google Scholar]
- 20.Robertson DA, Savva GM, Kenny RA. Frailty and cognitive impairment—a review of the evidence and causal mechanisms. Ageing Res Rev. 2013;12(4):840–851. doi: 10.1016/j.arr.2013.06.004. [DOI] [PubMed] [Google Scholar]
- 21.Verghese J, Wang C, Lipton RB, et al. Quantitative gait dysfunction and risk of cognitive decline and dementia. J Neurol Neurosurg Psychiatry. 2007;78(9):929–935. doi: 10.1136/jnnp.2006.106914. [DOI] [PMC free article] [PubMed] [Google Scholar]
- 22.Rosano C, Simonsick EM, Harris TB, et al. Association between physical and cognitive function in healthy elderly: the Health, Aging and Body Composition Study. Neuroepidemiology. 2005;24(1-2):8–14. doi: 10.1159/000081043. [DOI] [PubMed] [Google Scholar]
- 23.Vermeer SE, Prins ND, den Heijer T, et al. Silent brain infarcts and the risk of dementia and cognitive decline. N Engl J Med. 2003;348(13):1215–1222. doi: 10.1056/NEJMoa022066. [DOI] [PubMed] [Google Scholar]
- 24.Rosso AL, Studenski SA, Chen WG, et al. Aging, the central nervous system, and mobility. J Gerontol A Biol Sci Med Sci. 2013;68(11):1379–1386. doi: 10.1093/gerona/glt089. [DOI] [PMC free article] [PubMed] [Google Scholar]
- 25.Carlson MC, Xue QL, Zhou J, et al. Executive decline and dysfunction precedes declines in memory: the Women's Health and Aging Study II. J Gerontol A Biol Sci Med Sci. 2009;64(1):110–117. doi: 10.1093/gerona/gln008. [DOI] [PMC free article] [PubMed] [Google Scholar]
- 26.Fried LP, Bandeen-Roche K, Kasper JD, et al. Association of comorbidity with disability in older women: the Women's Health and Aging Study. J Clin Epidemiol. 1999;52(1):27–37. doi: 10.1016/s0895-4356(98)00124-3. [DOI] [PubMed] [Google Scholar]
- 27.Reitan RM. Validity of the Trail Making Test as an indicator of organic brain damage. Percept Mot Skills. 1958;8(3):271–276. [Google Scholar]
- 28.Brandt J. The Hopkins Verbal Learning Test: development of a new memory test with six equivalent forms. Clin Neuropsychol. 1991;5(2):125–142. [Google Scholar]
- 29.Benedict RHB, Schretlen D, Groninger L, et al. Hopkins Verbal Learning Test–Revised: normative data and analysis of inter-form and test-retest reliability. Clin Neuropsychol. 1998;12(1):43–55. [Google Scholar]
- 30.Folstein MF, Folstein SE, McHugh PR. “Mini-mental state”. A practical method for grading the cognitive state of patients for the clinician. J Psychiatr Res. 1975;12(3):189–198. doi: 10.1016/0022-3956(75)90026-6. [DOI] [PubMed] [Google Scholar]
- 31.Guralnik JM, Simonsick EM, Ferrucci L, et al. A short physical performance battery assessing lower extremity function: association with self-reported disability and prediction of mortality and nursing home admission. J Gerontol. 1994;49(2):M85–M94. doi: 10.1093/geronj/49.2.m85. [DOI] [PubMed] [Google Scholar]
- 32.Ma X, Xu J. The causal ordering of mathematics anxiety and mathematics achievement: a longitudinal panel analysis. J Adolesc. 2004;27(2):165–179. doi: 10.1016/j.adolescence.2003.11.003. [DOI] [PubMed] [Google Scholar]
- 33.de Jonge J, Dormann C, Janssen PPM, et al. Testing reciprocal relationships between job characteristics and psychological well-being: a cross-lagged structural equation model. J Occup Organ Psychol. 2001;74(1):29–46. [Google Scholar]
- 34.Yesavage JA, Brink TL, Rose TL, et al. Development and validation of a geriatric depression screening scale: a preliminary report. J Psychiatr Res. 1982-1983;17(1):37–49. doi: 10.1016/0022-3956(82)90033-4. [DOI] [PubMed] [Google Scholar]
- 35.Arbuthnott K, Frank J. Trail Making Test, Part B as a measure of executive control: validation using a set-switching paradigm. J Clin Exp Neuropsychol. 2000;22(4):518–528. doi: 10.1076/1380-3395(200008)22:4;1-0;FT518. [DOI] [PubMed] [Google Scholar]
- 36.Stanek EJ, 3rd, Shetterley SS, Allen LH, et al. A cautionary note on the use of autoregressive models in analysis of longitudinal data. Stat Med. 1989;8(12):1523–1528. doi: 10.1002/sim.4780081212. [DOI] [PubMed] [Google Scholar]
- 37.Muthén LK, Muthén BO, editors. Mplus User's Guide. 6th ed. Los Angeles, CA: Muthén & Muthén; 2011. [Google Scholar]
- 38.Tobin J. Estimation of relationships for limited dependent variables. Econometrica. 1958;26(1):24–36. [Google Scholar]
- 39.van Praag H, Christie BR, Sejnowski TJ, et al. Running enhances neurogenesis, learning, and long-term potentiation in mice. Proc Natl Acad Sci U S A. 1999;96(23):13427–13431. doi: 10.1073/pnas.96.23.13427. [DOI] [PMC free article] [PubMed] [Google Scholar]
- 40.van Praag H, Kempermann G, Gage FH. Running increases cell proliferation and neurogenesis in the adult mouse dentate gyrus. Nat Neurosci. 1999;2(3):266–270. doi: 10.1038/6368. [DOI] [PubMed] [Google Scholar]
- 41.Erickson KI, Prakash RS, Voss MW, et al. Aerobic fitness is associated with hippocampal volume in elderly humans. Hippocampus. 2009;19(10):1030–1039. doi: 10.1002/hipo.20547. [DOI] [PMC free article] [PubMed] [Google Scholar]
- 42.Pereira AC, Huddleston DE, Brickman AM, et al. An in vivo correlate of exercise-induced neurogenesis in the adult dentate gyrus. Proc Natl Acad Sci U S A. 2007;104(13):5638–5643. doi: 10.1073/pnas.0611721104. [DOI] [PMC free article] [PubMed] [Google Scholar]
- 43.Carlson MC, Varma VR. Activity and neurocognitive health in older adults. In: Waldstein S, Elias M, editors. Neuropsychology of Cardiovascular Disease. 2nd ed. Oxford, United Kingdom: Taylor & Francis; In press. [Google Scholar]
- 44.Mezuk B, Edwards L, Lohman M, et al. Depression and frailty in later life: a synthetic review. Int J Geriatr Psychiatry. 2012;27(9):879–892. doi: 10.1002/gps.2807. [DOI] [PMC free article] [PubMed] [Google Scholar]
- 45.Fried LP, Tangen CM, Walston J. Frailty in older adults: evidence for a phenotype. J Gerontol A Biol Sci Med Sci. 2001;56(3):M146–M156. doi: 10.1093/gerona/56.3.m146. [DOI] [PubMed] [Google Scholar]
- 46.Rosano C, Kuller LH, Chung H, et al. Subclinical brain magnetic resonance imaging abnormalities predict physical functional decline in high-functioning older adults. J Am Geriatr Soc. 2005;53(4):649–654. doi: 10.1111/j.1532-5415.2005.53214.x. [DOI] [PubMed] [Google Scholar]
- 47.Whitman GT, Tang Y, Lin A, et al. A prospective study of cerebral white matter abnormalities in older people with gait dysfunction. Neurology. 2001;57(6):990–994. doi: 10.1212/wnl.57.6.990. [DOI] [PubMed] [Google Scholar]
- 48.De Groot JC, De Leeuw FE, Oudkerk M, et al. Periventricular cerebral white matter lesions predict rate of cognitive decline. Ann Neurol. 2002;52(3):335–341. doi: 10.1002/ana.10294. [DOI] [PubMed] [Google Scholar]
Associated Data
This section collects any data citations, data availability statements, or supplementary materials included in this article.