

Abstract
Background: A critical shortage in the supply of physicians in the United States has necessitated innovative approaches to physician service delivery. Telemedicine is a viable service delivery model for a variety of physician and health services. Telemedicine is most effective when applied where physician resources are scarce, patient care is time sensitive, and service volume may be distributed across a network. Shortages in critical care and neurology specialists have led to the use of tele-intensive care unit and telestroke services in hospital settings. These hospital-based telemedicine services have gained acceptance and recommendation. Hospitalist staffing shortages may provide an opportunity to apply similar telemedicine models to hospitalist medicine. This study assesses the potential market for a nighttime telehospitalist service. Materials and Methods: An analysis of the Florida state hospital discharge dataset investigated the potential market for a new nighttime telehospitalist service. Admissions were filtered and stratified for common hospitalist metrics, time of day, and age of patients. Admissions were further expressed by hour of day and location. Results: Nineteen percent of common hospitalist admissions occurred between 7:00 p.m. and 7:00 a.m., with a range of 17%–27% or 0.23–10.09 admissions per night per facility. Eighty percent of admissions occurred prior to midnight. Nonrural facilities averaged 6.69 hospitalist admissions per night, whereas rural facilities averaged 1.35 admissions per night. Conclusions: The low volume of nighttime admissions indicates an opportunity to leverage a telehospitalist physician service to deliver inpatient medical admission services across a network. Lower volumes of nighttime admissions in rural facilities may indicate a market for telehospitalist solutions to address the dilemma of hospitalist staffing shortages.
Key words: : business administration/economics, telemedicine, telehealth, commercial telemedicine
Introduction
The impact of the shortage of physicians to manage increasing inpatient volumes has many service providers, health systems, and administrators seeking sustainable solutions to bring and maintain high-quality care to their respective communities. The demand for hospitalists exceeds the supply of available physician resources. The Phoenix Group, a hospitalist think tank, estimated that only 1 in every 15 internal medicine graduates chooses to become a hospitalist.1 This issue is exacerbated by a general decrease in number of medical school graduates and a projected undersupply of physicians through 2025.2 Hospitalists may also be more demanding about practice location, schedule, and duties. This creates a unique and competitive recruiting and retention environment for hospitals and physician management companies. The Phoenix Group recommended alternatives to the traditional staffing models,1 and according to a commentary in the February 2010 edition of Today's Hospitalist,3 telemedicine hospitalists will be part of hospital medicine's future.
Hospitalists care for both adult and pediatric patients in the inpatient setting. Traditional hospitalist programs focus on the medical management of hospitalized adult patients and provide care 24 h/day, 365 days a year.4,5 Common duties of the hospitalist physician include admitting patients who present to the emergency room and daily follow-up visits throughout their inpatient stay to discharge.4,5 According to the 2011 Society of Hospital Medicine–Medical Group Management Association Hospital Medicine Survey,6 the demographic distribution of hospitalists shows 34.9% are women and 65.1% are men. Hospitalist use and programs in the United States are growing rapidly.7–9
Approximately 66% of hospitals in the United States employ or contract for hospitalist services. Fifty-seven percent of hospitalists are employed by hospitals or health systems, 21% of hospitalists are employed by physician group management companies, and the remaining 22% are either self-employed or part of multispecialty groups.6
For hospitalist practices offering 24/7 care, nighttime coverage can be particularly problematic. Hospitalist programs, with two or more physicians working simultaneously during the daytime, typically reduce staffing at night beginning at 7:00 p.m. Night coverage is typically more expensive than day coverage because of lower volumes of billable services. The 2011 Society of Hospital Medicine–Medical Group Management Association survey6 reported a 30% increase in hospital investment in nighttime hospitalist services. Many hospitals struggle with nighttime coverage as staff-to-patient ratios are inefficient, and, in certain scenarios, the quality of care at night has been documented to be lower than that for daytime services.10–12 These inconsistencies are unacceptable. Rotating shifts from days to nights is frequently dissatisfying to many physicians.13
The traditional alternative to in-house coverage is a call-based model, but these tend to be unpopular, which makes recruiting efforts difficult, especially for smaller practices. Solutions requiring night call or moonlighter support may be unsustainable owing to physician burnout and expensive compensation requirements.6,14 Furthermore, a call model may also imply that stable patients presenting for admission after 7:00 p.m. may not be seen by a physician until the following day. Hospitals need viable alternatives to traditional nighttime staffing and care delivery models. A telemedicine model may be an alternative for hospitals to consider. An inpatient telemedicine model may be applicable when applied to specialties where physician resources are scarce, patient care is time sensitive, and service volume may be distributed across a network.
Several examples of such telemedicine services exist such as tele-intensive care unit15–17 and telestroke18–20 services that leverage a remotely located and centralized, or distributed, physician workforce to manage low-volume, time-sensitive patient care needs across a network.15–20 Because of the dilemma faced by the scarcity of critical care and neurology specialists,21–23 as well as advancements in technology and health policy,24,25 these services have gained industry acceptance and meet the standards for patient care as recommended by the American Stroke Association and the LeapFrog Group.20,26–28
Hospitalist medicine, facing a scarcity of hospitalist physician resources, may apply a telemedicine network model to nighttime hospitalist care delivery where the volume of billable patient services is low and patient care issues are time sensitive.
Eagle Hospital Physicians (Atlanta, GA), a national hospitalist management company, has adopted telemedicine as a means to help its clients overcome the challenges presented by the shortage of inpatient physician resources. Eagle conducted a pilot service with a hospital partner to determine the feasibility of utilizing telemedicine hospitalists, or telehospitalists, to conduct admissions through the emergency department.
A review of the pilot service data revealed that hospitalist admissions completed via telemedicine took, on average, 1 min longer than the traditional in-person admission process, physicians had 100% documentation compliance, and patient satisfaction was in the 90th percentile.29
In consideration of this experience and of the need for innovative solutions to nighttime hospitalist coverage, telehospitalists may have the ability to meet a patient care need and to reduce traditional inefficiencies associated with nighttime hospitalist physician services. This study seeks to assess the potential market for a nighttime telehospitalist service.
To aid researchers in identifying the presence of a market for nighttime tele-hospitalist services, the following definitions were applied:
1. Nighttime: refers to the hours of 7:00 p.m.–7:00 a.m. local time
2. Network: a group of two or more hospitals or facilities
3. Low volume: on average, three or fewer hospitalist admissions per nighttime shift per facility
4. Time-sensitive patient care: a patient presentation with an acute medical condition requiring hospital admission
Materials and Methods
The Agency for Healthcare Research and Quality (AHRQ) collaborates with many states to collect inpatient discharge data from acute care hospitals. In the state of Florida, approximately 2.5 million records are updated annually. Each record in the dataset corresponds to an individual inpatient hospital stay. The data include patient-level data such as time of admission, patient demographics, diagnosis and procedure codes, attending physician, operating or performing physicians, and total gross charges.
AHRQ releases the inpatient data 130 days after the end of a reporting period. The data are verified within 180 days of the end of the reporting period and are completed 2 months after the initial version is released by AHRQ.
AHRQ collects data on acute care, short-term psychiatric, long-term psychiatric, and comprehensive rehabilitation facilities. Reporting of inpatient data is not required for state-operated hospitals, federal hospitals, and Shriner's Hospitals.
For this study, admissions data from 226 Florida hospitals were analyzed. Some data elements were changed to protect patient privacy. For example, patient birth dates are converted to ages, patient discharge dates were reported as calendar quarters, and procedure dates were reported as number of days to procedures. In addition, patient IDs and social security numbers were not reported.
The Florida 2010 discharge dataset was filtered to include common hospitalist adult medical admissions. Therefore, certain data were excluded from this analysis to more clearly identify the percentage of calls an adult hospitalist would be called upon to consult for medical management and potential admission to a facility including patients younger than 18 years of age, E-codes (diagnoses related to external causes of injury/typically trauma), and dental-, surgical-, obstetric-, and post–acute care-related diagnosis-related groups. Identifying other needs in the facility, such as trauma care, pediatric and obstetric coverage, etc., falls under a different medical service than what is intended to discover and identify with this analysis. However, had these data been included, the volume of nighttime admissions would increase by as much as 29.1%.
Hospitals were grouped into categories based on their reported annual hospital admissions volume. Hospitals with 1,000 or fewer annual admissions were grouped together, with respective admission ranges up through 11,000 annual admissions. Hospitals with 11,000 or greater annual admissions were grouped together. A frequency table was used to assess nighttime admissions by hour of day and typical hospitalist shift times.
Descriptive statistical analyses were used to reflect volume of nighttime admissions compared with total volume of hospital admissions. Admissions data were also analyzed by time of day and facilities' rural or nonrural location. Rural locations were defined as an area with a population density of fewer than 100 individuals per square mile.30
Results
Hospitals in the dataset were stratified by volume of admissions. Total admissions to any individual facility were not assigned or recognized by name or hospital identifier. All hospitals in a given stratification were grouped together, and any per-facility assumptions were based on the aggregated volume of admissions and averaged across the facilities represented in the stratification. The number of hospitals in any given strata is represented, with the majority of hospitals falling in the >11,000 annual admissions strata. Based on the assumption that low admission volumes predispose a hospital for telehospitalist services, it was felt that grouping the larger facilities together would not compromise the analysis.
Total admissions in each stratum represent all possible reported admissions in 2010. Of the total possible admissions reported, across strata, on average, 42% of those admissions were considered common hospitalist admissions after exclusion of the aforementioned variables. These data had a range of 39–56%. Of these admissions, 46% were determined to have occurred during the nighttime shift (7:00 p.m.–7:00 a.m.), with a range of 43–48%. When compared with the total number of admissions, common hospitalist nighttime admissions accounted for 19% of the total admission volume in a 24-h period, with a range of 17–27%. Volume of common hospitalist nighttime admissions per facility ranged from 0.23 to 10.09 admissions per night.
A review of Tables 1 and 2 indicates that 78 hospitals met the definitions and assumptions for a potential market for a telehospitalist service. These hospitals represented 34.5% of the total number of hospitals included in the Florida 2010 discharge dataset and are found in the strata of 4,000–4,999 (less than 5,000) and below. Total hospital admissions per facility in this cohort have a range of 0.23–3.08 admissions per night per facility.
Table 1.
Analysis of Hospitalist Night Volume Admissions
| ADMISSION VOLUME | NUMBER OF HOSPITALS | % OF TOTAL HOSPITALS | TOTAL ANNUAL ADMISSIONS | PORTION OF ANNUAL ADMISSIONS ASSUMED TO BE HOSPITALIST ADMISSIONS | PORTION OF ANNUAL HOSPITALIST ADMISSIONS OCCURRING AT NIGHT |
|---|---|---|---|---|---|
| 0–999 | 20 | 9% | 9,099 | 3,930 | 1,648 |
| 1,000–1,999 | 12 | 5% | 15,855 | 5,768 | 2,523 |
| 2,000–3,999 | 22 | 10% | 36,587 | 14,501 | 6,179 |
| 4,000–4,999 | 24 | 11% | 109,570 | 60,840 | 26,967 |
| 5,000–5,999 | 12 | 5% | 68,203 | 38,206 | 18,375 |
| 6,000–8,999 | 18 | 8% | 136,591 | 62,967 | 28,114 |
| 9,000–10,999 | 19 | 8% | 94,577 | 45,846 | 20,384 |
| >11,000 | 99 | 44% | 1,997,507 | 785,356 | 364,559 |
| Total | 226 | 100% | 2,595,000 | 1,077,357 | 497,207 |
Table 2.
Analysis of Hospitalist Night Volume Admissions Per Night Per Facility
| ADMISSION VOLUME | HOSPITALIST ADMISSIONS AS % OF TOTAL ADMISSIONS | % OF TOTAL HOSPITALIST ADMISSIONS OCCURRING DURING NIGHT SHIFT | HOSPITALIST NIGHT ADMISSIONS AS % OF TOTAL ADMISSIONS | AVERAGE NUMBER OF HOSPITALIST ADMISSIONS PER NIGHT | AVERAGE NUMBER OF HOSPITALIST NIGHT ADMISSIONS PER FACILITY |
|---|---|---|---|---|---|
| 0–999 | 43% | 42% | 18% | 4.52 | 0.23 |
| 1,000–1,999 | 36% | 44% | 16% | 6.91 | 0.58 |
| 2,000–3,999 | 40% | 43% | 22% | 16.93 | 0.77 |
| 4,000–4,999 | 56% | 44% | 25% | 73.88 | 3.08 |
| 5,000–5,999 | 56% | 48% | 27% | 50.34 | 4.20 |
| 6,000–8,999 | 46% | 45% | 24% | 25.94 | 1.44 |
| 9,000–10,999 | 48% | 44% | 22% | 59.15 | 3.11 |
| >11,000 | 39% | 46% | 18% | 998.79 | 10.09 |
| Total | 42% | 46% | 19% | 1,362.21 | 6.03 |
A second analysis assessed volume of admissions by rural and nonrural locations. In this analysis, 12% of hospitals met the definition for rural location. Results by volume of total and common hospitalist admissions were similar to the initial analysis of aggregated data, with little observable variation. Common hospitalist nighttime admissions were slightly higher in rural facilities at 20% of the total admissions, compared with 19% at nonrural facilities. At a per-facility level, rural facilities averaged 1.35 admissions per facility per night, whereas nonrural facilities averaged 6.69 admissions per night per facility (Tables 3 and 4).
Table 3.
Analysis of Hospitalist Night Volume Admissions Analysis by Rural Versus Nonrural
| LOCATION | NUMBER OF HOSPITALS | % OF TOTAL HOSPITALS | TOTAL ANNUAL ADMISSIONS | PORTION OF ADMISSIONS ASSUMED HOSPITALIST ADMISSIONS | PORTION OF ANNUAL HOSPITALIST ADMISSIONS OCCURRING AT NIGHT |
|---|---|---|---|---|---|
| Rural | 28 | 12% | 67,919 | 32,424 | 13,768 |
| Nonrural | 198 | 88% | 2,523,070 | 1,044,523 | 483,228 |
| Total | 226 | 100% | 2,590,989 | 1,076,947 | 496,996 |
Table 4.
Analysis of Hospitalist Night Volume Admissions Per Night Per Facility for Rural Versus Nonrural
| LOCATION | HOSPITALIST ADMISSIONS AS % OF TOTAL ADMISSIONS | % OF HOSPITALIST ADMISSIONS OCCURRING DURING NIGHT SHIFT | HOSPITALIST NIGHT ADMISSIONS AS % OF TOTAL ADMISSIONS | AVERAGE NUMBER OF HOSPITALIST ADMISSIONS PER NIGHT | AVERAGE NUMBER OF HOSPITALIST NIGHT ADMISSIONS PER FACILITY |
|---|---|---|---|---|---|
| Rural | 48% | 42% | 20% | 37.72 | 1.35 |
| Nonrural | 41% | 46% | 19% | 1,323.91 | 6.69 |
| Total | 42% | 46% | 19% | 1,361.3 | 6.02 |
Hospitalist shifts, like many nursing shifts, consist of 12-h blocks. Day shifts begin at 7:00 a.m. and end at 7:00 p.m. Night shifts begin at 7:00 p.m. and end at 7:00 a.m. The Florida discharge dataset is one of the few states that include time of admission within the dataset. A hospitalist admission frequency analysis by hour of the day reflected that 46% of all admissions occur during the night shift and 54% during the day shift. The majority of admissions (51%) occurred between the last 4 h of the day shift and the first 5 h of the night shift (3:00 p.m.–12:00 a.m.). Twenty percent of admissions occurred between midnight and 7:00 a.m., and 29% of admissions occurred between 7:00 a.m. and 3:00 p.m. (Fig. 1).
Fig. 1.
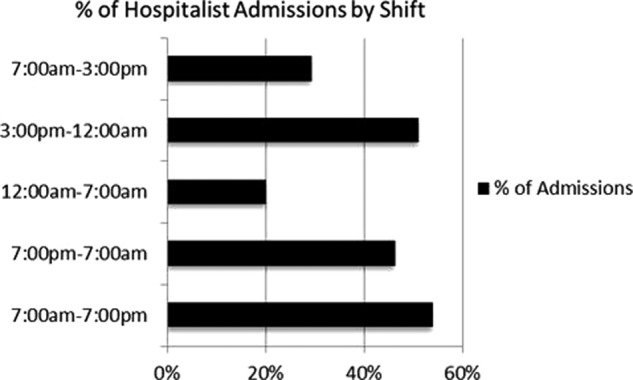
Percentage of hospitalist admissions in all facilities analyzed by shift, reflecting peak times for admissions in short-shift blocks (7:00 a.m.–3:00 p.m./3:00 p.m.–12:00 a.m./12:00 a.m.–7:00 a.m.) and 12-h shift blocks (7:00 a.m.–7:00 p.m./7:00 p.m.–7:00 a.m.).
A similar analysis of admission frequency for rural facilities (Fig. 2) showed that 42% of admissions occurred during the night shift and 58% during the day shift. As with the aggregated analysis above, the majority (52%) of rural facility admissions occurred between 3:00 p.m. and 12:00 a.m. Sixteen percent of admissions occurred between midnight and 7:00 a.m., and 32% of admissions occurred between 7:00 a.m. and 3:00 p.m. (Fig. 3).
Fig. 2.
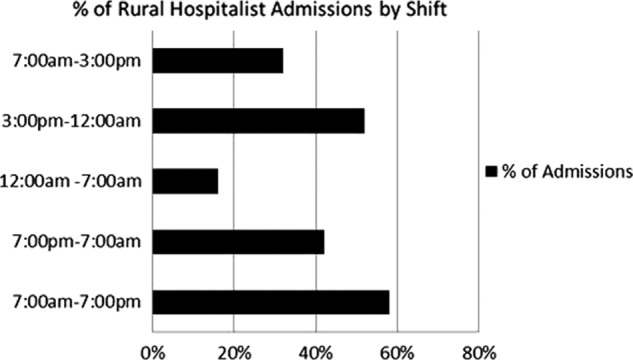
Percentage of hospitalist admissions in rural facilities by shift, reflecting peak times for admissions in short-shift blocks (7:00 a.m.–3:00 p.m./3:00 p.m.–12:00 a.m./12:00 a.m.–7:00 a.m.) and 12-h shift blocks (7:00 a.m.–7:00 p.m./7:00 p.m.–7:00 a.m.).
Fig. 3.
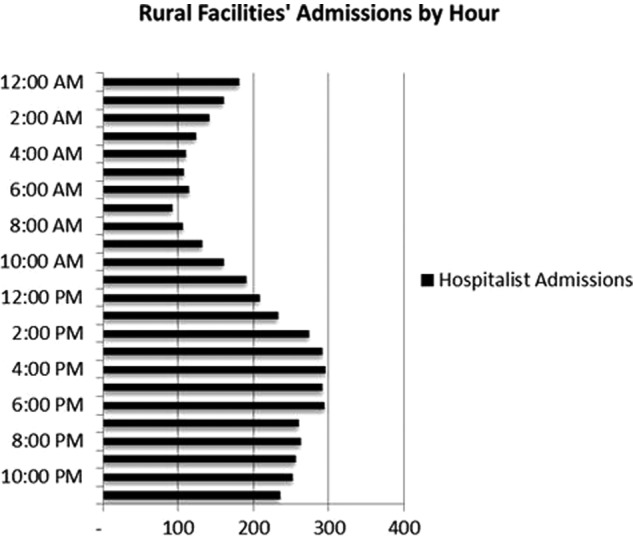
Assumed hospitalist admission volume per hour at all rural facilities analyzed. This represents a cumulative volume of admissions in each hour segment and not a per-day or per-facility volume.
A side-by-side comparison of the actual admission volume from rural and nonrural facilities helped to further investigate the potential market for telehospitalist service. Low volumes of actual admissions during a shift indicate an opportunity to distribute that volume across a network where a physician may serve several facilities simultaneously through the use of telemedicine. Figure 4 shows an observable per shift differential between rural and nonrural facilities. Between-shift actual admission differences indicated for rural facilities a range of 0.51–1.83 and for nonrural facilities a range of 2.86–7.77. On average, these differences reflected a per-shift variance between rural and nonrural locations of 78%, with a range of 76–80%. These data of actual admission volume per site indicate a potential market for telehospitalist services in rural facilities.
Fig. 4.
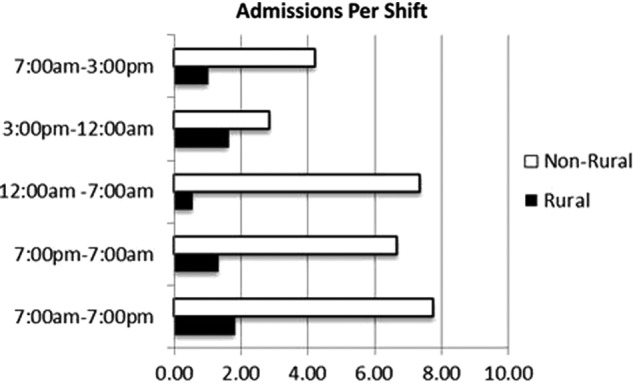
Comparison of admissions per shift between rural and nonrural facilities analyzed by shift, reflecting short-shift blocks (7:00 a.m.–3:00 p.m./3:00 p.m.–12:00 a.m./12:00 a.m.–7:00 a.m.) and 12-h shift blocks (7:00 a.m.–7:00 p.m./7:00 p.m.–7:00 a.m.).
Discussion
For volumes of common hospitalist admissions, as represented in this analysis, nighttime admissions represented a lower percentage of the total admissions than daytime admissions. This difference is observably greater after midnight, with the majority of admissions occurring between the hours of 3:00 p.m. and 12:00 a.m. and a minimal contribution of admissions between 12:00 a.m. and 7:00 a.m. The lower the average of nighttime admissions by facility, the more inefficient and expensive it is for a program to employ a physically present physician resource, and the higher the likelihood that a potential telehospitalist service may assist.
When data are stratified by volume of admissions, there does not appear to be an observable difference in the percentage of nighttime admissions between strata. However, for the purposes of this study and the identification of the potential market for telehospitalist services, this finding, although intriguing, was less important. More important to the determination of a potential market for telehospitalist services were the actual volume of admissions and their respective time of presentation. In this way, the comparison between hospitals with fewer than 5,000 annual admissions as well as between rural and urban facilities represents a larger observable difference in actual volume and a higher likelihood that a market exists for telehospitalist services in the rural setting and hospitals with fewer than 5,000 annual admissions.
Nonrural
For nonrural facilities, although they are strained by the scarcity of hospitalist physician resources, average per facility nighttime admission volume may be too high to distribute efficiently across a telehospitalist physician network. However, there exists a cohort of nonrural facilities with less than 5,000 annual admissions wherein a potential market for a nighttime telehospitalist service may exist.
For larger, nonrural facilities, higher volumes of admissions create greater efficiencies for on-site or local staff to manage patient care. This analysis suggests an opportunity to create a market for telehospitalist services by adjusting traditional shift times and delay reductions of physician resources until after midnight, when volumes decrease and efficiencies may be greater by leveraging a telehospitalist resource.
Rural
Approximately 22% of the U.S. population lives in the 80% of the U.S. landmass classified as “rural”; only 10% of U.S. physicians practice there. Rural Americans have access to significantly fewer physician resources than their nonrural counterparts.28–30 Rural hospitals have been and will continue to be asked to meet the same standards of patient care as their nonrural counterparts. However, rural hospitals have fewer resources with which to meet these expectations.31
Given the shortage of physician resources, although volumes were low at 1.35 per nighttime shift, a hospitalist practicing in a rural location may be “on-call” for 24 h or more at a time.32 This expectation increases the likelihood of physician burnout and places both patients and providers at risk.14 A nighttime telehospitalist physician may deliver care that is not only timely, but essential to the preservation of local physician resources that may face a higher degree of burnout.
Additionally, a nighttime telehospitalist has the ability to both see and speak with a patient, family members, and on-site care providers. This may increase the likelihood of a proper “real-time” diagnosis and treatment plan—allowing the patient to get the care he or she needs within the facility and reduce expensive transport costs associated with transfer to a tertiary facility.33
Progress in communications technology along with policies regarding technology infrastructure is paving the way for many rural communities to access services that previously were impossible.28,32,34,35 This creates a greater potential for the redistribution of physician resources via telemedicine resources and infrastructure. The implementation of electronic health records, computerized physician order entry, and electronic medical records continues to improve the telemedicine physician's ability to provide care that is well accepted by patients, family members, and medical staff, and in turn they can deliver care that is timely, efficient, patient centered, and equitable.34
Conclusions
Given the following assumptions—(1) hospitalist physician resources are scarce, (2) low patient volume may be spread across a network, and (3) admissions during the night are time sensitive—researchers concluded that at least 34.5% of hospitals included in the Florida 2010 discharge dataset represent a potential market for nighttime telehospitalist services. This market, more specifically, exists in hospitals with less than 5,000 annual admissions as well as hospitals in the rural setting.
Hospitals, health systems, and physician service providers may find a nighttime telehospitalist service to be a viable solution to bring scarce hospitalist physician resources to the inpatient point of care. Subsequent telehospitalist research should focus on performance of a telehospitalist service to standard hospitalist program metrics, comparison with on-call and in-person service delivery, and factors of satisfaction, quality, patient outcomes, and standards that affect telehospitalist care delivery.
Disclosure Statement
R.B.S. and D.P.G. are employees of Eagle Hospital Physicians. K.N.S. and A.S.K. declare no competing financial interests exist.
References
- 1.Phoenix Group. Confronting the hospitalist workforce shortage. White paper. Available at www.phoenixgroupwhitepaper.com (last accessed July15, 2012)
- 2.American Association of Medical Colleges. The complexities of projecting physician supply & demand through 2025. Available at https://members.aamc.org/eweb/upload/The%20Complexities%20of%20Physician%20Supply.pdf (last accessed October20, 2013)
- 3.DeLue E. 2020 vision. Todays Hospitalist 2010;8(2):7–8 [Google Scholar]
- 4.Wachter RM, Goldman L. The emerging role of “hospitalists” in the American health care system. N Engl J Med 1996;335:514–517 [DOI] [PubMed] [Google Scholar]
- 5.Society of Hospital Medicine. Definition of a hospitalist and hospital medicine. Available at www.hospitalmedicine.org/AM/Template.cfm?Section=Hospitalist_Definition&Template=/CM/HTMLDisplay.cfm&ContentID=24835 (last accessed September13, 2013)
- 6.Society of Hospital Medicine. Society of Hospital Medicine compensation survey. Englewood, CO: Medical Group Management Association, 2011 [Google Scholar]
- 7.Nelson J. The growth of the hospitalist. SHM online resource center. Available at http://blogs.hospitalmedicine.org/SHMPracticeManagementBlog/?p=242 (last accessed September12, 2012)
- 8.Meltzer DO, Chung JW. U.S. trends in hospitalization and generalist physician workforce and the emergence of hospitalists. J Gen Intern Med 2010;25:453–459 [DOI] [PMC free article] [PubMed] [Google Scholar]
- 9.Kuo YF, Gulshan S, Freeman JL, Goodwin JS. Growth in the care of older patients by hospitalists in the United Sates. N Engl J Med 2011;360:1102–1110 [DOI] [PMC free article] [PubMed] [Google Scholar]
- 10.Peberdy MA, Ornato JP, Larkin GL, et al. Survival from in-hospital cardiac arrest during nights and weekends. JAMA 2008;299:785–792 [DOI] [PubMed] [Google Scholar]
- 11.Walkinshaw E. Middle of the night medicine is rarely patient-centered. CMAJ 2011;183:1467–1468 [DOI] [PMC free article] [PubMed] [Google Scholar]
- 12.Khanna R, Wachsberg K, Marouni A, et al. The association between night or weekend admission and hospitalization-relevant patient outcomes. J Hosp Med 2011;6:10–14 [DOI] [PubMed] [Google Scholar]
- 13.Butterfield S. Physicians of the night: The who, what and why of nocturnists. December2008. Available at www.acphospitalist.org/archives/2008/12/cover.htm (last accessed March29, 2009)
- 14.Ryan L. Work-life balance for hospitalists a people issue, not a women's issue. Hospitalist 2012;(May). Availailable at www.the-hospitalist.org/details/article/1996009/Work-Life_Balance_for_Hospitalists_a_People_Issue_Not_a_Womens_Issue.html (last accessed October2, 2012)
- 15.Reynolds HN, Rogove H, Bander J, McCambridge M, Cowboy E, Niemeier M. A working lexicon for the tele-ICU: We need to define tele-ICU to grow and understand it. Telemed J E Health 2011;17:773–783 [DOI] [PubMed] [Google Scholar]
- 16.Breslow MJ, Rosenfeld BA, Doerfler M, et al. Effect of a multiple-site intensive care unit telemedicine program on clinical and economic outcomes: An alternative paradigm for intensivist staffing. Crit Care Med 2004;32:31–38. Erratum in: Crit Care Med2004;32:1632. [DOI] [PubMed] [Google Scholar]
- 17.Vespa P, Miller C, Hu X, et al. Intensive care unit robotic telepresence facilitates rapid physician response to unstable patients and decreased cost in neurointensive care. Surg Neurol 2007;67:331–337 [DOI] [PubMed] [Google Scholar]
- 18.Schwamm LH, Holloway RG, Amarenco P, Audebert HJ, Bakas T, Chumbler NR, Handschu R. A review of the evidence for the use of telemedicine within stroke systems of care: A scientific statement from the American Heart Association. Stroke 2009;40:2616–2634 [DOI] [PubMed] [Google Scholar]
- 19.Lai F. Stroke networks based on robotic telepresence. J Telemed Telecare 2009;15:135–136 [DOI] [PubMed] [Google Scholar]
- 20.Roger VL, Go AS, Lloyd-Jones DM, et al. Heart disease and stroke statistics—2012 update: A report from the American Heart Association. Circulation 2012;125:e2–e220 [DOI] [PMC free article] [PubMed] [Google Scholar]
- 21.Wood KE, Venditti A. Leveraging telemedicine: Using critical care to advance tele-health practice. Presentation for the American College of Healthcare Executives, June20, 2012 [Google Scholar]
- 22.Rosenfeld B. eICU: More data are now available. Health Aff (Millwood) 2009;28:1859.; author reply 1860. [DOI] [PubMed] [Google Scholar]
- 23.Nesbitt TS, Ellis JC, Kuenneth CA. A proposed model for telemedicine to supplement the physician workforce in the USA. J Telemed Telecare 1999;5(Suppl 2):S10–S26 [DOI] [PubMed] [Google Scholar]
- 24.American Medical Association. Physician characteristics and distribution in the U.S., annual. Available at www.ama-assn.org/ (last accessed October2, 2012)
- 25.Angus DC, Kelley Ma, Schmitz RJ, White A, Popovich J. Current and projected workforce requirements for care of the critical ill and patients with pulmonary disease: Can we meet the requirements of an aging population? JAMA 2000;284:2762–2770 [DOI] [PubMed] [Google Scholar]
- 26.Watanabe M, Jennett P, Watson M. The effect of information technology on the physician workforce and health care in isolated communities: The Canadian picture. J Telemed Telecare 1999;5(Suppl 2):S11–S19 [DOI] [PubMed] [Google Scholar]
- 27.Bashshur RL, Shannon GW, et al. National telemedicine initiatives: Essential to healthcare reform. Telemed J E Health 2009;15:600–610 [DOI] [PubMed] [Google Scholar]
- 28.The Leapfrog Group. ICU physician staffing. 2012. Available at www.leapfroggroup.org/media/file/FactSheet_IPS.pdf (last accessed October2, 2012)
- 29.Godamunne K. Mobile telepresence to admit patients in the emergency room: A remote hospitalist study. White paper. 2008. Available at www.eaglehospitalphysicians.com (last accessed December6, 2011)
- 30.Florida Department of Health. Rural definition. 2012. Available at www.doh.state.fl.us/workforce/ruralhealth/ruralhealthhome.html (last accessed October2, 2012)
- 31.Health care workforce distribution and shortage issues in rural America. Kansas City, MO: National Rural Health Association, 2003. [Google Scholar]
- 32.Rural Assistance Center. Available at www.raconline.org/publications/ (last accessed October2, 2012)
- 33.Bereford L. The power of one: Rural hospitalists face myriad challenges, find professional rewards. Hospitalist 2012;16(1):33–37 [Google Scholar]
- 34.Wager KA, Lee FW, Glaser JP. Health care information systems: A practical approach for health care management, 2nd ed. San Francisco: Jossey-Bass, 2009 [Google Scholar]
- 35.Gagnon MP, et al. Exploring the effects of telehealth on medical human resources supply: A qualitative case study in remote regions. BMC Health Serv Res 2007;7:6. [DOI] [PMC free article] [PubMed] [Google Scholar]