

Abstract
BACKGROUND
Recent studies have highlighted issues with the International Prognostic Scoring System (IPSS) model in relation to the exclusion of many subgroups that now represent a large proportion of patients with myelodysplastic syndrome (MDS) (eg, secondary MDS, chronic myelomonocytic leukemia [CMML] with leukocytosis, prior therapy) and its lack of applicability to most patients on investigational programs, because many would have received prior therapies and would have had MDS for a significant length of time.
METHODS
The authors analyzed 1915 patients with MDS who were referred from 1993 to 2005 (including those with CMML, secondary MDS, and MDS with prior therapy). Only 507 patients (26%) had primary MDS without prior therapy (ie, classifiable by the IPSS). Patients were divided randomly into a study group (n = 958) and a test group (n = 957).
RESULTS
A multivariate analysis of prognostic factors in the study group identified the following adverse, independent factors as continuous and categoric values (P<.001): poor performance, older age, thrombocytopenia, anemia, increased bone marrow blasts, leukocytosis, chromosome 7 or complex (≥3) abnormalities, and prior transfusions. Cutoffs for anemia, thrombocytopenia and blasts, and cytogenetic subsets were different according to the IPSS. The new MDS prognostic model divided patients into 4 prognostic groups with significantly different outcomes. The model was validated in the test group. Applying the prognostic score of the new model within the 4 IPSS risk groups, overall, and in patients who had primary MDS without prior therapy was found to be highly prognostic in each subset. Applying the IPSS within each of the 4 risk groups of the new MDS model was not found to be prognostic.
CONCLUSIONS
The new model accounts for duration of MDS and prior therapy. It is applicable to any patient with MDS at any time during the course of MDS.
Keywords: prognosis in MDS, prognostic models, risk groups in MDS, chronic myelomonocytic leukemia
Myelodysplastic syndromes (MDS) are a heterogeneous group of neoplastic bone marrow disorders characterized by dysplastic changes in the myeloid lineages and a variable percentage of blasts. Approximately 50% of patients have chromosomal aberrations. The presenting laboratory features are marked by anemia (usually macrocytic) and neutropenia/thrombocytopenia.1–3 The disease heterogeneity is accounted for in part by several consistent pretreatment prognostic factors, which are incorporated into prognostic models such as the French-American-British (FAB), World Health Organization (WHO), and International Prognostic Scoring System (IPSS) classifications.4–6 The IPSS has achieved widespread use in clinical practice as well as in investigational studies to stratify patients and to assess the benefit of new therapies within prognostic subsets. The original IPSS classification mostly involved patients with newly diagnosed, untreated MDS (only 8% received minimal prior therapy) and excluded patients who had secondary MDS and chronic myelomonocytic leukemia (CMML) with white blood cell (WBC) counts >12 × 109/L.6 The effect of the duration of the antecedent hematologic disorder (AHD) on outcome in patients with MDS also was not specified. Recent studies have suggested that a need for transfusions is an adverse factor and have proposed different cytogenetic categories for prognostic classifications.7–9
Application of the IPSS to modern investigations and to patient prognostication is limited by a few issues: 1) most patients who are referred for investigational trials already have failed some form of therapy (growth factors, chemotherapy) and have had MDS for some time, 2) 20% to 30% of patients with MDS have secondary MDS, 3) patients who have CMML with a WBC count >12 × 109/L are excluded, 4) patients with poor performance or organ dysfunctions (ie, excluded from investigational therapy) are not accounted for, and 5) the effect of erythrocyte transfusion dependence has not been considered. In the current analysis, we attempted to address some of these issues by 1) applying the IPSS to MDS categories that were excluded from the original study (secondary MDS, duration of AHD, CMML with high WBC counts, prior therapy) and 2) using multivariate analysis to propose and validate a new risk model for MDS.
MATERIALS AND METHODS
All patients with a diagnosis of MDS who were referred to the Adult Leukemia Department at M. D. Anderson Cancer Center from 1993 (with prior treatment information available) to 2005 were included. Criteria for inclusion in the analysis were 1) age ≥16 years, 2) a confirmed diagnosis of MDS with <30% blasts, and 3) informed consent according to institutional guidelines. Patients were included regardless of performance status, presence of organ dysfunctions, and extent of prior therapy. Patients who had secondary disease or CMML with leukocytosis were included.
Patient and disease characteristics at the time of study inclusion were recorded. In the analysis of prognostic factors, the variables included were sex, age, performance status, hemoglobin, WBC counts, platelet counts, absolute neutrophil counts, bone marrow blasts (percent and cellularity), the levels of creatinine and bilirubin, the presence of Auer rods, the duration of MDS and AHD, prior malignancy and treatment, morphology (MDS vs CMML), number of cytopenia events, IPSS score (tested on all patients regardless of whether they had secondary MDS or CMML with high WBC counts), cytogenetic abnormalities, and prior therapy.
Cytogenetic categories were coded as proposed previously in different models8,9 into 1) diploid/loss of chromosome Y, 2) deletion in 5q only, 3) deletion in 20q only, 4) trisomy 8 alone or with 1 additional abnormality, 5) other abnormalities involving <3 changes, 6) chromosome 7 abnormality alone or with other abnormalities, and 7) complex abnormalities that involved ≥3 changes. Prior treatments for MDS were grouped first as follows: 1) no prior therapy, 2) transfusions only, 3) growth factors, 4) hypomethylating agents with or without other therapy, 5) thalidomide with or without other therapy, 6) other chemotherapy (eg, hydroxyurea, topotecan plus cytarabine, idarubicin plus cytarabine).
Statistical Considerations
The significance of individual characteristics was evaluated by univariate and multivariate analyses.10,11 Survival was calculated from the date of referral to our institution. Time to the development of acute myeloid leukemia (AML) was calculated from the date of referral to the date patients developed ≥30% myeloblasts. In total, 1915 patients who were referred from 1993 to 2005 were included. Patients were divided randomly into 2 subgroups of equal size: a study group (n = 958 patients; training set) and a test group (N = 957 patients; validation set).
RESULTS
The characteristics of the total and study groups are shown in Table 1. Among the 1915 patients, 1097 had received growth factors, chemotherapy, or transfusions (318 had received transfusions only); and 818 had not received transfusions, growth factors, or chemotherapy. Survival of the study and test groups is shown in Figure 1. The median survival was 14.1 months in the study and 13.2 months in the test group. This confirmed the prognostic comparability of the 2 groups. Survival by MDS and CMML subsets that were not included in the original IPSS is illustrated in Figure 2. The results suggest a worse outcome for patients in these subsets compared with patients who had primary MDS and received no prior therapy. In particular, the median survival of patients with primary MDS without or with prior therapy was 15.1 months versus 10 months, respectively. This finding is relevant to the comparisons of control groups and treatment groups in current randomized trials. Survival according to IPSS for all patients, for patients with primary MDS (eligible for IPSS) without prior therapy for MDS, for patients with secondary MDS and CMML, for patients with CMML who have WBC counts >12 × 109/L, and for patients with primary MDS who received prior therapy are shown in Table 2. It is interesting to note that only 507 patients (26%) had primary MDS and received no prior therapy. These data confirm the applicability of the IPSS to MDS and CMML groups who were excluded from the original IPSS study but indicate the need for the inclusion of other factors to account for survival differences from the original study (Table 2). These factors are related to prior therapy, secondary MDS, CMML with WBC counts >12 × 109/L, and prior transfusion needs. In addition, refining the prognostic subsets of the original IPSS (eg, cytogenetic subsets, cutoffs for hemoglobin and platelet counts) may improve the risk prediction.
TABLE 1.
Characteristics of the Total Population (n=1915) and in the Study Group (n=958)
| Characteristic | Total Population
|
Study Group
|
||||
|---|---|---|---|---|---|---|
| % | Median | Range | % | Median | Range | |
| Age ≥65 y | 56 | 66 | 13–94 | 57 | 66 | 17–93 |
| Sex, women | 33 | 32 | ||||
| Performance status ≥2 | 13 | 13 | ||||
| Hemoglobin <12 g/dL | 89 | 9.6 | 4.2–16.4 | 88 | 9.6 | 4.2–15.5 |
| Platelets, ×109/L | ||||||
| <30 | 27 | 26 | ||||
| 30–49 | 16 | 61 | 1–1195 | 16 | 60 | 1–1195 |
| Granulocytes <1.5×10⁹/L | 46 | 1.65 | 0–74.7 | 47 | 1.65 | 0–74.7 |
| % Bone marrow blasts | ||||||
| <5 | 37 | 37 | ||||
| 5–10 | 28 | 28 | ||||
| 11–20 | 24 | 23 | ||||
| 21–29 | 10 | 7 | 0–29 | 11 | 7 | 0–29 |
| Chromosomal abnormalities, yes | 55 | 54 | ||||
| Prior therapy for MDS, yes* | 57 | 57 | ||||
| Disease category | ||||||
| MDS | 84 | 84 | ||||
| CMML | 16 | 16 | ||||
| Duration of AHD, mo | ||||||
| 3–6 | 20 | 22 | ||||
| 7–12 | 14 | 13 | ||||
| >12 | 31 | 5 | 0–473 | 30 | 5 | 0–405 |
| Creatinine ≥1.3 mg/dL | 20 | 1 | 0.1–9.8 | 19 | 1 | 0.4–6.4 |
| Bilirubin ≥1.0 mg/dL | 22 | 0.7 | 0.1–12.8 | 23 | 0.7 | 0.1–12.8 |
| β-2 Microglobulin ≥3 mg/L | 52 | 3 | 0.8–20 | 52 | 3 | 0.9–20 |
| Prior malignancy, yes | 30 | 30 | ||||
| Cellularity ≥50% | 57 | 55 | 1–100 | 58 | 55 | 0–100 |
| Leukocytes, ×109/L | ||||||
| 11–20 | 7 | 7 | ||||
| >20 | 10 | 3.7 | 0.1–>100 | 10 | 3.7 | 0.1–>100 |
MDS indicates myelodysplastic syndrome; CMML, chronic myelomonocytic leukemia; AHD, antecedent hematologic disorder.
Therapy included growth factor, transfusion needs, chemotherapy, and others.
FIGURE 1.

Overall survival of the study and test groups.
FIGURE 2.

Survival in myelodysplastic syndrome (MDS) and chronic myelomonocytic leukemia (CMML) subsets that were not considered in the original International Prognostic Scoring System model. WBC >12 indicates a white blood cell count >12 × 109/L.
TABLE 2.
Survival of Patients With MDS According to the IPSS Within MDS Subsets Including Those Not Accounted for in the Original IPSS Study (1993–2005)
| Parameter/IPSS Category | No. of Patients | Estimated Survival
|
||
|---|---|---|---|---|
| Median, Months | % At3 Years | % At 6 Years | ||
| All MDS and CMML | ||||
| Low | 274 | 33 | 46 | 19 |
| Int-1 | 639 | 21 | 31 | 13 |
| Int-2 | 595 | 10 | 14 | 6 |
| High | 407 | 7 | 8 | 6 |
| MDS and CMML: Eligible by IPSS criteria (without prior therapy) | ||||
| Low | 73 | 57 | 70 | 36 |
| Int-1 | 162 | 35 | 49 | 22 |
| Int-2 | 156 | 16 | 26 | 10 |
| High | 116 | 9 | 8 | 7 |
| Secondary MDS and CMML | ||||
| Low | 52 | 21 | 37 | 11 |
| Int-1 | 169 | 15 | 23 | 11 |
| Int-2 | 214 | 8 | 6 | 2 |
| High | 136 | 6 | 6 | 5 |
| CMML, WBC >12×109/L | ||||
| Low | 45 | 19 | 18 | 4 |
| Int-1 | 84 | 15 | 19 | 5 |
| Int-2 | 40 | 8 | 6 | NA |
| High | 7 | 8 | 0 | 0 |
| MDS and CMML: Eligible by IPSS criteria (with some extent of prior therapy) | ||||
| Low | 111 | 33 | 45 | 15 |
| Int-1 | 244 | 19 | 28 | 12 |
| Int-2 | 195 | 11 | 14 | 4 |
| High | 152 | 6 | 9 | 7 |
MDS indicates myelodysplastic syndrome; IPSS, International Prognostic Scoring System; CMML, chronic myelomonocytic leukemia; Int, intermediate; WBC, white blood cell; NA, not applicable.
Survival by cytogenetic abnormalities is shown in Table 3. Based on the survival analyses, these abnormalities subsequently were grouped into the following categories: 1) diploid or loss of chromosome Y, deletions in 5q or 20q only; 2) trisomy 8 alone or with 1 other abnormality; 3) abnormalities that involved <3 changes; and 4) chromosome 7 abnormalities or complex abnormalities that involved ≥3 changes.
TABLE 3.
Survival by Cytogenetic Category in the Study Group (N = 958)
| Pretreatment Cytogenetics | No. of Patients | Estimated Survival
|
||
|---|---|---|---|---|
| Median, Months | % At 3 Years | % At 6 Years | ||
| Diploid | 440 | 23 | 33 | 14 |
| Loss of Y chromosome | 14 | 19 | 19 | 19 |
| Deletion 5q only | 27 | 33 | 47 | 21 |
| Deletion 20q only | 21 | 17 | 34 | 8 |
| Other <3 abnormalities | 88 | 22 | 32 | 16 |
| Trisomy 8±1 abnormality | 49 | 15 | 20 | 4 |
| Any chromosome 7 abnormality± other | 196 | 7 | 2 | 1 |
| Complex ≥3 abnormalities | 123 | 7 | 9 | 6 |
± Indicates with or without.
Table 4 shows survival according to the prior MDS therapy. Patients who received prior transfusions had worse survival compared with other treatment groups. This led to grouping patients with any prior transfusions as 1 group to examine the effect of prior therapies.
TABLE 4.
Survival by Prior Treatment for Myelodysplastic Syndrome in the Study Group (N = 958)
| Prior Treatment for MDS | No. of Patients | Estimated Survival
|
||
|---|---|---|---|---|
| Median, Months | % At 3 Years | % At 6 Years | ||
| Growth factor only | 101 | 21 | 36 | 28 |
| Hypomethylating agents±other | 12 | 39 | 69 | 0 |
| Thalidomide±other | 22 | 16 | 37 | 19 |
| Other miscellaneous | 59 | 10 | 12 | 6 |
| Transfusions: Both erythrocytes and platelets | 87 | 5 | 11 | 4 |
| Transfusion: Either erythrocytes or platelets | 267 | 11 | 18 | 5 |
| No prior therapy | 410 | 18 | 26 | 12 |
MDS indicates myelodysplastic syndrome; ±, with or without.
Univariate and Multivariate Survival Analyses
In the univariate analysis, the following factors were significant for survival (P<.05): performance status, age, hemoglobin, platelets, bone marrow blasts, WBC count, bilirubin, bone marrow cellularity, prior chemotherapy for another malignancy, cytogenetic category, and prior MDS therapy (Table 5). The multivariate analysis, which included all of the factors listed above, selected the following as independent adverse prognostic factors: poor performance status ≥2 (Eastern Cooperative Oncology Group), older age, higher percent bone marrow blasts, anemia, thrombocytopenia, leukocytosis, chromosome 7 abnormalities or complex abnormalities (≥3 changes), and prior transfusions (Table 5).
TABLE 5.
Association Between Pretreatment Characteristics and Survival
| Characteristic | Adverse Category | Univariate P | Multivariate P | Coefficient |
|---|---|---|---|---|
| Age | Older | <.001 | <.001 | 0.023 |
| Bilirubin | Higher | .002 | NS | |
| Hemoglobin | Lower | <.001 | .004 | −0.063 |
| WBC | Higher | .002 | <.001 | 0.014 |
| Platelet | Lower | <.001 | <.001 | −0.002 |
| Bone marrow blasts, % | Higher | <.001 | <.001 | 0.028 |
| Cellularity | Higher | .0003 | NS | |
| Prior malignancy | Yes | <.001 | NS | |
| Performance status | ≥2 | <.001 | <.001 | 0.281 |
| Abnormality of cytogenetics | Chromosome 7 abnormalities, or complex (≥3 abnormalities) | <.001 | <.001 | 0.476 |
| Trisomy 8±1 other abnormality (diploid, deletion 5q only, deletion 20q only, loss of chromosome Y, other <3 abnormalities [baseline]) | .06 (NS) | NS | ||
| Prior treatment for MDS | Growth factors only | NS | NS | |
| Hypomethylating agents±others | NS | NS | ||
| Thalidomide±others | NS | NS | ||
| Other therapies (miscellaneous) | .008 | NS | ||
| Transfusions: Both erythrocytes and platelets | <.001 | <.001 | 0.248 | |
| Transfusion: Either erythrocytes or platelets | <.001 | .009 | 0.116 |
NS indicates not significant; WBC, white blood cells;±, with or without; MDS, myelodysplastic syndrome.
Because the IPSS is an established, commonly used classification and includes 3 important consistent prognostic factors (percent bone marrow blasts, karyotype, number of cytopenias), we performed a multivariate analysis that included the IPSS score as a single prognostic factor along with the other significant factors that were identified in univariate analysis. In addition to the IPSS, a backward, stepwise Cox proportional multivariate analysis selected the following poor prognostic factors: severe thrombocytopenia (any thrombocytopenia <100 × 109/L according to the IPSS), leukocytosis (this may account for CMML with leukocytosis), poor performance status, older age, chromosome 7 or complex abnormalities (≥3 changes; the IPSS underestimates the poor prognostic impact of adverse cytogenetic abnormalities in MDS),8 and prior transfusions. This suggests that the IPSS model may be improved by proposing a new model based on the above multivariate analysis. Other features, such as secondary MDS, prior treatment for other malignancies, and duration of AHD and MDS, were not selected (ie, were accounted for by the other independent factors). This suggests that the new risk model proposed would be applicable to any patient during the course of their disease, provided the analysis of prognosis is based on the variables present at that time point.
Proposed New MDS Risk Model
Based on the findings described above, we developed a risk model that included the factors identified as significant by multivariate analysis in the study group. To develop a simplified risk model that was easily applicable to the MDS community setting, we fitted the Cox regression model in which continuous variables were changed to indicator variables with different ranges (eg, age, platelets, etc) based on the calculation of a hazard ratio for each interval and on the inspection of Martingale residual plots. Estimated coefficients and their weighted points12 are shown in Tables 6 through 8.
TABLE 6.
Simplified Myelodysplastic Syndrome Risk Score (0–15 Points)*
| Prognostic Factor | Coefficient | Points |
|---|---|---|
| Performance status | ||
| ≥2 | 0.267 | 2 |
| Age, y | ||
| 60–64 | 0.179 | 1 |
| ≥65 | 0.336 | 2 |
| Platelets, ×109/L | ||
| <30 | 0.418 | 3 |
| 30–49 | 0.270 | 2 |
| 50–199 | 0.184 | 1 |
| Hemoglobin <12 g/dL | 0.274 | 2 |
| Bone marrow blasts, % | ||
| 5–10 | 0.222 | 1 |
| 11–29 | 0.260 | 2 |
| WBC >20 ×109/L | 0.258 | 2 |
| Karyotype: Chromosome 7 abnormality or complex ≥3 abnormalities | 0.479 | 3 |
| Prior transfusion, yes | 0.107 | 1 |
WBC indicates white blood cells.
Score points were obtained by dividing the coefficients by 0.15 and rounding to the nearest integer (see Breems 200512).
TABLE 8.
Estimated Overall Survival by 4 Levels of Prognostic Score Points
| Score | No. of Patients (%) | Survival
|
||
|---|---|---|---|---|
| Median, Months | % At 3 Years | % At 6 Years | ||
| 0–4 | 157 (16) | 54 | 63 | 38 |
| 5–6 | 227 (24) | 25 | 34 | 13 |
| 7–8 | 233 (24) | 14 | 16 | 6 |
| ≥9 | 341 (36) | 6 | 4 | 0.4 |
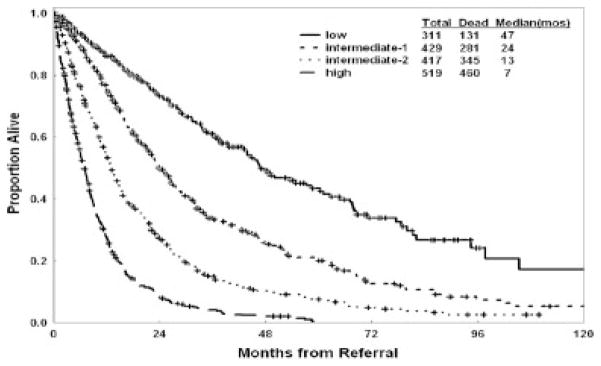
Four prognostic risk groups are proposed for the new risk model: 1) low risk (score 0–4; 16% of patients), in which patients have an estimated median survival of 54 months and a 3-year survival rate of 63%; 2) intermediate-1 risk (score 5–6; 24% of patients), in which patients have an estimated median survival of 25 months and a 3-year survival rate of 34%; 3) intermediate-2 risk (score 7–8; 24% of patients), in which patients have an estimated median survival of 14 months and a 3-year survival rate of 16%; and 4) high risk (score ≥9; 36% of patients), in which patients have an estimated median survival of 6 months and a 3-year survival rate of 4%. These groups are illustrated in Figure 3A. The proposed model was validated in the separate test group (Fig. 3B) (Table 9). The risk stratification of patients with newly diagnosed, untreated MDS is shown in Figure 4. Testing the new model within each IPSS subset was highly prognostic (Figs. 5A–D). Thus, the new MDS model added prognostic value to the IPSS. Testing the IPSS risk model within each of the 4 risk groups did not separate patients into different risk groups. Thus, the IPSS did not add any significance to the prognostic prediction of the new MDS model (Figs. 6A–D). Testing the new model within IPSS subsets in patients with primary MDS and no prior therapy (as in the original IPSS study) also was highly prognostic (Figs. 7A–D), although the numbers of patients in some subsets were small. This most likely is because of the addition of several new prognostic factors (age, performance status) and refinement of the cutoff levels for prognostic factors that were included in the original IPSS model (cytopenias, cytogenetic subsets). Testing the IPSS within each of the 4 risk groups of the new MDS model in patients with primary MDS and no prior therapy did not separate patients into different risk groups (data not shown).
FIGURE 3.

Survival according to the new prognostic myelodysplastic syndrome risk model in the study group (A) and in the test group (B).
TABLE 9.
Validation of the Proposed Prognostic Model
| Group/Proposed Risk | Estimated Survival
|
|||
|---|---|---|---|---|
| Median, Months | % At 3 Years | % At 6 Years | ||
| Test group | No. of Patients (%) | |||
| Low | 159 (17) | 45 | 58 | 29 |
| Int-1 | 228 (24) | 23 | 35 | 15 |
| Int-2 | 244 (25) | 13 | 15 | 6 |
| High | 326 (34) | 6 | 3 | 1 |
| CMML with WBC >12×109/L (1993–2005) | ||||
| Low | 20 (11) | 33 | 48 | 24 |
| Int-1 | 38 (22) | 19 | 17 | 5 |
| Int-2 | 53 (30) | 12 | 13 | 2 |
| High | 65 (37) | 8 | 6 | NA |
| Secondary MDS (1993–2005) | ||||
| Low | 53 (9) | 43 | 58 | 37 |
| Int-1 | 111 (19) | 19 | 25 | 11 |
| Int-2 | 155 (27) | 12 | 10 | 3 |
| High | 252 (44) | 6 | 3 | NA |
| Prior treatment for MDS (1993–2005): Eligible for IPSS group | ||||
| Low | 96 (14) | 38 | 52 | 35 |
| Int-1 | 188 (27) | 26 | 38 | 14 |
| Int-2 | 170 (24) | 14 | 19 | 8 |
| High | 248 (35) | 6 | 4 | 0 |
Int indicates intermediate; CMML, chronic myelomonocytic leukemia; WBC, white blood cells; NA, not available; MDS, myelodysplastic syndrome; IPSS, International Prognostic Scoring System.
FIGURE 4.

Survival according to the new prognostic myelodysplastic syndrome (MDS) risk model in patients with newly diagnosed, untreated, primary MDS (ie, those classified according to the original International Prognostic Scoring System).
FIGURE 5.

Survival according to the new prognostic myelodysplastic syndrome risk model in each of the 4 International Prognostic Scoring System risk subsets: low risk (A), intermediate-1 risk (B), intermediate-2 risk (C), and high risk (D).
FIGURE 6.

Survival according to the International Prognostic Scoring System (IPSS) in each of the 4 risk groups of the new proposed myelodysplastic syndrome model: low risk (A), intermediate-1 risk (B), intermediate-2 risk (C), and high risk (D).
FIGURE 7.

Survival according to the new prognostic myelodysplastic syndrome (MDS) risk model in each International Prognostic Scoring System subset among patients with primary MDS and no prior therapy: low risk (A), intermediate-1 risk (B), intermediate-2 risk (C), and high risk (D).
The New Risk Model and MDS/CMML Subsets of Interest
Significance of β-2 microglobulin levels
Previous studies by our group highlighted the prognostic significance of β-2 microglobulin levels in MDS and CMML.13,14 Levels of β-2 microglobulin were available from 1464 patients in the current study. Therefore, we applied the new proposed model to these subsets of patients. After accounting for the effect of the independent prognostic factors in the model, when β-2 microglobulin was entered as a new continuous variable, it did not retain prognostic significance (P = .08)
Application of the new MDS model in patients with <20% blasts
For this analysis, we used the accepted FAB and IPSS categorizations of MDS with the cutoff of 30% blasts to categorize MDS versus AML.4,6 The recent WHO classification proposed using >20% blasts as the cutoff for AML.5 Therefore, we validated the new MDS model in the 1676 patients with MDS defined as <20% bone marrow blasts (Fig. 8). Because the new model proposes the category of 11% to 29% blasts as an independent prognostic group (Table 6) it would have been expected and, in fact, was the case that the model was equally prognostic in this subset of patients with MDS defined by the presence of < 20% blasts.
FIGURE 8.
Survival according to the new prognostic myelodysplastic syndrome risk model in the subset of patients with <20% bone marrow blasts.
Application of the new MDS model in CMML with leukocytosis and secondary MDS
Because the outcome of patients who have CMML with leukocytosis and secondary MDS may be of interest to particular research involving such subsets, we also validated the new risk model in these 2 individual subsets, confirming its value and the outcome of the 4 prognostic subsets as predicted by the model. Among the 176 patients who had CMML and leukocytosis, the median survival of the low-risk, intermediate-1 risk, intermediate-2 risk, and high-risk patients were 33 months, 19 months, 12 months, and 8 months, respectively (P<.001) (Table 9). Among the 571 patients who had secondary MDS, the median survival was were 43 months, 19 months, 12 months, and 6 months, respectively (P<.001) (Table 9).
DISCUSSION
Recent studies have highlighted issues with the IPSS model in relation to the exclusion of many subgroups that now represent a large proportion of patients with MDS (eg, secondary MDS, CMML with leukocytosis) and its lack of applicability to most patients on investigational programs, because many would have received prior therapies and would have had MDS for a significant time. In this study of 1915 patients with MDS and CMML who were referred to our institution, only 507 patients (26%) could be classified by the IPSS.
Malcovati et al also emphasized the poor prognostic impact of prior transfusion requirement.7 Two other studies suggested that the IPSS cytogenetic categories could be improved upon and that the IPSS underestimated the adverse effect of some poor cytogenetic categories.8,9
To improve on the IPSS, Malcovati et al proposed a new risk model based on the WHO classification, the WHO Prognostic Scoring System (WPSS).15 By using a learning cohort of 426 patients and a validation cohort of 739 patients, they proposed a WPSS model that included 3 factors: 1) the WHO subgroups, 2) karyotype (as defined in the IPSS), and 3) transfusion requirements. This model may have some limitations: 1) It still excludes patients who have secondary MDS and CMML with leukocytosis; 2) the WHO classification may not be easily reproducible16,17; 3) the cytogenetic categories used in the model were those of IPSS and may not be optimal; 4) the study groups consisted of previously untreated patient, and patients who were receiving intensive chemotherapy of allogeneic transplantation at the time of transformation were censored (which would improve outcome artificially, because many of them would have had a poor short-term prognosis; 5) although age was evaluated in subset analyses, it was not incorporated into the risk model; and 6) the model may not account for several factors such as poor performance, severe thrombocytopenia, secondary disease, severe leukocytosis, or duration of MDS.
Our analysis confirmed some of the shortcomings of existing prognostic models. For example, although the IPSS still identified different prognostic groups of patients who had secondary MDS, CMML with leukocytosis, and MDS with prior therapy, the prognosis for the different risk groups (eg, low risk) in each of these entities was different (Table 2). Thus, patients with low-risk MDS according to the IPSS would have an estimated median survival almost half that of patients with primary, untreated MDS if they had received prior therapy (33 months vs 57 months) (Table 2). This highlights the problem of comparing different study groups on new therapies when the proportions of previously treated patients differ significantly. For instance, whereas the median survival of patients receiving decitabine in 1 study at our institution was 22 months, approximately 50% of patients had received prior therapy, and 20% had secondary MDS.18,19 In contrast, 2 studies of patients who were treated with azacitidine reported a median survival of 20 months, and 24 months, respectively.20,21 However, the proportion of patients that received prior therapies was only approximately 10% in each study. This also emphasizes the importance of randomized studies to overcome these issues and to allow for appropriate comparisons of different therapies. The proposed prognostic model may help improve our ability to compare such therapies short of randomized trials.
The current analysis of prognostic factors also attempts to address the issues with IPSS or WPSS by proposing a new risk model that considers age, percent of bone marrow blasts, severity of relevant cytopenias (anemia and thrombocytopenia), extent of prior therapy and transfusions, and adversity of cytogenetic abnormalities. The proposed model defines prognosis more precisely. For example, we demonstrated that age and performance status, factors that were not included in the IPSS, were independent adverse factors. Similarly, the cutoffs for thrombocytopenia and anemia were different along with the classification of karyotype, which, in multivariate analysis, identified only 2 adverse cytogenetic categories: any chromosome 7 abnormalities and abnormalities with ≥3 changes. Finally, the new model includes prior transfusions as an independent adverse factor in line with the findings of Malcovati et al.7,15 Whether the model was applied to all patients (Figs. 5A–D) or only to patients with untreated, primary MDS (Figs. 7A–D), it added to the prognostic value of IPSS within each IPSS risk group. In contrast, the IPSS did not improve the prognostic prediction within the new MDS risk groups (Figs. 6A–D). The proposed model also was validated in an independent test group (Fig. 3B).
The current analysis included duration of MDS and AHD as well as prior therapy as prognostic variables. These were variables superseded in the multivariate analysis by other factors that were interrelated closely, such as the intensity of cytopenias and the percent of bone marrow blasts. Thus, the new proposed risk model is applicable to individual patients throughout the course of their disease provided the risk is calculated based on the variables at that point in time. This will help account for all patients with MDS rather than subsets, to prognosticate on patients receiving therapy, to stratify patients on investigational studies, and to compare the benefit of new therapies in different trials. The proposed risk model allows now for such evaluations in any patient with MDS or CMML, regardless of the extent of prior therapy, duration of MDS, or whether MDS is primary or secondary.
It is worth noting the comparison of outcomes between patients who had primary, untreated MDS in our study group with the original IPSS study group. IPSS segregated patients with primary, untreated MDS in our study group, and the respective survival rates were quite similar in the IPSS versus this model (low risk, 5.6 years vs 4.7 years; intermediate-1 risk, 3.1 years vs 3 years; intermediate-2 risk, 1.2 years vs 1.3 years; high risk, 0.4 years vs 0.75 years). Moreover, the recent model added to the prognostic value of IPSS in each IPSS risk group (Figs. 7A–D), whereas the reverse analysis did not. Finally, the concordance rate between the proposed MDS model and the IPSS was only 50% (Table 10), indicating the additional value of the new MDS model.
TABLE 10.
Cross-tabulation of Patients With Primary Untreated MDS by IPSS and the New Proposed MDS Risk Model
| New MDS Model | IPSS Risk
|
Total | |||
|---|---|---|---|---|---|
| Low | Int-1 | Int-2 | High | ||
| Low | 58 | 75 | 18 | 0 | 151 |
| Int-1 | 11 | 62 | 43 | 10 | 126 |
| Int-2 | 4 | 24 | 55 | 30 | 113 |
| High | 0 | 1 | 40 | 76 | 117 |
| Total | 7 | 162 | 156 | 116 | 507 |
MDS indicates myelodysplastic syndrome; IPSS, International Prognostic Scoring System; Int, intermediate.
In summary, we propose a new risk model for patients with MDS and CMML that refines the prognostic precision of the IPSS and that is applicable to all such patients rather than only to patients with untreated primary MDS.
TABLE 7.
Estimated Overall Survival by Prognostic Scores
| Score | No. of Patients (%) | Survival
|
||
|---|---|---|---|---|
| Median, Months | % At 3 Years | % At 6 Years | ||
| Low | ||||
| 0–4 | 157 (16) | 54 | 63 | 38 |
| Int-1 | ||||
| 5 | 111 (12) | 30 | 40 | 14 |
| 6 | 116 (12) | 23 | 29 | 14 |
| Int-2 | ||||
| 7 | 127 (13) | 14 | 19 | 8 |
| 8 | 106 (11) | 13 | 13 | 4 |
| High | ||||
| 9 | 97 (10) | 10 | 10 | 2 |
| ≥10 | 244 (25) | 5 | 2 | 0 |
Int indicates intermediate.
Acknowledgments
Supported by the Leukemia Specialized Programs of Research Excellence grant 1 P50 CA 100632-04.
FUNDING STATEMENT:
ARTICLE ID : CNCR_23697
This article was supported by National Institute of Health ( P30 CA016672 ).
References
- 1.Faderl S, Kantarjian H. Myelodysplastic syndromes. In: DeVita V, Hellman S, Rosenberg S, editors. Cancer: Principles and Practice of Oncology. 7. Philadelphia: Lippincott Williams & Wilkins; 2005. pp. 2144–2154. [Google Scholar]
- 2.Faderl S, Kantarjian H. Novel therapies for myelodysplastic syndromes. Cancer. 2004;101:226–241. doi: 10.1002/cncr.20381. [DOI] [PubMed] [Google Scholar]
- 3.Hoffmann WK, Koeffler HP. Myelodysplastic syndrome. Annu Rev Med. 2005;56:1–16. doi: 10.1146/annurev.med.56.082103.104704. [DOI] [PubMed] [Google Scholar]
- 4.Bennett JM, Catovsky D, Daniel MT, et al. Proposals for the classification of the myelodysplastic syndromes. Br J Heamatol. 1982;51:189–199. [PubMed] [Google Scholar]
- 5.Harris NJ, Jaffe ES, Diebold J, et al. World Health Organization lymphoid tissues: report of the Clinical Advisory Committee meeting, Airlie House, Virginia, November 1977. J Clin Oncol. 1999;17:3835–3849. doi: 10.1200/JCO.1999.17.12.3835. [DOI] [PubMed] [Google Scholar]
- 6.Greenberg P, Cox C, LeBeau MM, et al. International scoring system for evaluating prognosis in myelodysplastic syndromes. Blood. 1997;89:2079–2088. [PubMed] [Google Scholar]
- 7.Malcovati L, Della Porta M, Pascutto C, et al. Prognostic factors and life expectancy in myelodysplastic syndromes classified according to WHO criteria: a basis for clinical decision-making. J Clin Oncol. 2005;23:7594–7603. doi: 10.1200/JCO.2005.01.7038. [DOI] [PubMed] [Google Scholar]
- 8.Haase D, Germing U, Schanz J, et al. Evidence for an underestimation of the prognostic impact of poor cytogenetics within the IPSS [abstract] Blood. 2006;108:79a, Abstract 252. [Google Scholar]
- 9.Haase D, Germing U, Schanz J, et al. New and comprehensive cytogenetic prognostication and categorization in MDS [abstract] Blood. 2006;108:77a, Abstract 248. [Google Scholar]
- 10.Cox D. The Analysis of Binary Data. London: Chapman & Hall; 1970. pp. 87–90. [Google Scholar]
- 11.Cox D. Regression models and life tables. J R Stat Soc B. 1972;34:187–220. [Google Scholar]
- 12.Breems DA, VanPutten W, Huijgens PC. Prognostic index for adult patients with acute myeloid leukemia in first relapse. J Clin Oncol. 2005;23:1969–1978. doi: 10.1200/JCO.2005.06.027. [DOI] [PubMed] [Google Scholar]
- 13.Gatto S, Ball G, Francesco O, et al. Contributions of β-2 microglobulin levels to the prognostic stratification of survival in patients with myelodysplastic syndrome. Blood. 2003;102:1622–1625. doi: 10.1182/blood-2002-10-3264. [DOI] [PubMed] [Google Scholar]
- 14.Onida F, Kantarjian H, Smith T, et al. Prognostic factors and scoring systems in chronic myelomonocytic leukemia: a retrospective analysis of 213 patients. Blood. 2002;99:840–849. doi: 10.1182/blood.v99.3.840. [DOI] [PubMed] [Google Scholar]
- 15.Malcovati L, Germing U, Kuendgen A, et al. Time-dependent prognostic scoring system for predicting survival and leukemic evolution in myelodysplastic syndromes. J Clin Oncol. 2007;25:3503–3510. doi: 10.1200/JCO.2006.08.5696. [DOI] [PubMed] [Google Scholar]
- 16.Pfeilstocker M, Resiner R, Nosslinger T, et al. Cross-validation of prognostic scores in myelodysplastic syndromes in 386 patients from a single institution confirms importance of cytogenetics. Br J Haematol. 1999;106:455–463. doi: 10.1046/j.1365-2141.1999.01559.x. [DOI] [PubMed] [Google Scholar]
- 17.Sole F, Luno E, Sanzo C, et al. Identification of novel cytogenetic markers with prognostic significance in a series of 968 patients with primary myelodysplastic syndromes. Haematologica. 2005;90:1168–1178. [PubMed] [Google Scholar]
- 18.Kantarjian H, Oki Y, Garcia-Manero G, et al. Results of a randomized study of 3 schedules of low-dose decitabine in higher-risk myelodysplastic syndrome and chronic myelomonocytic leukemia. Blood. 2007;109:52–57. doi: 10.1182/blood-2006-05-021162. [DOI] [PubMed] [Google Scholar]
- 19.Kantarjian H, O’Brien S, Huang X, et al. Survival advantage with decitabine versus intensive chemotherapy in patients with higher risk myelodysplastic syndrome. Cancer. 2007;109:1133–1137. doi: 10.1002/cncr.22508. [DOI] [PMC free article] [PubMed] [Google Scholar]
- 20.Silverman LR, Demakos EP, Peterson BL, et al. Randomized controlled trial of azacitidine in patients with the myelodysplastic syndrome: a study of the Cancer and Leukemia Group B. J Clin Oncol. 2002;20:2429–2440. doi: 10.1200/JCO.2002.04.117. [DOI] [PubMed] [Google Scholar]
- 21.Fenaux P, Mufti G, Santini V, et al. Azacitidine (AZA) treatment prolongs overall survival (OS) in higher-risk MDS patients compared with conventional cure regimens (CCR): results of the AZA-001 phase III study [abstract] Blood. 2007;110:250a, Abstract 817. [Google Scholar]