

Abstract
The neurotrophic peptide PACAP (pituitary adenylate cyclase-activating polypeptide) elevates cAMP in PC12 cells. Forskolin and dibutyryl cAMP mimic PACAP’s neuritogenic and cell morphological effects, suggesting that they are driven by cAMP. Comparison of microarray expression profiles after exposure of PC12 cells to either forskolin, dibutyryl cAMP, or PACAP revealed a small group of cAMP-dependent target genes. Neuritogenesis induced by all three agents is protein kinase A (PKA)-independent [not blocked by N-[2-(4-bromocinnamylamino)ethyl]-5-isoquino-line (H89)] and extracellular signal-regulated kinase (ERK)-dependent [blocked by 1,4-diamino-2,3-dicyano-1,4-bis(methylthio) butadiene (U0126)], and therefore cAMP-dependent target genes potentially mediating neuritogenesis were selected for further analysis based on the pharmacological profile of their induction by PACAP (i.e., mimicking that of neuritogenesis). Small interfering RNA (siRNA) targeting one of these genes, Egr1, blocked PACAP-induced neuritogenesis, and siRNA targeting another, Vil2, blocked a component of the cell size increase elicited by PACAP. Neither siRNA blocked PACAP’s PKA-dependent antiproliferative effects. PACAP signaling to neuritogenesis was also impaired by dominant-negative Rap1 expression but was not affected by inhibition of protein kinase C (PKC), indicating a G-protein-coupled receptor-mediated differentiation pathway distinct from the one activated by receptor tyrosine kinase ligands such as nerve growth factor (NGF), that involves both Rap1 and PKC. We have thus identified a cAMP-dependent, PKA-independent pathway proceeding through ERK that functions to up-regulate the transcription of two genes, Egr1 and Vil2, required for PACAP-dependent neuritogenesis and increased cell size, respectively. Dominant-negative Rap1 expression impairs both PACAP-induced neuritogenesis and Egr1 activation by PACAP, suggesting that cAMP elevation and ERK activation by PACAP are linked through Rap1.
Neurotrophic factors activating receptor tyrosine kinases, such as nerve growth factor (NGF), promote neurite extension through a cAMP-independent signaling pathway involving Ras, PKC, and ERK (Ginty et al., 1991; Vaudry et al., 2002b), although other effects of NGF, such as induction of sodium channel expression, do require cAMP (Ginty et al., 1992; Yao et al., 1998). A significant literature also implicates cAMP in a broad range of neuronal differentiation responses, including neuritogenesis, survival, regeneration, repair, and expression of genes encoding neuron-specific proteins, such as neurotransmitter biosynthetic enzymes, neuropeptides, receptors, and ion channels (Qiu et al., 2002), although the effects of first messengers that regulate cAMP generation in differentiating neurons have not been studied as extensively as receptor tyrosine kinase-stimulating neurotrophins such as NGF. The neuropeptide PACAP has garnered significant interest in this regard, because PACAP is neuritogenic upon exposure to PC12 cells (Deutsch and Sun, 1992), enhances neuronal survival of cerebellar granule cells (Kienlen Campard et al., 1997) and PC12 cells (Tanaka et al., 1996), and is neuroprotective after ischemic injury to the brain (Reglodi et al., 2000; Chen et al., 2006; Ohtaki et al., 2006).
PACAP signaling in PC12 cells leading to neuritogenesis is distinct from that of NGF. Both processes require ERK activation, but only NGF activation of ERK is Ras-dependent (Lazarovici et al., 1998). A number of transcripts induced by PACAP in PC12 cells are both ERK-dependent (blocked by U0126) and insensitive to PKA inhibition (by H89) (Vaudry et al., 2002a) and some of these are also induced by forskolin even in the presence of H89 (Gerdin and Eiden, 2007). We therefore hypothesized that PACAP signaling to ERK to initiate neurite formation might proceed through a noncanonical (PKA-independent) cAMP-dependent signaling pathway. In pursuit of this hypothesis, we screened PACAP target genes in PC12 cells also induced by forskolin and dibutyryl cAMP whose regulation is both ERK-dependent and independent of activation of protein kinase A, and whose transcription might be required for various aspects of differentiation induced by PACAP.
Rap1 is a potential regulator of ERK that can be activated by cAMP through both PKA-dependent and -independent pathways (York et al., 1998; Gerdin and Eiden, 2007). Maximal activation of total cellular Rap1 by PACAP in PC12 cells requires the participation of a number of protein kinases (Bouschet et al., 2003), and a Src-dependent activation of Rap1 initiated by cAMP and mediated by PKA has been identified in PC12 cells (Obara et al., 2004). However, the functional significance of Rap1 activation by each of these pathways, particularly for neuritogenesis, has not yet been addressed. Thus it is established in PC12 cells that PACAP elevates cAMP; that cAMP can activate Rap1; that Rap1 activation can persistently stimulate total cellular ERK; and that constitutively active ERK can drive neuritogenesis (Deutsch and Sun, 1992; Vossler et al., 1997; Yao et al., 1998; York et al., 1998; Harada et al., 2001; Stessin et al., 2006). However, a coherent signaling mechanism underlying PACAP-induced PC12 cell differentiation remains to be elucidated. Here, we address two key questions toward this end. First, which PACAP-initiated differentiating responses of PC12 cells are mimicked by cAMP, and which of these require PKA? Second, does PACAP activate a cohort of genes in PC12 cells that are also activated by elevation of cAMP alone, and does abrogation of expression of any of these transcripts affect the PACAP-induced functional differentiative responses of neuritogenesis, increased cell size, and cessation of proliferation? The experimental answers to these questions provide a mechanism for PACAP-induced neuritogenesis involving cAMP-initiated, PKA-independent activation of ERK, and subsequent expression of specific genes that drive distinct components of the differentiation program. These signaling mechanisms may also be relevant for cAMP-dependent signaling for differentiation by first messengers acting through other G-protein coupled receptors besides the PACl receptor activated by PACAP in PC12 cells.
Materials and Methods
Drugs
PACAP and VIP were purchased from Phoenix Pharmaceuticals (Mountain View, CA). Chelerythrine, dbcAMP, forskolin, H89, NGF, and poly-L-lysine were obtained from Sigma (Saint Louis, MO). PD98059, H7, and 2′,5′-dideoxyadenosine were from Calbiochem (San Diego, CA), and U0126 was purchased from either Cal-biochem or Promega (Charbonnières, France).
Cell Culture
The PC12 cell clone PC12-G (Rausch et al., 1988) was grown in Dulbecco’s modified Eagle’s medium (Invitrogen, Carlsbad, CA) supplemented with 7% heat-inactivated fetal bovine serum (Sigma), 7% horse serum (Lonza Bioscience, Walkersville, MD), 2.5% HEPES (Invitrogen), 1% glutamine (Invitrogen), 100 units/ml penicillin, and 100 μg/ml streptomycin (Invitrogen) at 37°C in a 10% CO2/90% air humidified atmosphere. Two days before treatment, cells were replated on poly-L-lysine–coated Petri dishes (Costar; Corning Life Sciences, Acton, MA). When used, inhibitors were added 30 min before exposure to PACAP, forskolin, or dbcAMP.
Quantitative Analysis of Neurite Outgrowth
Two days after treatment, images of PC12 cells were randomly acquired on a computer-assisted microscope [IPLab from BD Biosciences Bioimaging (Rockville, MD) and Metamorph from Molecular Devices, (Sunnyvale, CA)]. Differentiation was investigated on more than 22,000 cells by measuring neurite length. The percentage of cells bearing neurites was quantified, the number of neurites per cell was counted, and the total neurite outgrowth for each cell was measured. Neurites were defined as cell processes greater than 6 μm, to eliminate inadvertent counting of cell membrane ruffling or irregularities as neurites.
Quantification of Cell Number and Measurement of Cell Size
Two days after treatment, cells were washed with phosphate-buffered saline and detached by incubation with Accutase (Innovative Cell Technologies, La Jolla, CA) at 37°C for 15 min. Cell size and number were measured with a cell counter (Z2; Beckman Coulter, Fullerton, CA) with lower and upper limits set to 10 and 17 μm, respectively. Preliminary experiments demonstrated that a 17-μm cutoff on the cell-counting instrument (above) provided the most sensitive and reliable indicator of changes in PC12 cell volume after treatment for two days with PACAP (100 nM). A dose response with graded concentrations of PACAP and VIP (10 pM–1 μM) confirmed that a 17-μm cutoff provided results that correlated well with a direct measurement of the cell diameter (Fig. 1C).
Fig. 1.

Effect of PACAP-38 and VIP on PC12 cell differentiation. A, microphotographs illustrating the neurite extension observed after 48 h of treatment with PACAP (100 nM) or VIP (100 nM). Scale bar, 15 μm. B, quantification of the percentage of cells with neurites, number of neurites per cell, and total neurite outgrowth after treatment with graded concentrations of PACAP or VIP (10 pM–1 μM). C, quantification of the median diameter of PC12 cells (micrometers) and the percentage of cells with a diameter above 17 μm after 48 h of treatment with graded concentrations of PACAP or VIP (10 pM–1 μM). D, quantification of the effect of graded concentrations of PACAP or VIP (10 pM–1 μM) on PC12 cell proliferation. * P < 0.05, **P < 0.01, *** P < 0.001 versus control.
cAMP Quantification
30 min after treatment, cAMP production was quantified with a [3H]cAMP assay kit (Amersham, Chalfont St. Giles, Buckinghamshire, UK) as described previously (Hamelink et al., 2002).
Western Blot Analysis
Proteins contained in PC12 cells were extracted in lysis buffer consisting of 1% Triton X-100, 50 mM Tris-HCl, and 10 mM EDTA. The homogenate was centrifuged (14,000g, 4°C, 15 min), and proteins contained in the supernatant were precipitated at 4°C by addition of ice-cold 10% trichloroacetic acid. The extract was centrifuged (12,000g, 4°C, 15 min) and washed three times with ether/alcohol [70:30 (v/v)]. The pellet was denatured in 50 mM Tris-HCl, pH 7.5, containing 20% glycerol, 0.7 M 2-β-mercaptoethanol, 0.002% (w/v) bromphenol blue and 3% (w/v) SDS at 100°C for 5 min, and electrophoresed on a 10% SDS-PAGE gel. After separation, proteins were electrically transferred onto a nitrocellulose membrane (Amersham). The membrane was incubated with blocking solution (0.5% bovine serum albumin and 2% milk in Tris-buffered saline containing 0.05% Tween 20) at room temperature for 1 h, and developed with antibodies against phosphorylated and total cellular ERK (Promega) using a chemiluminescence detection kit (ECL System; Amersham). Autoradiographic films were quantified using an image analysis system (Biocom, Les Ulis, France).
Rap1 Activation Assay
Fusion protein GST-Ral-RBD produced in Escherichia coli in the presence of isopropyl β-D-thiogalactopy-ranoside was a generous gift from Dr. Michel Philippe (Centre National de la Recherche Scientifique, UnitéMixte de Recherche 6187, University of Poitiers, France). The bacterial pellet was suspended in sodium-Tris-EDTA buffer (10 mM Tris, pH 8.0, 150 mM NaCl, and 1 mM EDTA) in the presence of (1 mg/ml lysozyme and protease inhibitors 10 μg/ml trypsin inhibitor, 1 mM phenylmethylsulfonyl fluoride, 10 μg/ml aprotinin, and 10 μg/ml leupeptin), 1 mM dithiothreitol, and 1.5% N-lauryl sarcosyl. The protein was affinity purified by incubation at 4°C overnight with glutathione Sepharose 4B beads.
Rap-GTP activity was assayed as GTP-dependent binding to GST-Ral-RBD with a pull-down assay. Cells treated with PACAP were rinsed rapidly with phosphate-buffered saline and lysed in 10% glycerol, 1% Nonidet P-40, 50 mM Tris-HCl, 200 mM NaCl, 2.5 mM MgCl2, and 10 mM NaF in the presence of protease inhibitors (1 mM orthovanadate, 0.1 μM aprotinin, 250 μM phenylmethylsulfonyl fluoride, and 1 μM leupeptin). For each sample, 400 μl of lysate was incubated for 1 h at 4°C with glutathione Sepharose 4B beads coupled with GST-Ral-RBD. Beads were washed three times with lysis buffer before addition of electrophoresis buffer and 5% β-mercapto-ethanol. The proteins were denatured at 100°C for 5 min before electrophoresis on 10% polyacrylamide gels in 0.1% SDS, Tris-glycine running buffer. After separation, proteins were transferred electrophoretically onto a nitrocellulose membrane. The membrane was incubated with blocking solution (0.5% bovine serum albumin, 2% nonfat dry milk) at room temperature for 1 h and developed with antibodies against Rap (Santa Cruz Biotechnology, Inc., Santa Cruz, CA), using a chemiluminescence detection kit (ECL System; Amersham). Autoradiographic films were quantified with an image analysis system (Biocom).
Rap1b Dominant-Negative Vector
Rap1b DN (S17N) cloned into pcDNA 3.1(+) was a generous gift from Dr. Elisabeth Bock (Protein Laboratory, Institute of Molecular Pathology, University of Copenhagen, Denmark). The Rap1b DN insert was first subcloned into the pIRES2-eGFP vector (Clontech, Mountain View, CA) and the Rap1b DN-IRES-eGFP was subsequently cloned upstream of eGFP into the lentivirus packageable genome pRRLsin.CMV.eGFP-wpre as an XbaI-BamHI fragment.
Viral particles were generated by transient cotransfection of the packageable genome with gag/pol and vesicular stomatitis virus envelope expression plasmids in the 293T cell line. Forty-eight hours later, the culture medium containing the viral particles was collected, filtered, and added to PC12 cells. After overnight exposure to the viral particles, cells were washed twice with fresh medium. Forty-eight hours later, Rap1b DN-IRES-eGFP infected cells stably expressing the transduced proteins were identified under a fluorescent microscope. Cells transduced with a pRRLsin.CMV.GFPpre vector were used as a control.
RNA Isolation, Microarray Experiments, and Data Analysis
After 6 h of treatment, total RNA was extracted with TRIzol reagent (Invitrogen) and further purified with the RNeasy Mini Kit (QIAGEN, Valencia, CA). The RNA concentration was measured by absorbance at 260 nm, and RNA integrity was confirmed by denaturing gel electrophoresis.
The cDNA sequences used in this study were issued from the NIA Mouse 15K cDNA clone set (see http://lgsun.grc.nia.nih.gov/cDNA/15k.html for details). PCR products generated from these clones were printed onto polylysine-coated glass slides at the National Human Genome Research Institute microarray facility. Fluorescence-labeled cDNA was synthesized from 10 μg of RNA from treated or untreated PC12 cells, with the SuperScript First Strand Synthesis System for RT-PCR (Invitrogen) in the presence of amine-modified random primers and aminoallyl-dUTP/dNTP. Probes were then labeled with N-hydroxy-succinimide ester dye Cy3 or Cy5 (Amersham). After denaturation, purified Cy3/Cy5-labeled cDNA samples were combined and hybridized on a microarray slide in a humidified chamber (Corning Life Sciences) at 65°C overnight in the presence of 5× saline-sodium citrate (SSC), 0.1% SDS, 25% formamide and polyA (25 ng/μl). Before scanning at 532 nm for Cy3 and 633 nm for Cy5 (Agilent Technologies, Foster City, CA), slides were successively washed at room temperature in 0.5× SSC/0.1% SDS for 2 min, 0.5× SSC for 2 min (twice), and 0.06× SSC for 2 min. The two fluorescent images obtained from the scanner were analyzed using the IPLab software. The data from 37 successful experiments were entered into the FileMaker Pro 5 software (FileMaker, Santa Clara, CA) to cluster the genes regulated in the various experimental conditions and to conduct a functional analysis. Genes were included as induced by a given treatment if 1) all values in the data set had a quality index of >0.3 for the combined ratio value and 2) the mean induction value was >1.5 fold.
Real-Time PCR Experiments
Total RNA was extracted with TRIzol and further purified using the RNeasy Mini Kit (QIAGEN). Contaminating genomic DNA was removed by treatment with DNase I (QIAGEN), and cDNA was synthesized from 5 μg of RNA using the ImProm II Reverse Transcriptase (Promega). Real-time PCR was performed on cDNA in the presence of a 1× Mastermix (Applied Biosystems, Courtaboeuf, France) containing preset concentrations of dNTPs, MgCl2, and the SYBR Green reporter dye along with specific primers, using the ABI Prism 7000 Sequence Detection System (Applied Biosystems). Each primer set designed with the Primer Express software (Applied Biosystems) was used at its optimal concentration with a maximal efficacy as reported in Table 1. The cDNA-generated signals for target genes were internally corrected with that of glyceraldehyde-3-phosphate dehydrogenase (Gapdh) cDNA signal for variations in amounts of input mRNA. Gene expression level was then compared with a corresponding control sample group and the level of regulation was determined with the 2ΔΔΔCt method according to Applied Biosystems instructions.
TABLE 1.
Sequences of primers used for real-time PCR
Concentration was 300 nM unless noted otherwise.
| Genes
|
Primer Sequences
|
||
|---|---|---|---|
| Symbol | Name | Forward | Reverse |
| Akr1b8 | Aldo-keto reductase family 1, member B8 | 5′-CAA GCC TGG ACT GAA ACA TAA GC-3′ | 5′-ATC AGT TTT TCC TGG GTG AGG TAA G-3′ |
| Anxa2 | Annexin A2 | 5′-GAC ATT GCC TTC GCC TAC CA-3′ | 5′-TGA CCA GAC AAG GCC GAC TT-3′ |
| Azin1 | Antizyme inhibitor 1 | 5′-AAG ACG CTT TAC CCG ACT CTT TG-3′ | 5′-TAT CAT CAG CTA GGT TCC CAA GGT-3′ |
| Egr1a | Early growth response 1 | 5′-GGG AGC CGA GCG AAC AA-3′ | 5′-GTC TCC ACC AGC GCC TTC T-3′ |
| Gapdh | Glyceraldehyde-3-phosphate dehydrogenase | 5′-TCC CAT TCC TCC ACC TTT GA-3′ | 5′-CAG GAA ATG AGC TTC ACA AAG TTG-3′ |
| Gas1 | Growth arrest specific 1 | 5′-AAT ACA ATG TTT AAG GCA GTT TGG AA-3′ | 5′-AGG TGT GCC CTG TGT AGA AGA AC-3′ |
| Gata2 | GATA binding protein 2 | 5′-CAC CTG TTG TGC AAA TTG TCA GA-3′ | 5′-GGA TCC CTT CCT TTC TTC ATG-3′ |
| Glrx | Glutaredoxin | 5′-CCA ATG CGA TTC AAG ATT ATT TAC A-3′ | 5′-CGC CTA TGC AGT CTT TTA CCT ATG A-3′ |
| Homer2 | Homer homolog 2 (Drosophila) | 5′-CGA TGT CAC CAG GAA CAG CTA TC-3′ | 5′-GGG TGA TGG TGC TGT TTA TGA TT-3′ |
| Hspb8 | 22-kDa Heat shock protein 8 | 5′-GCC GGA AGA ACT GAT GGT AAA G-3′ | 5′-GAG ACA ATC CCA CCT TCT TGC T-3′ |
| Ier3 | Immediate early response 3 | 5′-GAG GAA CCC AAC ATT GCC AA-3′ | 5′-ACC TTC TTC AGC CAT CAA AAT CTG-3′ |
| Nrp1 | Neuropilin 1 | 5′-CGG AGG AGT GTT CTG TCG CTA T-3′ | 5′-TCC GGC CAG GAG TTT TCT G-3′ |
| Odc1 | Ornithine decarboxylase, structural 1 | 5′-CCA GCA GGC TTC TCT TGG GAA-3′ | 5′-CAC GAA GGT CTC AGG GTC AGT AC-3′ |
| Pac-1 | Adenylate cyclase activating polypeptide 1 receptor 1 | 5′-CCC TGA CTG CTC TCC TCC TGC TGC CTA T-3′ | 5′-CAG GGC AGC TCA CAA GGA CCA TCT CAC C-3′ |
| Por | Cytochrome P450 oxidoreductase | 5′-ACG GGA ACT TGG AAG AGG ATT T-3′ | 5′-TGG CTT CTA CCC CAA AGA ACT C-3′ |
| Ptp4a1 | Protein tyrosine phosphatase 4a1 | 5′-TCG TGA AGA ACC TGG TTG CTG-3′ | 5′-TTA ATG CTA GGG CAA CAA GCA C-3′ |
| Rgs2 | Regulator of G-protein signaling 2 | 5′-CCG ACT TCA TCG AGA AGG AA-3′ | 5′-GCA GCC ACT TGT AGC CTC TT-3′ |
| Vil2 | Villin 2 | 5′-GAC GAC CGT AAC GAG GAG AA-3′ | 5′-CTG GGA CAA CTC ATT GCT CA-3′ |
Concentration = 100 nM.
siRNA Experiments
Transfection of siRNA into PC12 cells was performed with the Amaxa Nucleofector (Amaxa, Koeln, Germany) according to the instructions of the manufacturer. In brief, 2 × 10⁶ cells were resuspended into 120 μl of Nucleofector solution containing 20 μg of siRNA. Immediately after electroporation, fresh medium was added, and cells were cultivated at 37°C in a 10% CO2/90% air incubator. Several siRNA were designed and tested to inhibit immediate early response 3 (Ier3), villin 2 (Vil2), and early growth response 1 (Egr1) gene expression (Hp flexible siRNA; QIAGEN). The sequences of the siRNA used for the experiments presented in this study were CAA CGC TAA CTC AGA ACA CTA for Ier3, AGC GAT AAT ATG GGT TTG TAA for Vil2, AAG GCG CTG GTG GAG ACA AGT for Egr1-siRNA1, ATT GTA CTA TTT GGA GTT AAA for Egr1-siRNA2, and CAA ACC AAT GGT GAT CCT CTA for Egr1-siRNA3.
The specificity of the effect of Egr1 siRNA on cell differentiation was confirmed using three different sequences (Egr1-siRNA1, 2 and 3), which all reduced Egr1 mRNA levels as well as PACAP-induced neuritogenesis. Egr1-siRNA1 was chosen for further work. The capacity of Egr1 siRNA1 to specifically reduce its cognate mRNA was confirmed by measuring its effect on induction of Egr1 mRNA, and three other mRNAs (Ier3, Odc, and Rgs2) by 100 nM PACAP. Egr1 siRNA1 decreased only the expression of its cognate mRNA target. Further testing of Egr1 and Vil2 siRNAs against their cognate mRNAs likewise revealed no off target effects of these siRNAs.
Luciferase Assay
PC12 cells were transiently transfected using Lipofectamine 2000 (Invitrogen) with the firefly luciferase pEgr-1-Luc cis-reporter plasmid containing three copies of the Egr-1 enhancer GGGGTGGGGN (Stratagene, La Jolla, CA) and the Renilla reniformis luciferase phRL-null vector (Promega) in the presence or absence of the Rap1b dominant-negative expression vector. After transfection overnight, cells were treated for 6 h with PACAP (100 nM) or vehicle and collected in passive lysis buffer (Promega), and relative luciferase activity was determined using the dual-luciferase reporter assay (Promega) per manufacturer’s instructions.
Statistical Analysis
Data are presented as the mean ± S.E.M. from at least three independent experiments performed in triplicate, except for the histograms reporting the percentage of cells with a diameter >17 μm in Fig. 11, which are the mean ± S.E.M. from a representative experiment that was repeated 4 times. Unless otherwise stated, statistical analyses were conducted using a Kruskal-Wallis test, followed by Dunn’s post tests or by the Mann-Whitney test using Prism software (GraphPad Software, San Diego, CA).
Fig. 11.

Involvement of immediate early response 3 (Ier3), villin 2 (Vil2), and early growth response 1 (Egr1) in PC12 cell differentiation. A, effects of specific siRNA on Ier3, Vil2, and Egr1 mRNA expression. Cells were transfected in the absence or presence of specific siRNA targeting either Ier3, Vil2, or Egr1, and 2 days after transfection, cells were treated with control medium or PACAP (100 nM) for 6 (Ier3, Vil2) or 1 (Egr1) h. The level of expression of Ier3, Vil2, and Egr1 mRNA was then quantified by real-time PCR. Data were corrected using Gapdh signal as internal control. B, microphotographs illustrating the effect of siRNA against Ier3, Vil2, and Egr1 mRNA on cell differentiation after 48 h of treatment with PACAP (100 nM). C–E, quantification of the total neurite outgrowth (left), percentage of cells with a diameter greater than 17 μm (middle), and cell proliferation (right) after 48 h of treatment with 100 nM PACAP in the absence or presence of siRNA against Ier3 (C), Vil2 (D) or Egr1 (E) mRNA. *, P < 0.05; **, P < 0.01; ***, P < 0.001; ns versus respective controls; #, P < 0.05; ###, P < 0.001; NS versus PACAP; ns, not statistically significant from control; NS, not significantly different.
Results
Concentration and Duration of PACAP Treatment Required for PC12 Cell Neuritogenesis, Increased Cell Size, and Cessation of Proliferation. As a prelude to identifying the signaling pathways underlying PC12 cell differentiation, the effective doses and duration of treatments required for PACAP-induced neuritogenesis, increased cell size and cessation of cell proliferation were determined. PACAP-38 (similar results were obtained with PACAP-27; data not shown) increased the percentage of cells with neurites, number of neurites per cell, and total neurite length with a maximum effect by 1 nM PACAP (Fig. 1, A and B). PACAP effects on cell diameter (increased cell diameter and percentage of cells with a diameter >17 μm), and cessation of cell proliferation required somewhat higher concentrations (maximal effects were achieved by approximately 10 nM; Fig. 1, C and D). VIP acted only at concentrations above 100 nM, consistent with the expression of PAC1, but not VPAC1 or VPAC2 receptor transcripts, in PC12-G cells (Ravni et al., 2006). Differences in PACAP potency to stimulate neurito-genesis and to increase cell size or decrease proliferation suggest that these effects are mediated by distinct signaling pathways. The minimum time of exposure to PACAP required for a full PACAP response 48 h later, however, was similar for neuritogenesis and cell growth arrest (Fig. 2, A and B), indicating that 1 to 6 h was an appropriate temporal window for examining cellular transcriptional changes elicited by PACAP that are likely to underlie neuritogenesis, altered cell size, or cessation of cell growth.
Fig. 2.

Kinetic of the effect of PACAP on PC12 cell differentiation. A, cells were exposed to PACAP (100 nM) for durations ranging from 1 min to 48 h and the percentage of cells with neurites, number of neurites per cell, and total neurite outgrowth was measured 48 h after the beginning of the treatment. B, cells were exposed to PACAP (100 nM) for durations ranging from 1 min to 48 h, and cell quantification was performed 48 h after the beginning of the treatment. **, P < 0.01, *** P < 0.001 versus control.
PACAP and cAMP—Similar Inhibitor Profile for Separate Aspects of PC12 Cell Differentiation
PAC1 receptors are positively coupled to adenylate cyclase (Harmar et al., 1998), and cAMP is therefore a prime candidate for the second messenger effecting changes in cell morphology and function. The cellular and biochemical profiles for PC12 cell differentiation induced by forskolin (25 μM), an adenylate cyclase stimulator, and dibutyryl cAMP (10 mM), which generates cAMP upon intracellular hydrolysis, were compared with that of 100 nM PACAP. All three agents induced neuritogenesis within 48 h of exposure that was unaffected by pretreatment with the protein kinase A inhibitor H89 and blocked by the MEK inhibitor U0126 (Fig. 3, A and B). The effect of PACAP and forskolin on cell size persisted in the presence of H89 (Fig. 3C). In contrast, the growth arrest activity of PACAP was significantly reduced, and that of forskolin totally abolished, in the presence of H89 (Fig. 3D). Finally, the adenylate cyclase inhibitor 2′,5′-dideoxyadenosine inhibited PACAP-induced cAMP production (Fig. 4A) and significantly reduced the effect of PACAP on neurite outgrowth (Fig. 4, B and C) and cell proliferation (Fig. 4D).
Fig. 3.

Effect of cAMP stimulators on PC12 cell differentiation. A, microphotographs illustrating the effect of PACAP (100 nM), forskolin (25 μM), or dbcAMP (1 mM) on PC12 cells after 48 h of treatment. When indicated, a PKA inhibitor, H89 (10 μM), or a MEK inhibitor, U0126 (25 μM), was added 30 min before PACAP, forskolin, or dbcAMP. Scale bar, 16 μM. B, quantification of the percentage of cells with neurites, number of neurites per cell and total neurite outgrowth after 48 h of treatment of PC12 cells with PACAP (100 nM) or forskolin (25 μM) in the absence or presence of H89 (10 μM). C, quantification of the percentage of cells with a diameter above 17 μm after 48 h of treatment with PACAP (100 nM) and forskolin (25 μM) in the absence or presence of H89 (10 μM). D, quantification of the effect of a 48-h treatment with PACAP (100 nM) and forskolin (25 μM) in the absence or presence of H89 (10 μM) on cell proliferation. *, P < 0.05; **, P < 0.01; ***, P < 0.001; ns versus control; #, P<0.05; ns, not significantly different from control; NS, not significantly different.
Fig. 4.

Effect of an adenylate cyclase inhibitor on PACAP-induced PC12 cell differentiation. A, quantification of cAMP production after treatment with PACAP (100 nM) in the presence or absence of the adenylate cyclase inhibitor 2′,5′-dideoxyadenosine (ddAd, 50 μM) for 30 min. B, microphotographs illustrating the effect of PACAP (100 nM) in the presence or absence of ddAd (50 μM) on PC12 cells after 48 h of treatment. Scale bar, 16 μm. C, quantification of neurite outgrowth after treatment with PACAP (100 nM) in the absence or presence of ddAd (50 μM) for 48 h. D, quantification of the effect of a 48 h treatment with PACAP (100 nM) in the absence or presence of ddAd on cell proliferation. *, P < 0.05; **, P < 0.01; ***, P < 0.001; ns versus control; #, P < 0.05 versus PACAP; ns, not significantly different from control.
Protein kinase C is often a major contributor to neurotrophin signaling, leading to neuroendocrine cell differentiation, including several of the differentiative effects of NGF on PC12 cells, such as neuritogenesis (Das et al., 2004). However, the specific PKC inhibitor chelerythrine did not block PACAP-induced neuritogenesis or growth arrest (Fig. 5). Likewise, the broad spectrum (protein kinases A and C) inhibitor H7 failed to block PACAP-induced neuritogenesis (Fig. 5D). These data provide further criteria to define PACAP target genes involved in neuritogenesis and changes in cell size based on their cellular and biochemical responses to kinase inhibition, and prompted us to focus on regulation through the cAMP pathway.
Fig. 5.

Effect of protein kinase C inhibitors on PACAP-induced PC12 cell differentiation. A, quantification of the percentage of cells with neurites, number of neurites per cell, and total neurite outgrowth after treatment with PACAP (100 nM) in the presence or absence of chelerythrine (5 μM). B, quantification of the percentage of cells with a diameter above 17 μm after 48 h of treatment with PACAP (100 nM) in the presence or absence of chelerythrine. C, quantification of the effect of a 48-h treatment with PACAP (100 nM) in the absence or presence of chelerythrine on cell proliferation. D, quantification of total neurite outgrowth after treatment with PACAP (100 nM) in the absence or presence of cheleryth-rine (5 μM) + H89 (10 μM) or H7 (50 μM). *, P < 0.05; ***, P < 0.001; ns versus control; #, P<0.05; ns, not statistically different versus control; NS, not statistically different. Chel, chelerythrine.
MAP Kinase Induction by PACAP Independent of PKA
The ERK MAP kinase pathway has been shown by others to be required for PACAP-induced neurite outgrowth in PC12 cells based on inhibition with the MEK inhibitor PD98059 (Barrie et al., 1997; Lazarovici et al., 1998). Western blot experiments confirmed that PACAP induced a rapid and strong phosphorylation of ERK without affecting total ERK (Fig. 6A). Furthermore, this action of PACAP was independent of PKA in that it was unaffected by H89 (Fig. 6A). Both U0126 and PD98059 blocked PACAP-induced ERK phosphorylation (data not shown) in parallel with blockade of PACAP-induced neuritogenesis (>60 and >75% reduction in number of neurites per cell and total neurite length, respectively; Fig. 6B). The effect of PACAP on the percentage of cells with a diameter above 17 μm was significantly reduced in the presence of U0126 (Fig. 6C), and there was no difference between cells treated with U0126 alone or PACAP plus U0126. The MEK inhibitor U0126 decreased cell number, as expected given the role of MAPK in cell proliferation in serum-containing medium, and thus the involvement of MAPK in PACAP signaling for growth arrest could not be reliably evaluated (Fig. 6D).
Fig. 6.

Involvement of the MAP kinase pathway in the effect of PACAP on neurite outgrowth. A, effects of PACAP (100 nM) in the presence or absence of the PKA inhibitor H89 (10 μM) on ERK phosphorylation after 5 min of treatment. B, quantification of the percentage of cells with neurites, number of neurites per cell and total neurite outgrowth after treatment with PACAP (100 nM) in the presence or absence of U0126 (25 μM) or PD98059 (50 μM). C, quantification of the percentage of cells with a diameter greater than 17 μm after a 48-h treatment of PC12 cells with PACAP (100 nM) in the presence or absence of U0126 (25 μM). D, quantification of a 48-h treatment with PACAP (100 nM) in the presence or absence of U0126 (25 μM) on cell proliferation. *, P < 0.05; **, P < 0.01; ***, P < 0.001; ns versus control; #, P < 0.05; ##, P < 0.01; NS versus PACAP; ns, not significantly different from control; NS, not significantly different.
Rap1 Involvement in PACAP Signaling to Neurito-genesis
The effects of PACAP on both neurite outgrowth and ERK activation seem to be independent of either PKA or PKC (Figs. 3–6). Based on the fact that ERK phosphorylation has been shown to involve Rap1 activation (Bousch et al., 2003), a possible ERK-dependent regulation of neurite outgrowth through Rap1 was investigated. Exposure of PC12 cells to PACAP (100 nM) provoked a rapid and transient activation of Rap1, with a maximal increase observed after 30 s of treatment (Fig. 7A). The relatively small increase in total Rap1 activation observed may indicate that PACAP signaling reaches only a subcompartment of cellular Rap1 under our culture conditions, which do not include serum starvation before measurement of Rap activation.
Fig. 7.

Involvement of Rap1 in the effects of PACAP on neurite outgrowth in PC12 cells. A, illustration and quantification of a time-course effect of PACAP on Rap GTP loading. Cells were exposed to PACAP (100 nM) for durations ranging from 30 s to 30 min. Quantifications were conducted from 4 to 5 independent experiments. B, typical microphotographs illustrating the effect of a Rap1 dominant-negative IRES eGFP lentiviral expression vector (RapDN-eGFP) (green cells) on PACAP-induced differentiation after 48 h of treatment. Scale bar, 12 μm. C, quantification of the percentage of cells with neurites, number of neurites per cell, and total neurite outgrowth after treatment with PACAP in cells that express or not the Rap dominant negative protein. *, P < 0.05; ***, P < 0.001; ns versus control; ##, P < 0.01, NS versus PACAP; ns, not significantly different from control; NS, not significantly different.
PC12 cells transduced with a dominant-negative form of Rap1 (Rap-DN) coupled with an IRES-GFP showed no morphological differences from nontransduced cells, but after 48 h of treatment with PACAP (100 nM), Rap-DN expressing cells had fewer and shorter neurites than PC12 cells not expressing Rap-DN (Fig. 7B). Blocking Rap1 signaling decreased both the number of neurites per cell and the total neurite length after PACAP treatment without affecting the percentage of cells with neurites, suggesting that neurite outgrowth, rather than neurite initiation, is the component of neuritogenesis primarily affected by Rap1-dependent signaling (Fig. 7C). The expression of GFP alone in PC12 cells had no effect on PACAP-induced neurite outgrowth (data not shown).
PACAP, Forskolin, dbcAMP, and NGF Regulation of Both Common and Distinct Genes in PC12-G Cells
The PC12 cell transcriptome was investigated after 6 h of treatment with PACAP (100 nM), forskolin (25 μM), or dbcAMP (1 mM) in an attempt to identify cAMP-dependent target genes potentially involved in PACAP-induced neuritogenesis and increased cell size. Treatment with NGF (100 ng/ml) was used as a comparison: NGF induction of neuritogenesis is independent of cAMP (Vaudry et al., 2002b). Incubation of PC12 cells with PACAP for only 6 h was sufficient to elicit the later full-length neurite outgrowth and increase in cell size observed at 48 h (Fig. 2); therefore, this time was chosen for microarray analysis. Among the 15,000 cDNAs present on the microarray, 118, 64, 48, and 133 unique transcripts were significantly induced by PACAP, forskolin, dbcAMP, and NGF, respectively (Fig. 8, Tables 2–5). Twenty-seven of these transcripts were regulated in common by PACAP, forskolin, and dbcAMP (Table 2), 13 exclusively by PACAP and forskolin (Table 2), three only by dbcAMP and PACAP (Table 2), and eight only by forskolin and dbcAMP (Fig. 8A, Table 2). Comparison of the PACAP and NGF transcriptomes revealed that 19 transcripts were induced in common by the two neurotrophic factors (Fig. 8B, Table 2), and among these only three were also activated by forskolin and dbcAMP (Fig. 8C, Table 2). Other transcripts were only induced by PACAP (Table 3), forskolin (Table 4), dbcAMP (Table 4), or NGF (Table 5).
Fig. 8.

Venn diagrams comparing the number of genes induced by PACAP, forskolin, dbcAMP, and/or NGF in PC12 cells after 6 h of treatment. A, diagram comparing the genes induced by PACAP (100 nM), forskolin (25 μM), and/or dbcAMP (1 mM). The experiments were conducted on an array of 15,000 genes, among which 27 seemed reproducibly activated by both PACAP, forskolin, and dbcAMP. B, diagram comparing the genes induced by PACAP (100 nM) and/or NGF (100 ng/ml). The experiments revealed that 20 genes were induced by both PACAP and NGF. C, diagram comparing the genes induced by forskolin (25 μM), dbcAMP (1 mM), and/or NGF (100 ng/ml). The experiments revealed only three genes commonly activated by cAMP stimulators and NGF. It should be noted that these genes were also induced by PACAP (see Tables 2–5).
TABLE 2.
Genes induced by at least one factor, PACAP, forskolin, dbcAMP, and/or NGF
Classification of the genes induced by a 6-h treatment with PACAP (100 nM), forskolin (25 μM), dbcAMP (1 mM), and NGF (100 ng/ml). Transcripts were classified in decreasing order of magnitude of induction. Some transcripts with a ratio above 1.5 were not included in a particular category for a given treatment, if the data did not also satisfy microarray quality criteria (quality index >0.3). Bold characters indicate genes further investigated by real-time PCR as reported in Table 6.
| Gene Name | Unigene Number | GenBank ID | PACAP
|
Forskolin
|
dbcAMP
|
NGF
|
||||
|---|---|---|---|---|---|---|---|---|---|---|
| Av | S.E.M. | Av | S.E.M. | Av | S.E.M. | Av | S.E.M. | |||
| PACAP Forskolin dbcAMP NGF | ||||||||||
| Ornithine decarboxylase, structural 1 (Odc1) | Mm 34102 | AU020132 | 9.8 | 1.0 | 4.5 | 0.1 | 3.2 | 0.2 | 3.9 | 0.4 |
| Villin 2 (Vil2) | Mm 277812 | AW558398 | 2.4 | 0.2 | 1.5 | 0.0 | 1.6 | 0.2 | 1.5 | 0.1 |
| HIV-1 Rev binding protein (Hrb) | Mm 6461 | C81336 | 2.2 | 0.2 | 1.7 | 0.1 | 1.8 | 0.1 | 1.7 | 0.2 |
| PACAP Forskolin dbcAMP | ||||||||||
| Regulator of G-protein signaling 2 (Rgs2) | Mm 28262 | AU023169 | 10.0 | 3.4 | 3.1 | 1.2 | 1.6 | 0.2 | 1.4 | 0.1 |
| Immediate early response 3 (Ier3) | Mm 25613 | C87164 | 8.8 | 1.8 | 3.7 | 1.7 | 2.0 | 0.3 | 1.4 | 0.1 |
| Antizyme inhibitor 1 (Azin1) | Mm 250214 | AU016852 | 5.9 | 1.1 | 4.9 | 0.3 | 4.9 | 0.6 | 1.1 | 0.1 |
| MAP kinase-activated protein kinase 2 (Mapkapk2) | Mm 221235 | AW557658 | 5.9 | 0.6 | 4.2 | 0.2 | 4.4 | 0.5 | 1.4 | 0.1 |
| ESTs | Mm 17000 | AU016391 | 4.9 | 0.6 | 2.6 | 1.0 | 1.8 | 0.3 | 1.2 | 0.1 |
| Protein tyrosine phosphatase 4a1 (Ptp4a1) | Mm 374437 | AU022218 | 4.0 | 0.4 | 2.7 | 0.1 | 2.6 | 0.2 | 1.3 | 0.1 |
| Transcribed locus | Mm 401636 | AW548730 | 3.9 | 0.4 | 2.6 | 0.3 | 2.4 | 0.2 | 1.2 | 0.1 |
| RIKEN cDNA 4930431J08 gene (4930431J08Rik) | Mm 86986 | AW554859 | 3.6 | 0.3 | 2.1 | 0.1 | 1.9 | 0.3 | 1.1 | 0.1 |
| Growth arrest specific 1 (Gas1) | Mm 22701 | AW554898 | 3.5 | 0.4 | 2.5 | 0.4 | 2.3 | 0.4 | 0.9 | 0.1 |
| Prickle like 1 (Drosophila) (Prickle 1) | Mm 150314 | AU022455 | 3.5 | 0.3 | 2.3 | 0.2 | 2.2 | 0.3 | 1.2 | 0.1 |
| Plexin A2 (Plxna2) | Mm 392736 | AW551294 | 3.2 | 0.4 | 1.8 | 0.3 | 1.4 | 0.1 | 1.1 | 0.1 |
| RIKEN cDNA 1500041J02 gene (1500041J02Rik) | Mm 281019 | AU020735 | 2.9 | 0.4 | 2.6 | 0.3 | 2.1 | 0.4 | 1.3 | 0.1 |
| Eukaryotic translation initiation factor 1 (Eif1) | Mm 13886 | AW545196 | 2.5 | 0.2 | 1.7 | 0.1 | 1.9 | 0.2 | 1.2 | 0.0 |
| Activating transcription factor 4 (Atf4) | Mm 641 | AW550463 | 2.2 | 0.2 | 1.9 | 0.1 | 1.9 | 0.2 | 1.2 | 0.1 |
| ATPase, class VI, type 11A (Atp11a) | Mm 257837 | AU024208 | 2.1 | 0.2 | 1.6 | 0.2 | 1.7 | 0.2 | 1.4 | 0.1 |
| Transcribed locus | Mm 188460 | AW543519 | 2.1 | 0.2 | 1.6 | 0.1 | 1.8 | 0.2 | 1.1 | 0.1 |
| RIKEN cDNA 1810013L24 gene (1810013L24Rik) | Mm 390868 | AU024712 | 2.0 | 0.3 | 1.8 | 0.3 | 1.8 | 0.2 | 1.4 | 0.1 |
| Ubiquitin-conjugating enzyme E2L 3 (Ube213) | Mm 3074 | AW551421 | 2.0 | 0.3 | 2.0 | 0.2 | 2.0 | 0.2 | 0.9 | 0.1 |
| DNA segment, Chr 3, University of California at Los Angeles 1 (D3Ucla1) | Mm 29702 | AW539563 | 1.9 | 0.2 | 1.6 | 0.1 | 2.0 | 0.3 | 1.1 | 0.1 |
| Tubulin, β2b (Tubb2b) | Mm 379227 | AU020799 | 1.9 | 0.2 | 1.7 | 0.1 | 1.6 | 0.1 | 1.1 | 0.1 |
| RIKEN cDNA 2610024B07 gene (2610024B07Rik) | Mm 24685 | AW536239 | 1.7 | 0.2 | 1.6 | 0.0 | 1.6 | 0.1 | 1.3 | 0.1 |
| Nuclear distribution gene E-like homolog 1 (Aspergillus nidulans) (Ndel1) | Mm 31979 | AU042890 | 1.7 | 0.2 | 1.6 | 0.0 | 1.6 | 0.1 | 1.4 | 0.1 |
| Pyruvate dehydrogenase kinase, isoenzyme 3 (Pdk3) | Mm 12775 | AW556440 | 1.7 | 0.2 | 2.0 | 0.2 | 2.0 | 0.2 | 0.9 | 0.1 |
| Tyrosine hydroxylase (Th) | Mm 1292 | C85951 | 1.6 | 0.2 | 1.8 | 0.1 | 1.9 | 0.3 | 1.2 | 0.1 |
| PACAP Forskolin NGF | ||||||||||
| Arsenic (+3 oxidation state) methyltransferase (As3mt) | Mm 28566 | AU020528 | 6.0 | 1.2 | 1.9 | 0.4 | 1.4 | 0.2 | 1.9 | 0.1 |
| RIKEN cDNA 5830411E10 gene (5830411E10Rik) | Mm 196290 | AU019102 | 2.4 | 0.3 | 1.7 | 0.3 | 1.4 | 0.2 | 1.7 | 0.2 |
| Annexin A2 (Anxa2) | Mm 238343 | AW551165 | 2.4 | 0.3 | 1.6 | 0.1 | 1.4 | 0.2 | 1.5 | 0.1 |
| CAMP responsive element binding protein 3-like 2 (Creb312) | Mm 169929 | AU042737 | 2.1 | 0.4 | 1.8 | 0.3 | 1.4 | 0.3 | 1.7 | 0.2 |
| PACAP Forskolin | ||||||||||
| Sex comb on midleg homolog 1 (Scmh1) | Mm 388903 | C86855 | 5.0 | 0.5 | 2.2 | 0.5 | 2.1 | 0.2 | 1.1 | 0.1 |
| Plasminogen activator, tissue (Plat) | Mm 154660 | AU020998 | 4.1 | 1.1 | 3.2 | 0.9 | 2.0 | 0.5 | 1.2 | 0.1 |
| Hect domain and RLD 4 (Herc4) | Mm 234437 | AW553563 | 4.0 | 0.7 | 1.8 | 0.3 | 1.5 | 0.1 | 1.0 | 0.1 |
| LIM domain only 1 (Lmo1) | Mm 360145 | AU015284 | 3.3 | 0.7 | 1.7 | 0.4 | 1.3 | 0.1 | 1.2 | 0.1 |
| EH-domain containing 4 (Ehd4) | Mm 132226 | AU044505 | 3.0 | 0.3 | 1.7 | 0.2 | 1.5 | 0.2 | 1.4 | 0.1 |
| Heat shock protein 8 (Hspb8) | Mm 21549 | AU018999 | 2.5 | 0.3 | 1.6 | 0.1 | 1.5 | 0.1 | 1.2 | 0.1 |
| RIKEN cDNA 2410019A14 gene | Mm 24586 | AW555539 | 2.4 | 0.3 | 1.8 | 0.2 | 1.5 | 0.2 | 1.0 | 0.1 |
| Inhibitor of DNA binding 2 (Id2) | Mm 34871 | AW548400 | 2.2 | 0.2 | 1.6 | 0.0 | 1.5 | 0.1 | 1.4 | 0.1 |
| 70-kDa Heat shock protein 5 (glucose-regulated protein) (Hspa5) | Mm 330160 | AW555441 | 1.9 | 0.4 | 1.6 | 0.1 | 1.6 | 0.2 | 0.9 | 0.1 |
| PACAP dbcAMP | ||||||||||
| Cytoplasmic polyadenylation element binding protein 4 (Cpeb4) | Mm 339792 | AU015651 | 1.8 | 0.3 | 1.4 | 0.1 | 1.8 | 0.1 | 1.1 | 0.2 |
| Mitogen-activated protein kinase 6 (Mapk6) | Mm 18856 | AU042016 | 1.6 | 0.1 | 1.4 | 0.0 | 1.6 | 0.2 | 1.2 | 0.1 |
| 3-monooxygenase/w 5-monooxygenase activation protein, γ polypeptide (Ywhag) | Mm 233813 | AU014738 | 1.5 | 0.2 | 1.3 | 0.1 | 1.7 | 0.2 | 1.0 | 0.1 |
| Forskolin dbcAMP | ||||||||||
| Amylo-1,6-glucosidase, 4-α-glucanotransferase (Agl) | Mm 237099 | C77182 | 1.5 | 0.1 | 2.8 | 0.4 | 2.3 | 0.6 | 0.9 | 0.1 |
| Cysteine and glycine-rich protein 1 (Csrp1) | Mm 196484 | AA408841 | 2.7 | 0.4 | 2.7 | 0.1 | 2.9 | 0.3 | 1.0 | 0.1 |
| Tetratricopeptide repeat, ankyrin repeat and coiled-coil containing 2 (Tanc2) | Mm 22501 | AU022723 | 1.7 | 0.3 | 2.3 | 0.3 | 2.5 | 0.4 | 1.2 | 0.1 |
| RIKEN cDNA 2810407C02 gene (2810407C02Rik) | Mm 270950 | AW537092 | 1.7 | 0.2 | 2.0 | 0.1 | 1.6 | 0.2 | 1.0 | 0.1 |
| GATA binding protein 2 (Gata2) | Mm 272747 | AW538547 | 1.0 | 0.1 | 1.9 | 0.1 | 1.9 | 0.2 | 0.9 | 0.1 |
| Nucleophosmin 1 (Npm1) | Mm 6343 | AW553526 | 1.5 | 0.2 | 1.9 | 0.1 | 1.8 | 0.2 | 0.9 | 0.1 |
| Growth factor receptor bound protein 10 (Grb10) | Mm 273117 | AW556824 | 1.2 | 0.1 | 1.7 | 0.1 | 1.9 | 0.2 | 0.9 | 0.1 |
| Solute carrier family 31, member 1 (Slc31a1) | Mm 248637 | AU016967 | 1.4 | 0.1 | 1.6 | 0.1 | 1.7 | 0.2 | 0.7 | 0.1 |
| PACAP NGF | ||||||||||
| Serine (or cysteine) peptidase inhibitor, clade B, member 1a (Serpinb1a) | Mm 20144 | AW549049 | 5.6 | 1.5 | 1.2 | 0.2 | 1.0 | 0.1 | 2.6 | 0.7 |
| Activated leukocyte cell adhesion molecule (Alcam) | Mm 288282 | AW549010 | 3.2 | 0.5 | 1.5 | 0.2 | 1.3 | 0.2 | 1.8 | 0.1 |
| Aldo-keto reductase family 1, member B3 (aldose reductase) (Akr1b3) | Mm 451 | AW550812 | 2.4 | 0.2 | 1.4 | 0.1 | 1.2 | 0.1 | 1.7 | 0.1 |
| Cytochrome P450 oxidoreductase (Por) | Mm 3863 | AU016777 | 2.0 | 0.3 | 1.5 | 0.1 | 1.4 | 0.1 | 1.5 | 0.2 |
| Adenomatosis polyposis coli (Apc) | Mm 7883 | AW550666 | 2.0 | 0.2 | 1.4 | 0.2 | 1.4 | 0.2 | 1.8 | 0.2 |
| Methionine-tRNA synthetase 2 (mitochondrial) (Mars2) | Mm 19223 | AW539214 | 1.9 | 0.1 | 1.4 | 0.1 | 1.5 | 0.2 | 1.5 | 0.1 |
| Myeloid cell leukemia sequence 1 (Mcl1) | Mm 1639 | C81342 | 1.8 | 0.2 | 1.3 | 0.1 | 1.5 | 0.2 | 1.6 | 0.2 |
| Expressed sequence AU045404 (AU045404) | Mm 17853 | AU045358 | 1.7 | 0.1 | 1.2 | 0.1 | 1.2 | 0.1 | 4.4 | 0.5 |
| Plectin 1 (Plec1) | Mm 234912 | AU042599 | 1.7 | 0.1 | 1.2 | 0.1 | 1.3 | 0.1 | 1.6 | 0.1 |
| Aryl hydrocarbon receptor nuclear translocator-like (Arnt1) | Mm 12177 | AU045956 | 1.6 | 0.2 | 1.2 | 0.1 | 1.3 | 0.1 | 1.6 | 0.1 |
| Palladin, cytoskeletal associated protein (Palld) | Mm 29933 | AU045282 | 1.6 | 0.1 | 1.0 | 0.1 | 1.1 | 0.1 | 2.6 | 0.3 |
| Tax1 (human T-cell leukemia virus type I) binding protein 3 (Tax1bp3) | Mm 371656 | AW544713 | 1.6 | 0.1 | 1.3 | 0.1 | 1.2 | 0.1 | 1.7 | 0.1 |
| Forskolin NGF | ||||||||||
| Zinc finger, CCHC domain containing 18 (Zcchc18) | Mm 23671 | 615116.00 | 1.8 | 0.1 | 2.2 | 0.1 | 1.3 | 0.3 | 2.0 | 0.2 |
ESTs, expressed sequence tags.
TABLE 5.
Genes induced in presence of NGF
Classification of the genes induced by a 6-h treatment with PACAP (100 nM), forskolin (25 μM), dbcAMP (1 mM), or NGF (100 ng/ml). Transcripts were classified in decreasing order of magnitude of induction. Some transcripts with a ratio above 1.5 were not included in a particular category for a given treatment, if the data did not also satisfy microarray quality criteria (quality index >0.3). Bold characters indicate genes further investigated by real-time PCR as reported in Table 6.
| Gene Name | Unigene Number | GenBank ID | PACAP
|
Forskolin
|
dbcAMP
|
NGF
|
||||
|---|---|---|---|---|---|---|---|---|---|---|
| Av | S.E.M. | Av | S.E.M. | Av | S.E.M. | Av | S.E.M. | |||
| NGF | ||||||||||
| RIKEN cDNA G431001I09 gene (G431001I09Rik) | Mm 181490 | AW545135 | 1.4 | 0.2 | 1.0 | 0.1 | 1.1 | 0.1 | 2.7 | 0.4 |
| Tumor necrosis factor receptor superfamily, member 12a (Tnfrsf12a) | Mm 28518 | C87282 | 1.7 | 0.2 | 1.2 | 0.1 | 1.0 | 0.1 | 2.4 | 0.4 |
| Early growth response 1 (Egr1) | Mm 181959 | AU017579 | 1.9 | 0.5 | 1.0 | 0.1 | 1.1 | 0.1 | 2.4 | 0.7 |
| Kinesin family member 22 (Kif22) | Mm 286488 | C81217 | 1.1 | 0.3 | 0.9 | 0.1 | 1.4 | 0.4 | 2.4 | 0.9 |
| Keratin complex 1, acidic, gene 18 (Krt1–18) | Mm 22479 | AW538107 | 1.4 | 0.1 | 1.1 | 0.1 | 1.3 | 0.1 | 2.4 | 0.2 |
| Transient receptor potential cation channel, subfamily V, member 2 (Trpv2) | Mm 288064 | AW544883 | 1.3 | 0.2 | 1.3 | 0.1 | 1.2 | 0.1 | 2.0 | 0.4 |
| Keratin complex 2, basic, gene 8 (Krt2–8) | Mm 358618 | AW542449 | 1.2 | 0.3 | 1.1 | 0.1 | 1.2 | 0.1 | 2.0 | 0.2 |
| Syntaxin binding protein 4 (Stxbp4) | Mm 390411 | AW555680 | 1.1 | 0.2 | 1.0 | 0.1 | 1.1 | 0.3 | 2.0 | 0.6 |
| Solute carrier organic anion transporter family, member 3a1 (Slco3a1) | Mm 268798 | C85055 | 1.0 | 0.2 | 1.1 | 0.1 | 1.4 | 0.1 | 2.0 | 0.2 |
| RIKEN cDNA 9030612M13 gene (9030612M13Rik) | Mm 38813 | AU040655 | 1.3 | 0.3 | 0.9 | 0.1 | 1.3 | 0.2 | 1.9 | 0.4 |
| ATP-binding cassette, sub-family D (ALD), member 3 (Abcd3) | Mm 194462 | AU040952 | 1.3 | 0.2 | 0.9 | 0.1 | 1.2 | 0.2 | 1.9 | 0.4 |
| Adenylate cyclase activating polypeptide 1 receptor 1 (Pac-1) | Mm 44245 | AW547403 | 1.0 | 0.1 | 0.9 | 0.1 | 1.1 | 0.1 | 1.8 | 0.3 |
| Arginine-tRNA-protein transferase 1 (Ate1) | Mm 216321 | 585553.00 | 1.5 | 0.1 | 1.0 | 0.0 | 1.0 | 0.0 | 1.8 | 0.2 |
| Cyclin T2 (Ccnt2) | Mm 392269 | C81304 | 1.2 | 0.3 | 0.9 | 0.1 | 1.3 | 0.3 | 1.8 | 0.7 |
| Adult male diencephalon cDNA, RIKEN full-length enriched library, clone:9330102H12 | Mm 117788 | C81245 | 1.3 | 0.3 | 1.1 | 0.2 | 1.3 | 0.3 | 1.8 | 0.3 |
| Olfactory receptor 16 (Olfr16) | Mm 377103 | C81149 | 1.2 | 0.3 | 1.0 | 0.1 | 1.3 | 0.3 | 1.8 | 0.3 |
| Activating signal cointegrator 1 complex subunit 3 (Ascc3) | Mm 222497 | AW555280 | 1.7 | 0.3 | 1.1 | 0.1 | 1.0 | 0.1 | 1.8 | 0.2 |
| UDP-Gal: βGlcNAc β1,4-galactosyltransferase, polypeptide 4 (B4galt4) | Mm 182377 | AW555507 | 2.1 | 0.5 | 1.7 | 0.7 | 1.1 | 0.2 | 1.8 | 0.3 |
| Methyl-CpG binding domain protein 5 (Mbd5) | Mm 235423 | AW555677 | 1.3 | 0.2 | 1.0 | 0.1 | 1.2 | 0.1 | 1.8 | 0.3 |
| EH-domain containing 2 (Ehd2) | Mm 42135 | AW557507 | 1.4 | 0.3 | 1.0 | 0.1 | 1.3 | 0.3 | 1.8 | 0.3 |
| RIKEN cDNA 1700020O03 gene (1700020O03Rik) | Mm 252967 | C78682 | 1.1 | 0.2 | 0.9 | 0.0 | 1.3 | 0.2 | 1.8 | 0.3 |
| Synaptonemal complex protein 3 (Sycp3) | Mm 297977 | AW558202 | 1.4 | 0.2 | 1.3 | 0.3 | 1.2 | 0.2 | 1.8 | 0.2 |
| UDP-Gal: βGlcNAc β1,4-galactosyltransferase, polypeptide 1 (B4galt1) | Mm 15622 | AU042201 | 1.2 | 0.2 | 1.0 | 0.1 | 1.3 | 0.2 | 1.8 | 0.3 |
| Suppressor of cytokine signaling 5 (Socs5) | Mm 126885 | 584582.00 | 1.3 | 0.1 | 1.0 | 0.2 | 0.9 | 0.1 | 1.7 | 0.1 |
| NACHT, LRR and PYD containing protein 9a (Nalp9a) | Mm 11889 | AU022787 | 1.3 | 0.3 | 0.9 | 0.1 | 1.0 | 0.2 | 1.7 | 0.3 |
| A disintegrin and metallopeptidase domain 10 (Adam10) | Mm 3037 | AW552781 | 2.1 | 0.8 | 0.9 | 0.1 | 0.9 | 0.3 | 1.7 | 0.3 |
| Actinin, α1 (Actn1) | Mm 253564 | C77473 | 1.1 | 0.1 | 1.0 | 0.1 | 1.1 | 0.1 | 1.7 | 0.1 |
| Aldo-keto reductase family 1, member B8 (Akr1b8) | Mm 5378 | C77965 | 2.0 | 0.4 | 1.2 | 0.1 | 1.0 | 0.1 | 1.7 | 0.2 |
| Mitochondrial ribosomal protein L1 (Mrpl1) | Mm 295499 | AW549179 | 1.4 | 0.2 | 1.2 | 0.1 | 1.3 | 0.2 | 1.7 | 0.4 |
| NACHT, leucine rich repeat and PYD containing 4E (Nalp4e) | Mm 289759 | AW537584 | 1.1 | 0.2 | 1.0 | 0.1 | 0.9 | 0.1 | 1.7 | 0.3 |
| BAT2 domain containing 1 (Bat2d) | Mm 245446 | AW549561 | 1.3 | 0.2 | 1.0 | 0.1 | 1.1 | 0.2 | 1.7 | 0.3 |
| Zinc finger protein 114 (Zfp114) | Mm 246600 | AU015230 | 1.3 | 0.2 | 1.0 | 0.1 | 1.0 | 0.3 | 1.7 | 0.2 |
| Vinculin (Vcl) | Mm 279361 | AW538732 | 0.9 | 0.1 | 0.9 | 0.1 | 1.1 | 0.1 | 1.7 | 0.1 |
| Cysteine rich transmembrane BMP regulator 1 (chordin like) (Crim1) | Mm 311912 | AU021760 | 1.1 | 0.2 | 1.0 | 0.1 | 1.2 | 0.1 | 1.7 | 0.3 |
| G protein-coupled receptor kinase-interactor 2 (Git2) | Mm 195632 | AA408072 | 1.0 | 0.1 | 1.0 | 0.1 | 1.3 | 0.2 | 1.7 | 0.4 |
| Histidine decarboxylase (Hdc) | Mm 18603 | AU042518 | 1.2 | 0.2 | 1.0 | 0.1 | 1.4 | 0.3 | 1.7 | 0.3 |
| Prolactin-like protein E (Prlpe) | Mm 196424 | AW538311 | 1.0 | 0.1 | 1.2 | 0.2 | 1.1 | 0.2 | 1.7 | 0.3 |
| Progestin and adipoQ receptor family member V (Paqr5) | Mm 273267 | AU040653 | 1.3 | 0.2 | 1.0 | 0.1 | 1.3 | 0.3 | 1.7 | 0.3 |
| T-cell immunoglobulin and mucin domain containing 2 (Timd2) | Mm 234654 | AU018412 | 1.4 | 0.3 | 1.0 | 0.1 | 1.3 | 0.2 | 1.7 | 0.4 |
| RIKEN cDNA 4921517N04 gene (4921517N04Rik) | Mm 276415 | AU014935 | 1.0 | 0.1 | 0.9 | 0.1 | 1.1 | 0.1 | 1.7 | 0.3 |
| Solute carrier family 38, member 5 (Slc38a5) | Mm 6055 | C81234 | 1.1 | 0.2 | 1.1 | 0.2 | 1.2 | 0.2 | 1.7 | 0.4 |
| Phosphatidylinositol 4-kinase, catalytic, β polypeptide (Pik4cb) | Mm 217222 | AW550264 | 1.7 | 0.4 | 1.1 | 0.1 | 1.2 | 0.2 | 1.7 | 0.2 |
| Glutathione synthetase (Gss) | Mm 252316 | C81602 | 45.4 | 44.2 | 1.0 | 0.1 | 1.2 | 0.2 | 1.7 | 0.2 |
| Elongation factor Tu GTP binding domain containing 1 (Eftud1) | Mm 238020 | AU022896 | 1.2 | 0.2 | 1.0 | 0.1 | 1.2 | 0.1 | 1.7 | 0.2 |
| TBC1 domain family, member 1 (Tbc1d1) | Mm 286353 | AW555803 | 1.3 | 0.3 | 1.0 | 0.1 | 1.2 | 0.3 | 1.7 | 0.3 |
| Restin-like 2 (Rsnl2) | Mm 196382 | AU015231 | 1.3 | 0.2 | 0.9 | 0.1 | 1.2 | 0.3 | 1.7 | 0.3 |
| DEAH (Asp-Glu-Ala-His) box polypeptide 40 (Dhx40) | Mm 260627 | AW559143 | 1.5 | 0.4 | 1.2 | 0.2 | 1.3 | 0.2 | 1.7 | 0.2 |
| Integrin α3 (Itga3) | Mm 57035 | AW553717 | 1.0 | 0.1 | 1.0 | 0.0 | 1.2 | 0.1 | 1.6 | 0.1 |
| Fyn-related kinase (Frk) | Mm 332432 | C85044 | 1.1 | 0.3 | 1.0 | 0.1 | 1.2 | 0.3 | 1.6 | 0.3 |
| Pyrroline-5-carboxylate reductase 1 (Pycr1) | Mm 127731 | AU015581 | 1.3 | 0.2 | 1.0 | 0.1 | 1.2 | 0.1 | 1.6 | 0.3 |
| Phosphoribosyl pyrophosphate synthetase-associated protein 1 (Prpsap1) | Mm 25125 | C85968 | 1.4 | 0.2 | 1.1 | 0.1 | 1.3 | 0.2 | 1.6 | 0.3 |
| Periplakin (Pp1) | Mm 266875 | AW553870 | 1.3 | 0.1 | 1.2 | 0.1 | 1.1 | 0.1 | 1.6 | 0.2 |
| β-site APP cleaving enzyme 1 (Bace1) | Mm 220945 | AU023315 | 1.0 | 0.2 | 1.0 | 0.1 | 1.3 | 0.5 | 1.6 | 0.2 |
| RIKEN cDNA E330013P04 gene (E330013P04Rik) | Mm 245813 | AU014638 | 1.4 | 0.2 | 1.0 | 0.1 | 1.2 | 0.2 | 1.6 | 0.2 |
| Estrogen receptor 1 (α) (Esr1) | Mm 9213 | AU018232 | 1.0 | 0.1 | 0.9 | 0.0 | 1.1 | 0.1 | 1.6 | 0.3 |
| Deltex 3-like (Drosophila) (Dtx31) | Mm 390852 | AU042200 | 1.2 | 0.2 | 1.0 | 0.1 | 1.3 | 0.3 | 1.6 | 0.3 |
| RIKEN cDNA 2810453I06 gene (2810453I06Rik) | Mm 383219 | AU043832 | 1.3 | 0.2 | 0.9 | 0.1 | 1.2 | 0.1 | 1.6 | 0.2 |
| Centaurin, γ2 (Centg2) | Mm 291135 | AU017408 | 1.2 | 0.2 | 0.9 | 0.1 | 1.1 | 0.2 | 1.6 | 0.2 |
| CD97 antigen (Cd97) | Mm 334648 | 420765.00 | 1.4 | 0.1 | 1.0 | 0.0 | 0.8 | 0.0 | 1.6 | 0.1 |
| O-linked N-acetylglucosamine transferase (UDP-N-acetylglucosamine) (Ogt) | Mm 259191 | C81495 | 1.2 | 0.3 | 1.0 | 0.1 | 1.4 | 0.4 | 1.6 | 0.4 |
| RIKEN cDNA 4921524J06 gene (4921524J06Rik) | Mm 35296 | C86231 | 1.4 | 0.3 | 1.2 | 0.2 | 1.2 | 0.3 | 1.6 | 0.2 |
| Tribbles homolog 1 (Drosophila) (Trib1) | Mm 40298 | AW548903 | 1.5 | 0.2 | 1.1 | 0.1 | 1.1 | 0.1 | 1.6 | 0.3 |
| RIKEN cDNA 2810474O19 gene (2810474O19Rik) | Mm 333515 | AU018783 | 2.0 | 0.4 | 1.2 | 0.1 | 1.2 | 0.3 | 1.6 | 0.2 |
| Zinc finger protein 444 (Zfp444) | Mm 274089 | AW555678 | 1.2 | 0.2 | 1.0 | 0.1 | 1.3 | 0.3 | 1.6 | 0.5 |
| Zyxin (Zyx) | Mm 282303 | AW555565 | 1.7 | 0.2 | 1.1 | 0.1 | 1.1 | 0.1 | 1.6 | 0.2 |
| Nudix (nucleoside diphosphate linked moiety X)-type motif 19 (Nudt19) | Mm 358820 | AU016790 | 1.4 | 0.2 | 1.0 | 0.1 | 1.0 | 0.2 | 1.6 | 0.2 |
| Neuropilin 1 (Nrp1) | Mm 271745 | AW549864 | 1.3 | 0.2 | 0.9 | 0.1 | 1.0 | 0.1 | 1.6 | 0.1 |
| RIKEN cDNA 4933437F05 gene (4933437F05Rik) | Mm 79198 | AA408564 | 1.2 | 0.2 | 1.0 | 0.1 | 1.3 | 0.1 | 1.6 | 0.3 |
| Solute carrier organic anion transporter family, member 6c1 (Slco6c1) | Mm 60362 | C79179 | 1.5 | 0.4 | 0.9 | 0.1 | 1.0 | 0.1 | 1.6 | 0.3 |
| 5′-nucleotidase, cytosolic II (Nt5c2) | Mm 248652 | AU041566 | 1.4 | 0.3 | 0.9 | 0.1 | 0.9 | 0.2 | 1.6 | 0.2 |
| TROVE domain family, member 2 (Trove2) | Mm 40370 | AU041284 | 1.4 | 0.2 | 1.0 | 0.1 | 1.1 | 0.2 | 1.6 | 0.2 |
| Oxoglutarate (α-ketoglutarate) receptor 1 (Oxgr1) | Mm 138520 | AW558733 | 1.2 | 0.2 | 1.0 | 0.1 | 1.3 | 0.3 | 1.6 | 0.3 |
| Dual specificity phosphatase 16 (Dusp16) | Mm 3994 | AW551732 | 1.7 | 0.4 | 1.3 | 0.3 | 1.0 | 0.1 | 1.6 | 0.2 |
| DNA segment, Chr 9, ERATO Doi 280, expressed (D9Ertd280e) | Mm 258310 | C79755 | 1.2 | 0.3 | 0.9 | 0.1 | 0.9 | 0.1 | 1.6 | 0.2 |
| Potassium voltage-gated channel, Shal-related family, member 2 (Kcnd2) | Mm 320691 | AW554807 | 1.5 | 0.4 | 0.9 | 0.1 | 0.7 | 0.2 | 1.6 | 0.2 |
| G protein-coupled receptor 1 (Gpr1) | Mm 103354 | AU024461 | 1.2 | 0.2 | 1.0 | 0.1 | 1.2 | 0.2 | 1.6 | 0.2 |
| Septin 7 (Sept7) | Mm 270259 | C81520 | 1.1 | 0.2 | 1.0 | 0.1 | 1.1 | 0.2 | 1.6 | 0.3 |
| Glial cell line derived neurotrophic factor family receptor α1 (Gfra1) | Mm 88367 | AU042498 | 1.0 | 0.1 | 1.0 | 0.1 | 1.3 | 0.2 | 1.6 | 0.2 |
| Excision repair cross-complementing rodent repair deficiency, group 1 (Ercc1) | Mm 280913 | AW544260 | 1.4 | 0.1 | 1.0 | 0.1 | 1.0 | 0.1 | 1.6 | 0.1 |
| Exostoses (multiple) 1 (Ext1) | Mm 309395 | AA407088 | 1.2 | 0.2 | 1.0 | 0.1 | 1.3 | 0.2 | 1.6 | 0.3 |
| Transmembrane protein 64 (Tmem64) | Mm 38877 | AW555938 | 3.5 | 2.7 | 1.0 | 0.1 | 1.0 | 0.1 | 1.6 | 0.1 |
| β-1,4-N-acetyl-galactosaminyl transferase 2 (B4galnt2) | Mm 340702 | AU040657 | 1.2 | 0.2 | 1.0 | 0.1 | 1.3 | 0.3 | 1.6 | 0.3 |
| H19 fetal liver mRNA (H19) | Mm 14802 | AW555056 | 1.5 | 0.2 | 1.2 | 0.1 | 1.3 | 0.1 | 1.6 | 0.1 |
| ATPase type 13A5 (Atp13a5) | Mm 9823 | C88250 | 1.4 | 0.2 | 1.0 | 0.1 | 1.2 | 0.3 | 1.6 | 0.2 |
| Solute carrier family 35 (CMP-sialic acid transporter), member 1 (Slc35a1) | Mm 281885 | AW539587 | 1.1 | 0.2 | 1.4 | 0.5 | 1.2 | 0.3 | 1.5 | 0.3 |
| Synaptonemal complex protein 1 (Sycp1) | Mm 243849 | AW557607 | 1.6 | 0.4 | 1.0 | 0.1 | 0.9 | 0.1 | 1.5 | 0.2 |
| GATA binding protein 3 (Gata3) | Mm 313866 | C81309 | 1.1 | 0.2 | 1.1 | 0.1 | 1.3 | 0.1 | 1.5 | 0.1 |
| RIKEN cDNA C130037N17 gene (C130037N17Rik) | Mm 321371 | AU041266 | 1.6 | 0.4 | 1.0 | 0.1 | 0.9 | 0.1 | 1.5 | 0.2 |
| RIKEN cDNA 4631427C17 gene (4631427C17Rik) | Mm 210899 | AU041120 | 2.2 | 0.7 | 0.9 | 0.1 | 1.0 | 0.1 | 1.5 | 0.2 |
| Prefoldin 4 (Pfdn4) | Mm 28808 | AU021910 | 1.5 | 0.2 | 1.2 | 0.1 | 1.2 | 0.2 | 1.5 | 0.1 |
| GTPase activating RANGAP domain-like 1 (Garnl1) | Mm 292180 | AW557194 | 1.5 | 0.3 | 1.1 | 0.1 | 1.2 | 0.1 | 1.5 | 0.2 |
| Solute carrier family 7 (cationic amino acid transporter, y + system), member 2 (Slc7a2) | Mm 4676 | C85183 | 1.1 | 0.3 | 1.0 | 0.1 | 1.0 | 0.2 | 1.5 | 0.3 |
| Phosphorylase kinase α2 (Phka2) | Mm 350712 | AW558022 | 1.1 | 0.1 | 1.1 | 0.1 | 1.0 | 0.2 | 1.5 | 0.2 |
| Yamaguchi sarcoma viral (v-yes) oncogene homolog 1 (Yes1) | Mm 4558 | AW555652 | 1.8 | 0.4 | 1.1 | 0.1 | 1.7 | 0.7 | 1.5 | 0.2 |
| Ubiquitin specific peptidase 47 (Usp47) | Mm 16974 | AU022065 | 1.2 | 0.2 | 1.0 | 0.1 | 1.2 | 0.2 | 1.5 | 0.2 |
| RIKEN cDNA D530005L17 gene (D530005L17Rik) | Mm 235934 | AW558478 | 1.6 | 0.3 | 0.9 | 0.1 | 1.0 | 0.2 | 1.5 | 0.2 |
| Ataxin 1 (Atxn1) | Mm 342686 | C85907 | 1.4 | 0.5 | 0.9 | 0.1 | 0.9 | 0.2 | 1.5 | 0.2 |
| RIKEN cDNA E430024C06 gene (E430024C06Rik) | Mm 392675 | AU023454 | 1.2 | 0.2 | 1.1 | 0.1 | 1.3 | 0.2 | 1.5 | 0.1 |
| RIKEN cDNA D730003I15 gene (D730003I15Rik) | Mm 16927 | AU042662 | 1.1 | 0.1 | 0.9 | 0.1 | 1.0 | 0.2 | 1.5 | 0.2 |
| Poliovirus receptor-related 3 (Pvrl3) | Mm 328072 | AU016832 | 1.1 | 0.2 | 1.2 | 0.2 | 1.4 | 0.1 | 1.5 | 0.1 |
| Wilms tumor homolog (Wt1) | Mm 389339 | AW554453 | 1.4 | 0.1 | 1.1 | 0.2 | 1.0 | 0.1 | 1.5 | 0.2 |
| Nur77 downstream gene 1 (Ndg1) | Mm 26006 | AU021983 | 1.2 | 0.2 | 0.9 | 0.1 | 1.3 | 0.1 | 1.5 | 0.2 |
| Pinin (Pnn) | Mm 22347 | AW538340 | 1.3 | 0.1 | 1.1 | 0.1 | 1.1 | 0.1 | 1.5 | 0.1 |
| Ferritin light chain 1 (Ftl1) | Mm 28251 | AW555646 | 1.5 | 0.3 | 1.1 | 0.1 | 1.2 | 0.2 | 1.5 | 0.2 |
| RIKEN cDNA A530040E14 gene (A530040E14Rik) | Mm 360513 | AU045208 | 1.4 | 0.2 | 1.0 | 0.0 | 1.3 | 0.2 | 1.5 | 0.2 |
| Transcribed locus | Mm 382067 | AU016609 | 1.2 | 0.2 | 0.9 | 0.1 | 1.1 | 0.2 | 1.5 | 0.3 |
| expressed sequence AU022928 | Mm 201282 | AU022928 | 1.0 | 0.2 | 1.1 | 0.2 | 0.8 | 0.1 | 1.5 | 0.3 |
| CDNA sequence BC016495 (BC016495) | Mm 211595 | AA408837 | 1.1 | 0.2 | 0.9 | 0.1 | 1.1 | 0.1 | 1.5 | 0.1 |
| Paternally expressed 10 (Peg10) | Mm 320575 | AA408654 | 1.1 | 0.2 | 1.4 | 0.4 | 1.2 | 0.1 | 1.5 | 0.1 |
| Microfibrillar-associated protein 1 (Mfap1) | Mm 270393 | C78936 | 1.0 | 0.1 | 1.1 | 0.1 | 1.2 | 0.1 | 1.5 | 0.2 |
| Zinc finger protein 291 (Zfp291) | Mm 86588 | AW554071 | 1.5 | 0.3 | 1.0 | 0.1 | 1.2 | 0.1 | 1.5 | 0.2 |
| RIKEN cDNA 2210408F21 gene (2210408F21Rik) | Mm 59134 | AU042519 | 1.4 | 0.3 | 0.9 | 0.1 | 1.2 | 0.2 | 1.5 | 0.2 |
| Phenylalanine-tRNA synthetase-like, βsubunit (Farslb) | Mm 389145 | AU042241 | 1.0 | 0.2 | 0.9 | 0.1 | 0.8 | 0.1 | 1.5 | 0.2 |
TABLE 3.
Genes induced only by PACAP
Classification of the genes induced by a 6-h treatment with PACAP (100 nM), forskolin (25 μM), dbcAMP (1 mM), or NGF (100 ng/ml). Transcripts were classified in decreasing order of magnitude of induction. Some transcripts with a ratio above 1.5 were not included in a particular category for a given treatment, if the data did not also satisfy microarray quality criteria (quality index >0.3). Bold characters indicate genes further investigated by real-time PCR as reported in Table 6.
| Gene Name | Unigene Number | GenBank ID | PACAP
|
Forskolin
|
dbcAMP
|
NGF
|
||||
|---|---|---|---|---|---|---|---|---|---|---|
| Av | S.E.M. | Av | S.E.M. | Av | S.E.M. | Av | S.E.M. | |||
| PACAP | ||||||||||
| Kruppel-like factor 4 (gut) | Mm 4325 | AU018863 | 3.0 | 0.7 | 1.3 | 0.3 | 1.4 | 0.2 | 1.1 | 0.1 |
| Lectin, galactose binding, soluble 3 (Lgals3) | Mm 248615 | AW543680 | 3.0 | 0.4 | 1.3 | 0.0 | 1.3 | 0.2 | 1.3 | 0.1 |
| Olfactomedin-like 3 (Olfml3) | Mm 211535 | AW550633 | 2.8 | 0.6 | 1.6 | 0.3 | 1.1 | 0.2 | 1.7 | 0.3 |
| Protein phosphatase 2, regulatory subunit B (PR 52), β isoform (Ppp2r2b) | Mm 26134 | AU018728 | 2.7 | 0.6 | 1.2 | 0.2 | 1.1 | 0.3 | 1.5 | 0.1 |
| Solute carrier family 7, member 8 (Slc7a8) | Mm 276831 | AU022525 | 2.6 | 0.3 | 1.7 | 0.2 | 2.5 | 1.1 | 1.0 | 0.1 |
| AXIN1 up-regulated 1 (Axud1) | Mm 125196 | AU015509 | 2.4 | 0.5 | 1.2 | 0.2 | 1.2 | 0.1 | 1.3 | 0.1 |
| Poliovirus receptor (Pvr) | Mm 227506 | C86693 | 2.2 | 0.4 | 1.4 | 0.3 | 1.1 | 0.1 | 1.3 | 0.1 |
| Eukaryotic translation initiation factor 2C, 2 (Eif2c2) | Mm 274482 | AW554903 | 2.2 | 0.3 | 1.3 | 0.1 | 1.5 | 0.2 | 0.9 | 0.1 |
| Mannoside acetylglucosaminyltransferase 1 (Mgat 1) | Mm 196933 | AW550213 | 2.1 | 0.5 | 1.4 | 0.1 | 1.3 | 0.1 | 1.0 | 0.0 |
| Laminin, α5 (Lama5) | Mm 4339 | AA408762 | 2.1 | 0.2 | 1.6 | 0.4 | 1.4 | 0.2 | 1.5 | 0.3 |
| Diacylglycerol O-acyltransferase 2 (Dgat2) | Mm 180189 | AU043052 | 2.1 | 0.3 | 1.3 | 0.2 | 1.2 | 0.2 | 1.3 | 0.1 |
| WNK lysine deficient protein kinase 1 (Wnk1) | Mm 391663 | C81474 | 2.1 | 0.2 | 1.1 | 0.1 | 1.1 | 0.1 | 1.3 | 0.1 |
| Adaptor-related protein complex 1, σ2 subunit (Ap1s2) | Mm 146736 | AU040383 | 2.1 | 0.2 | 1.5 | 0.1 | 1.4 | 0.2 | 1.2 | 0.1 |
| Elongation factor RNA polymerase II 2 (EII2) | Mm 21288 | AU042469 | 2.0 | 0.2 | 1.4 | 0.1 | 1.5 | 0.1 | 1.2 | 0.1 |
| Fos-like antigen 2 (Fosl2) | Mm 24684 | AU042525 | 2.0 | 0.3 | 1.1 | 0.1 | 1.2 | 0.1 | 1.4 | 0.3 |
| ATPase, class VI, type IIA (Atp11a) | Mm 392605 | AU040689 | 2.0 | 0.3 | 1.4 | 0.1 | 1.9 | 0.6 | 1.3 | 0.1 |
| Serine/threonine kinase 40 (Stk40) | Mm 41865 | AU015210 | 2.0 | 0.2 | 1.2 | 0.1 | 1.4 | 0.2 | 1.4 | 0.1 |
| Aldo-keto reductase family 1, member B8 (Akr1b8) | Mm 5378 | C77965 | 2.0 | 0.4 | 1.2 | 0.1 | 1.0 | 0.1 | 1.7 | 0.2 |
| Testis-derived transcript (Tes) | Mm 389083 | C81197 | 1.9 | 0.2 | 1.4 | 0.2 | 1.1 | 0.2 | 1.2 | 0.1 |
| UDP-Gal: βGlcNAcβ1,4-galactosyltransferase, polypeptide 3 (B4galt3) | Mm 274011 | AW555479 | 1.9 | 0.3 | 1.5 | 0.1 | 1.3 | 0.3 | 1.1 | 0.2 |
| Adenomatosis polyposis coli (Apc) | Mm 7883 | AU014897 | 1.9 | 0.3 | 1.1 | 0.1 | 1.6 | 0.2 | 1.4 | 0.2 |
| Actin related protein 2/3 complex, subunit 3 (Arpc3) | Mm 275942 | AW546733 | 1.9 | 0.2 | 1.4 | 0.1 | 1.2 | 0.2 | 1.1 | 0.1 |
| Heat shock protein 1 (Hspb1) | Mm 13849 | AU021579 | 1.9 | 0.2 | 1.2 | 0.1 | 1.2 | 0.1 | 1.0 | 0.1 |
| Poliovirus receptor-related 1 (Pvr11) | Mm 335096 | AW549174 | 1.9 | 0.3 | 1.3 | 0.2 | 1.4 | 0.2 | 1.7 | 0.3 |
| Protein C receptor, endothelial (Procr) | Mm 3243 | AW545622 | 1.9 | 0.3 | 1.1 | 0.1 | 1.2 | 0.1 | 1.1 | 0.0 |
| Phosphoserine phosphatase (Psph) | Mm 271784 | AW554246 | 1.8 | 0.2 | 1.3 | 0.1 | 1.2 | 0.2 | 1.3 | 0.1 |
| Inhibitor of DNA binding 3 (Id3) | Mm 110 | AW557873 | 1.8 | 0.2 | 1.6 | 0.2 | 1.3 | 0.1 | 1.2 | 0.1 |
| Expressed sequence AW552058 | Mm 198448 | AW552058 | 1.8 | 0.2 | 1.2 | 0.1 | 1.4 | 0.2 | 1.3 | 0.1 |
| Ubiquitin-like 3 | Mm 21846 | AU042224 | 1.8 | 0.2 | 1.3 | 0.1 | 1.2 | 0.1 | 1.0 | 0.1 |
| Prostaglandin E synthase | Mm 28768 | C81414 | 1.8 | 0.4 | 1.2 | 0.3 | 0.9 | 0.1 | 1.4 | 0.3 |
| Werner helicase interacting protein 1 (Wrnip1) | Mm 286680 | AU040729 | 1.7 | 0.2 | 1.1 | 0.1 | 1.0 | 0.2 | 1.5 | 0.1 |
| Cd63 antigen (Cd63) | Mm 371552 | AU020673 | 1.7 | 0.2 | 1.2 | 0.1 | 1.2 | 0.1 | 1.2 | 0.0 |
| CCAAT/enhancer binding protein (C/EBP), γ (Cebpg) | Mm 273090 | AU022405 | 1.7 | 0.2 | 1.0 | 0.2 | 1.2 | 0.1 | 0.7 | 0.1 |
| Tropomyosin 4 (Tpm4) | Mm 295124 | AW537534 | 1.7 | 0.3 | 1.5 | 0.1 | 1.6 | 0.2 | 1.2 | 0.1 |
| RIKEN cDNA 2310051F07 gene (2310051F07Rik) | Mm 391971 | AW546247 | 1.7 | 0.2 | 1.2 | 0.0 | 1.4 | 0.2 | 1.1 | 0.1 |
| Quininoid dihydropteridine reductase (Qdpr) | Mm 30204 | AU023976 | 1.7 | 0.2 | 1.3 | 0.1 | 1.1 | 0.1 | 0.9 | 0.0 |
| TSC22 domain family, member 1 (Tsc22d1) | Mm 153272 | AU040743 | 1.7 | 0.3 | 0.9 | 0.0 | 0.9 | 0.1 | 0.8 | 0.1 |
| Fibronectin type III domain containing 3a (Fndc3a) | Mm 205421 | AA407010 | 1.7 | 0.2 | 1.1 | 0.2 | 1.3 | 0.1 | 1.4 | 0.2 |
| Zinc finger, CSL domain containing 2 (Zcsl2) | Mm 2519 | AU019309 | 1.7 | 0.2 | 1.1 | 0.0 | 1.1 | 0.1 | 1.1 | 0.0 |
| Golgi reassembly stacking protein 2 (Gorasp2) | Mm 271950 | AW551843 | 1.6 | 0.3 | 1.3 | 0.0 | 1.3 | 0.1 | 1.1 | 0.1 |
| Glutaredoxin (Glrx) | Mm 25844 | AW537328 | 1.6 | 0.2 | 1.5 | 0.3 | 1.4 | 0.2 | 1.3 | 0.2 |
| ADP-ribosylation factor 4 (Arf4) | Mm 297768 | AW554150 | 1.6 | 0.1 | 1.4 | 0.1 | 1.5 | 0.2 | 1.1 | 0.1 |
| Ubiquitin-conjugating enzyme E2, J1 (Ube2j1) | Mm 259095 | AW554710 | 1.6 | 0.2 | 1.4 | 0.1 | 1.3 | 0.2 | 1.3 | 0.1 |
| Protein phosphatase 2 (formerly 2A), catalytic subunit, α isoform (Ppp2ca) | Mm 260288 | AU018631 | 1.6 | 0.2 | 1.4 | 0.0 | 1.3 | 0.1 | 1.1 | 0.1 |
| Rap guanine nucleotide exchange factor (GEF) 5 (Rapgef5) | Mm 227642 | AU023974 | 1.6 | 0.2 | 1.0 | 0.1 | 1.2 | 0.1 | 0.8 | 0.1 |
| Intraflagellar transport 20 homolog (Chlamydomonas) (Ift20) | Mm 358671 | AU015496 | 1.6 | 0.2 | 1.1 | 0.1 | 1.1 | 0.1 | 1.3 | 0.1 |
| Glutamyl-prolyl-tRNA synthetase (Eprs) | Mm 154511 | AW557843 | 1.6 | 0.2 | 1.5 | 0.1 | 1.5 | 0.1 | 1.2 | 0.1 |
| DEAD/H (Asp-Glu-Ala-Asp/His) box polypeptide 3, X-linked (Ddx3x) | Mm 289662 | AW544374 | 1.6 | 0.1 | 1.4 | 0.1 | 1.4 | 0.1 | 1.3 | 0.1 |
| Eukaryotic translation initiation factor 4E (Eif4e) | Mm 3941 | AU016482 | 1.6 | 0.2 | 1.1 | 0.1 | 1.1 | 0.1 | 1.3 | 0.1 |
| Cleavage stimulation factor, 3′ pre-RNA, subunit 3 (Cstf3) | Mm 259876 | C79534 | 1.6 | 0.2 | 1.4 | 0.1 | 1.3 | 0.1 | 1.2 | 0.1 |
| Transmembrane protein 49 (Tmem49) | Mm 390398 | C87007 | 1.6 | 0.2 | 1.2 | 0.0 | 1.2 | 0.1 | 1.3 | 0.1 |
| Sirtuin 1 (silent mating type information regulation 2, homolog) 1 (Sirt1) | Mm 351459 | AW548525 | 1.6 | 0.1 | 1.2 | 0.1 | 1.3 | 0.2 | 1.2 | 0.2 |
| Solute carrier family 38, member 1 (Slc38a1) | Mm 103568 | AW552655 | 1.6 | 0.2 | 1.3 | 0.2 | 1.5 | 0.2 | 1.0 | 0.1 |
| Zinc finger protein 207 (Zfp207) | Mm 102253 | AW553254 | 1.6 | 0.2 | 1.1 | 0.1 | 1.2 | 0.1 | 1.2 | 0.1 |
| Pituitary tumor-transforming 1 interacting protein (Pttg1ip) | Mm 28853 | AW546604 | 1.6 | 0.2 | 1.0 | 0.0 | 1.2 | 0.1 | 1.1 | 0.1 |
| Eukaryotic translation initiation factor 1A (Eifla) | Mm 262037 | AW536208 | 1.6 | 0.3 | 1.0 | 0.1 | 1.2 | 0.1 | 1.2 | 0.1 |
| Methylenetetrahydrofolate dehydrogenase and cyclohydrolase (Mthfd2) | Mm 443 | AW558851 | 1.6 | 0.1 | 1.3 | 0.2 | 1.2 | 0.1 | 1.2 | 0.1 |
| Ubiquitin specific peptidase 54 (Usp54) | Mm 385812 | C87394 | 1.6 | 0.2 | 0.9 | 0.0 | 1.0 | 0.1 | 0.8 | 0.1 |
| WNK lysine deficient protein kinase 1 (Wnk1) | Mm 333349 | AU015196 | 1.5 | 0.1 | 1.1 | 0.0 | 1.1 | 0.2 | 1.2 | 0.1 |
| Ninjurin 1 (Ninj1) | Mm 18503 | AU024536 | 1.5 | 0.1 | 1.3 | 0.1 | 1.4 | 0.1 | 1.0 | 0.1 |
| RIKEN cDNA 4930422I07 gene (4930422I07Rik) | Mm 259988 | AU022442 | 1.5 | 0.2 | 1.2 | 0.1 | 1.4 | 0.2 | 1.2 | 0.2 |
| Thioredoxin-like 1 (Txnl1) | Mm 19169 | AU045102 | 1.5 | 0.2 | 1.2 | 0.0 | 1.3 | 0.2 | 1.1 | 0.1 |
| Eukaryotic translation elongation factor 1 epsilon 1 (Eefle1) | Mm 36683 | AU043784 | 1.5 | 0.1 | 1.2 | 0.1 | 1.2 | 0.1 | 1.3 | 0.1 |
TABLE 4.
Genes induced by cAMP (forskolin and dbcAMP)
Classification of the genes induced by a 6-h treatment with PACAP (100 nM), forskolin (250 nM), dbcAMP (10 mM), and/or NGF (100 ng/ml). Transcripts were classified in decreasing order of magnitude of induction. Some transcripts with a ratio above 1.5 were not included in a particular category for a given treatment, if the data did not also satisfy microarray quality criteria (quality index >0.3). Bold characters indicate genes further investigated by real-time PCR as reported in Table 6.
| Gene Name | Unigene Number | GenBank ID | PACAP
|
Forskolin
|
dbcAMP
|
NGF
|
||||
|---|---|---|---|---|---|---|---|---|---|---|
| Av | S.E.M. | Av | S.E.M. | Av | S.E.M. | Av | S.E.M. | |||
| Forskolin | ||||||||||
| Ferric-chelate reductase 1 (Frrs1) | Mm 66293 | C86591 | 1.7 | 0.3 | 2.9 | 1.1 | 2.2 | 0.7 | 1.2 | 0.2 |
| Bone morphogenetic protein 6 (Bmp6) | Mm 28622 | C76305 | 3.1 | 0.7 | 2.6 | 0.4 | 2.1 | 0.2 | 1.2 | 0.1 |
| Chromogranin B (Chgb) | Mm 255241 | 367410.00 | 1.2 | 0.3 | 2.6 | 0.3 | 2.2 | 0.2 | 0.8 | 0.1 |
| Peptidylglycine α-amidating monooxygenase (Pam) | Mm 5121 | 482270.00 | 1.2 | 0.4 | 2.2 | 0.3 | 1.9 | 0.3 | 0.7 | 0.1 |
| Fibrinogen, βpolypeptide (Fgb) | Mm 30063 | 552321.00 | 0.9 | 0.0 | 2.0 | 0.1 | 1.4 | 0.2 | 0.8 | 0.0 |
| Methionine adenosyltransferase IIα (Mat2a) | Mm 29815 | AW542928 | 1.6 | 0.3 | 2.0 | 0.2 | 2.1 | 0.3 | 0.9 | 0.1 |
| Leucine rich repeat containing 3 (Lrrc3) | Mm 133301 | 316779.00 | 0.8 | 0.1 | 1.9 | 0.1 | 1.5 | 0.3 | 0.9 | 0.0 |
| X-box binding protein 1 (Xbp1) | Mm 22718 | AU040737 | 1.9 | 0.2 | 1.9 | 0.1 | 1.7 | 0.2 | 1.4 | 0.1 |
| Gene trap ROSA b-geo 22 (Gtrgeo22) | Mm 22632 | AW544177 | 1.6 | 0.2 | 1.8 | 0.0 | 1.9 | 0.1 | 1.1 | 0.1 |
| 70-kDa Heat shock protein 5 (glucose-regulated protein) (Hspa5) | Mm 330160 | AW537792 | 1.5 | 0.1 | 1.7 | 0.2 | 1.4 | 0.2 | 0.9 | 0.1 |
| Frizzled homolog 7 (Drosophila) (Fzd7) | Mm 297906 | AW537516 | 1.0 | 0.1 | 1.7 | 0.3 | 1.4 | 0.2 | 1.0 | 0.1 |
| 13 days embryo heart cDNA, RIKEN full-length enriched library, clone:D330042P15 | Mm 417626 | AU020988 | 1.2 | 0.1 | 1.6 | 0.3 | 1.3 | 0.2 | 1.1 | 0.1 |
| UDP-GlcNAc: βGal β-1,3-N-acetylglucosaminyltransferase 1 (B3gnt1) | Mm 258094 | AU024115 | 1.3 | 0.1 | 1.6 | 0.0 | 1.4 | 0.1 | 1.0 | 0.1 |
| RIKEN cDNA 9630050M13 gene (9630050M13Rik) | Mm 23044 | AA409679 | 1.3 | 0.1 | 1.5 | 0.1 | 1.6 | 0.2 | 1.0 | 0.1 |
| Transmembrane protein 16F (Tmem16f) | Mm 38087 | AW553814 | 1.3 | 0.2 | 1.5 | 0.1 | 1.5 | 0.3 | 0.8 | 0.1 |
| dbcAMP | ||||||||||
| Ras homolog gene family, member Q (Rhoq) | Rn0.4169 | AW557645 | 1.4 | 0.2 | 1.4 | 0.1 | 1.9 | 0.2 | 1.1 | 0.1 |
| Homer homolog 2 (Drosophila) (Homer2) | Mm 228 | AA407944 | 1.5 | 0.2 | 1.5 | 0.1 | 1.7 | 0.2 | 1.3 | 0.1 |
| RAB6, member RAS oncogene family (Rab6) | Mm 28650 | AW552337 | 1.5 | 0.3 | 1.3 | 0.1 | 1.7 | 0.2 | 1.2 | 0.2 |
| Protein tyrosine phosphatase, receptor type, F (Ptprf) | Mm 29855 | AW548091 | 1.2 | 0.2 | 1.3 | 0.1 | 1.6 | 0.2 | 0.9 | 0.1 |
| RIKEN cDNA 1700020D05 gene (1700020D05Rik) | Mm 20071 | AW558842 | 1.5 | 0.6 | 1.4 | 0.3 | 1.6 | 0.2 | 0.9 | 0.1 |
| Phosphoribosyl pyrophosphate amidotransferase (Ppat) | Mm 202337 | AA408689 | 1.0 | 0.1 | 1.6 | 0.1 | 1.6 | 0.2 | 0.9 | 0.1 |
| CAMP-regulated phosphoprotein 19 (Arpp19) | Mm 247837 | AW559096 | 1.4 | 0.1 | 1.4 | 0.1 | 1.6 | 0.1 | 0.9 | 0.1 |
| Single-stranded DNA binding protein 3 (Ssbp3) | Mm 195635 | AW551939 | 1.3 | 0.1 | 1.3 | 0.1 | 1.6 | 0.1 | 1.1 | 0.1 |
| Protein kinase, cAMP dependent regulatory, type I, α (Prkar1a) | Mm 30039 | AW555666 | 1.5 | 0.2 | 1.5 | 0.1 | 1.6 | 0.1 | 1.2 | 0.1 |
| T 3-monooxygenase/w 5-monooxygenase activation protein, z polypeptide (Ywhaz) | Mm 3360 | AW544726 | 1.2 | 0.1 | 1.3 | 0.1 | 1.5 | 0.1 | 1.1 | 0.1 |
To verify the microarray results, primers for Q-RT-PCR were designed against 17 transcripts with varying expression profiles in microarray analysis (Table 1). We chose six of the 17 genes for further analysis based on their up-regulation by all three cAMP-elevating or cAMP-mimicking agents (PACAP, dbcAMP, and forskolin), and 11 additional representative transcripts from other categories in which a 1.5-fold or greater increase was seen with only one. These 17 transcripts were validated in two ways. First, transcripts induced after 6 h of treatment with PACAP (100 nM), forskolin (25 μM), dbcAMP (10 mM), or NGF (100 ng/ml) as detected by microarray hybridization were also found to be elevated via quantification using real-time PCR (Table 6). Some transcripts, such as glutaredoxin (Glrx) detected as elevated only by PACAP in the microarray experiments, were in fact also induced by forskolin and dbcAMP when measured using real-time PCR (Table 6). Most transcripts [e.g., GATA binding protein 2 (Gata2), PACAP specific receptor-1 (Pac1), and Neuropilin (Nrp1)] that were not induced by PACAP according to microarray analysis were indeed not regulated as confirmed by real-time PCR (Table 6). A Q-RT-PCR time course (Fig. 9) was then carried out for all 17 transcripts to investigate the possibility of artifactual discordance in transcript regulation by PACAP, forskolin, dbcAMP, or NGF based solely on the decreased sensitivity of microarray analysis compared with Q-RT-PCR (Vaudry et al., 2002a). The time course confirmed that these transcripts showed a robust up-regulation by all four pharmacological (dbcAMP, forskolin) or neurotrophic (PACAP, NGF) neuritogenic agents during the first 48 h of treatment, at which time neuritogenesis is maximal for PACAP, dbcAMP, and forskolin and is well under way for NGF. Seven of 17 transcripts (Gata2, Nrp1, Pac-1, Anx2, Homer2, Akr1b8, and Glrx) failed to fulfill this second criterion. We chose three of the remaining ten transcripts (Egr1, Vil2 and Ier3) for further analysis based on the overall robustness of induction by all four agents over the first half of the 48-h time course (Fig. 9). Thus, the Q-RT-PCR time course experiment revealed that the transcript encoding early growth response 1 (Egr1; Fig. 9), which was found to be activated only by NGF at 6 h after microarray analysis, was induced earlier by cAMP and PACAP and returned to control levels after 6 h of treatment. The immediate early gene Ier3, initially thought to be differentially regulated by PACAP, forskolin, and dbcAMP versus NGF, was also shown to be transiently regulated by NGF, albeit considerably less (5-fold) than that by cAMP (maximally, 15–25-fold; Fig. 9). The transcript encoding villin 2 (Vil2; Fig. 9) was up-regulated modestly (2–4-fold) but consistently by all four agents with a maximum at around 3 h of treatment.
TABLE 6.
Validation of microarray results by real-time PCR
mRNA induction for 17 genes, found up-regulated by microarray, after a 6-h treatment with PACAP (100 nM), forskolin (25 μM), dbcAMP (1 mM), or NGF (100 ng/ml). Genes were classified in ascending order of regulation by PACAP obtained by real-time PCR.
| Gene | Control | S.E.M. | PACAP | S.E.M. | Forskolin | S.E.M. | dbcAMP | S.E.M. | NGF | S.E.M. |
|---|---|---|---|---|---|---|---|---|---|---|
| Gata2 | 1.19 | 0.08 | 1.06 | 0.11 | 3.21 | 0.32 | 1.78 | 0.41 | 0.69 | 0.05 |
| Nrp1 | 1.23 | 0.25 | 1.08 | 0.13 | 0.41 | 0.00 | 0.42 | 0.03 | 5.26 | 0.62 |
| Pac1 | 1.03 | 0.11 | 1.23 | 0.13 | 0.77 | 0.05 | 0.66 | 0.06 | 7.20 | 0.81 |
| Anx2 | 1.06 | 0.05 | 1.35 | 0.16 | 1.29 | 0.04 | 1.70 | 0.19 | 1.54 | 0.37 |
| Homer2 | 1.08 | 0.06 | 2.18 | 0.13 | 2.08 | 0.12 | 1.10 | 0.37 | 1.56 | 0.21 |
| Por | 0.97 | 0.06 | 2.46 | 0.28 | 2.09 | 0.10 | 2.58 | 0.25 | 3.52 | 0.56 |
| Akr1b8 | 1.06 | 0.05 | 2.73 | 0.36 | 1.80 | 0.19 | 4.06 | 1.49 | 3.31 | 0.96 |
| Vil2 | 1.10 | 0.11 | 2.86 | 0.26 | 2.50 | 0.09 | 3.40 | 0.47 | 2.31 | 0.26 |
| Hspb8 | 1.06 | 0.05 | 2.95 | 0.16 | 2.24 | 0.10 | 1.25 | 0.42 | 1.88 | 0.19 |
| Egr1 | 1.29 | 0.30 | 4.04 | 0.36 | 2.30 | 0.12 | 4.22 | 0.66 | 48.60 | 13.83 |
| Glrx | 1.10 | 0.06 | 6.42 | 0.33 | 3.57 | 0.22 | 4.19 | 0.26 | 1.14 | 0.08 |
| Ptp4a1 | 1.21 | 0.16 | 6.64 | 0.45 | 4.53 | 0.15 | 6.61 | 1.78 | 2.85 | 0.39 |
| Gas1 | 0.87 | 0.14 | 7.45 | 1.63 | 6.51 | 0.66 | 8.62 | 3.09 | 0.57 | 0.20 |
| Azin | 1.11 | 0.08 | 11.44 | 2.33 | 8.69 | 0.44 | 3.93 | 1.36 | 1.37 | 0.14 |
| Odc | 1.01 | 0.06 | 12.76 | 1.75 | 5.69 | 0.62 | 7.98 | 1.89 | 7.19 | 1.45 |
| Ier3 | 1.11 | 0.07 | 33.88 | 3.58 | 14.34 | 1.02 | 15.80 | 1.21 | 3.17 | 0.77 |
| Rgs2 | 1.35 | 0.10 | 76.70 | 12.83 | 25.66 | 3.10 | 29.31 | 4.61 | 9.67 | 1.24 |
Gata2, GATA binding protein 2; Nrp1, neuropilin 1; Pac-1, adenylate cyclase activating polypeptide 1 receptor 1; Anxa2, annexin A2; Homer2, homer homolog 2 (Drosophila); Por, P450 (cytochrome) oxidoreductase; Akr1b8, aldo-keto reductase family 1, member B8; Vil2, villin 2; Hspb8, 22-kDa heat shock protein 8; Egr1, early growth response 1; Glrx, glutaredoxin; Ptp4a1, protein tyrosine phosphatase 4a1; Gas1, growth arrest specific 1; Azin1, antizyme inhibitor 1; Odc1, ornithine decarboxylase, structural 1; Ier3, immediate early response 3; Rgs2, regulator of G-protein signaling 2.
Fig. 9.

Time course of induction of PACAP target genes. Time course effect of PACAP (100 nM; red ), forskolin (25 μM; orange), dbcAMP (1 mM; blue), NGF (100 ng/ml; yellow), and medium (green) on the expression of various PACAP target genes. GATA binding protein 2 (Gata2), neuropilin 1 (Nrp1), adenylate cyclase activating polypeptide 1 receptor 1 (Pac-1), annexin A2 (Anx2), homer homolog 2 (Drosophila) (Homer 2), P450 (cytochrome) oxidoreductase (Por). Aldo-keto reductase family 1, member B8 (Akr1b8), villin 2 (Vil2), heat shock 22kDa protein 8 (Hspb8), early growth response 1 (Egr1), glutaredoxin (Glx), protein tyrosine phosphatase 4a1 (Ptp4a1). Growth arrest specific 1 (Gas1), antizyme inhibitor 1 (Azin1), ornithine decarboxylase, structural 1 (Odc), immediate early response 3 (Ier3) and regulator of G-protein signaling 2 (Rgs2). Each time point represents the mean -fold expression (± S.E.M.) compared with the time 0 h as measured by real-time PCR. Data were corrected using glyceraldehyde-3-phosphate dehydrogenase (Gapdh) signal as internal control.
Regulation of cAMP- and PACAP-Dependent Genes by PKA and ERK
The effects of PACAP on neuritogenesis and cell size seem to be initiated by cAMP and mediated through downstream signal transduction mechanisms that include ERK but not PKA, whereas PACAP-induced growth arrest includes a PKA-dependent, or at least an H89-inhibited, component (Figs. 3, 6). The involvement of PKA and ERK in the regulation of three prominent cAMP- and PACAP-dependent transcripts identified by microarray cluster analysis, namely Ier3, Egr1, and Vil2, were further investigated by Q-RT-PCR in the presence and absence of H89 (10 μM) or U0126 (25 μM; Fig. 10). Ier3 induction was only slightly reduced in the presence of H89 but was strongly inhibited by U0126. Egr1 induction by PACAP was unaffected by H89 but completely blocked by U0126. Induction of Vil2 by PACAP was, like cell size, unaffected by H89 and blocked, but to a lesser degree than either neuritogenesis, or Ier3 or Egr1 induction, by U0126 (Fig. 10).
Fig. 10.
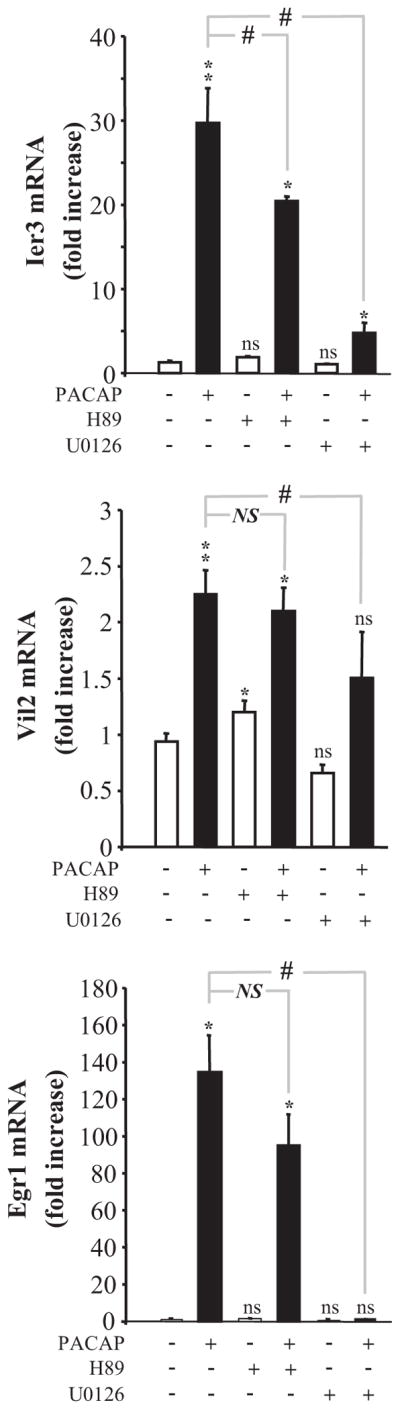
Involvement of the PKA and MAP kinase pathways in the effect of PACAP on the expression of immediate early response 3 (Ier3), villin 2 (Vil2), and early growth response 1 (Egr1). Cells were preincubated for 30 min with either H89 (10 μM) or U0126 (25 μM) and then incubated for 1 or 6 h with PACAP (100 nM). The level of expression of immediate early response 3 (Ier3) and villin 2 (Vil2) mRNA was quantified by real-time PCR after 6 h of treatment. The level of expression of early growth response 1 (Egr1) mRNA was quantified by real-time PCR after 1 h of treatment. Data were corrected using Gapdh signal as internal control. *, P < 0.05; **, P < 0.01, ns versus control; #, P < 0.05, NS versus PACAP; ns, not statistically significant versus control; NS, not statistically different.
Ier3, Egr1, and Vil2 were therefore deemed to be candidates for mediating neuritogenesis or regulation of cell size during PACAP-induced differentiation of PC12 cells. Other genes potentially involved in the control of PC12 cell differentiation were identified in the present study, but their function has not been tested because their regulation profile was inconsistent with involvement in those aspects of PACAP-induced cellular differentiation mediated through cAMP activation of ERK studied here. For instance, ornithine decarboxylase (Odc1) induction by PACAP was only partially blocked by U0126 or H89 and totally blocked by coincubation with both inhibitors (data not shown). Likewise, growth arrest specific 1 (Gas1) induction by PACAP was only partially sensitive to H89 and not blocked by U0126 (data not shown). Two additional genes, aldo keto reductase family 1, member B3 (Akr1b8) and cytochrome P450 oxydoreductase (Por) were also induced by PACAP, forskolin, dbcAMP, and NGF (Table 6) in an ERK-dependent, PKA-independent manner (data not shown) but were not studied further.
Functional Investigation of cAMP-Dependent, PKA-Independent Genes Regulated by PACAP as Candidate Mediators of PACAP Signaling for Neuritogenesis, Cell Size, and Growth Arrest
Based on microarray and Q-RT-PCR results, functional investigations were conducted on three transcripts (i.e., Ier3, Vil2, and Egr1) that are regulated through the cAMP/ERK pathway independently of PKA. Trans-fection with cognate siRNA consistently reduced Ier3, Vil2, and Egr1 induction by PACAP to the levels shown in Fig. 11A. Only Egr1 siRNA blocked PACAP-induced neurite outgrowth (Fig. 11B). This observation was confirmed by quantification of the total neurite length, which was reduced by 4-fold when cells were treated with PACAP in the presence of siRNA targeting Egr1 (Fig. 11E). Blocking Vil2 expression reduced the percentage of cells with a diameter above 17 μm, whereas Ier3 and Egr1 had no effect on cell size (Fig. 11, C–E). The effect of Vil2 on cell size was fractional (approximately 30%), suggesting that Vil2 may be only one of several effectors of altered cell size accompanying PACAP-induced PC12 cell differentiation. Neither Vil2, Ier3, nor Egr1 silencing affected growth arrest mediated by PACAP (Fig. 11, C–E), consistent with the PKA-dependent component of PACAP-induced growth arrest of PC12 cells described earlier. Among the transcripts regulated in common within the first 6 h of exposure to PACAP, dibutyryl cAMP, or forskolin, those wholly or partially dependent on PKA would be candidate mediators of growth arrest by PACAP, including both induced and pre-existing proteins regulated by NGF and reported to be involved in NGF-induced growth arrest in PC12 cells (Greene and Tischler, 1976).
Rap1 Involvement in PACAP Activation of Egr1
Silencing the expression of the cAMP- and ERK-regulated Egr1 transcript evoked the most profound and specific functional response seen in this study, inhibiting PACAP-induced neuritogenesis without affecting cell size or proliferation. We therefore focused on the activity of this trans-activator to link regulation of neuritogenesis through cAMP via ERK to PACAP-dependent activation of Rap1. An Egr1-responsive reporter gene, pEgr-Luc, driving luciferase gene expression, was transfected into PC12 cells to assay functional Egr1 activation by PACAP. PACAP treatment of transfected PC12 cells induced an approximately 10-fold increase in Egr1 reporter activity compared with vehicle (Fig. 12). To test whether Rap1 was involved in this PACAP-dependent signaling pathway to Egr1 activation, Rap1b DN was cotrans-fected with the Egr1 reporter before treatment with PACAP. Cotransfection of the Rap1b DN significantly reduced the PACAP-induced Egr1 reporter activity, indicating that Egr1 transcription, its functional transactivation of Egr1-dependent transcription, or both are stimulated by PACAP through Rap1 or a Rap1-like GTP-binding protein (Fig. 12).
Fig. 12.

Involvement of Rap1 in PACAP-mediated induction of early growth response 1 (Egr1) reporter gene. PC12 cells were transiently transfected with an Egr1 response element containing reporter plasmid and cotransfected with a dominant-negative Rap1 or control plasmid. Total DNA per transfection was held constant by addition of the promot-erless vector pGEM. Cells were then treated with PACAP (100 nM) for 6 h and Egr1 expression was measured by dual-luciferase activity. Data represent the mean ± S.E.M. of three to seven independent experiments, analyzed by one-way analysis of variance with a Tukey post test with Prism software. ***, p < 0.001 compared with vehicle; NS versus vehicle; ##, p < 0.01 compared with PACAP induction of Egr1.
Discussion
The PC12 cell line has been widely used to investigate the various effects of PACAP on neuronal differentiation including neuritogenesis (Deutsch and Sun, 1992; Lazarovici et al., 1998), inhibition of cell division (Deutsch and Sun, 1992), stimulation of expression of neuroendocrine-specific genes such as neuropeptide Y and tyrosine hydroxylase (Corbitt et al., 1998) and changes in electrical excitability and secretion (Taupenot et al., 1999; Osipenko et al., 2000; Grumolato et al., 2003). The aim of the present study was to elucidate the signal transduction pathways leading to specific aspects of differentiation (neuritogenesis, cell size, and cell proliferation) induced by PACAP, through stringent correlation of the regulation of signaling molecules, target genes, and functional outcomes of PACAP treatment. The major finding of this investigation was that PACAP initiated a cAMP-dependent, PKA-independent activation of ERK that leads to egr1 transcription and activation, and subsequent Egr1-dependent neuritogenesis. Cyclic AMP-dependent, PKA-independent activation of ERK also leads to villin2 transcription, which is partly responsible for increased cell size after PACAP treatment. Cessation of proliferation induced by PACAP is unaffected by transcription of either of these two target genes, consistent with the partial PKA dependence of the antiproliferative effect of PACAP on PC12 cells.
We have used cDNA microarray in conjunction with biochemical analysis to establish the existence of a cAMP-dependent, PKA-independent signaling pathway responsible for activating ERK, and a discrete set of downstream target genes in PC12 cells in response to PACAP. The functional importance of this pathway was further tested by comparing the cellular and biochemical profiles observed for inhibition of PACAP- and cAMP-initiated neuritogenesis, increase in cell size, and cessation of cell division. This concordance has led in turn to the functional identification of two transcripts, those encoding Egr1 and Vil2, whose up-regulation was demonstrated through gene silencing to be required in two distinct pathways leading to PACAP-mediated neurite extension and increased cell size, respectively. Vil2 codes for a protein that has been shown to be involved in microvilli formation in intestinal epithelium by regulating actin poly-merization (Craig and Powell, 1980). Some transcripts with a high sequence homology to Vil2 such as pervillin and advillin have been shown to promote neurite outgrowth in dorsal root ganglion and sympathetic neurons (Ravenall et al., 2002; Shibata et al., 2004), suggesting that a cohort of Vil2-related proteins may contribute to regulation of cell size during differentiation initiated by PACAP in PC12 cells. A third transcript, Ier3, that is prominently regulated by PACAP is apparently not involved in either of these processes and may contribute to aspects of the overall differentiation program initiated by PACAP (Taupenot et al., 1999; Osipenko et al., 2000; Grumolato et al., 2003); however, these linkages have not yet been uncovered. We have not identified any genes involved in the control of cell proliferation by PACAP. In this regard, future experiments will focus on transcripts such as Gas1, whose induction by PACAP requires PKA.
The pathways leading to cAMP-dependent and PKA-independent regulation of neurite outgrowth and cell size by PACAP are summarized in Fig. 13. These two pathways are biochemically distinct from each other, and also from the partially PKA-dependent signal transduction pathway leading to growth arrest. The combined biochemical, microarray, and gene silencing study performed here provides compelling evidence that PACAP-induced neuritogenesis proceeds through elevation of cAMP, activation of ERK through Rap1 or a Rap1-like GTP-binding protein, and subsequent increase in Egr1 trans-activation (Fig. 13).
Fig. 13.

Schematic representation summarizing the intracellular events involved in the neurotrophic activities of PACAP on PC12 cells. PACAP induction of Egr1expression is required for neuritogenesis. This effect of PACAP proceeds through a cAMP/ERK-dependent, PKA-independent pathway. PACAP also increases cell size by inducing effectors such as villin 2. Finally, PACAP blocks cell proliferation in a partially PKA-dependent manner through transcription mechanisms that remain to be identified. AC, adenylate cyclase; DAG, diacyl glycerol; PLC, phospho-lipase C; PMA, phorbol 12-myristate 13-acetate. Full arrow, established regulation; dotted arrow, assumed regulation.
ERK activation is critical for neuritogenesis induced by both NGF and PACAP (Barrie et al., 1997), and indeed phosphorylation of ERK is itself sufficient to induce neurite outgrowth (Robinson et al., 1998). However, activation of ERK per se can occur through multiple pathways with diverse functional sequelae. In fact, it has been previously reported that cAMP, PACAP, NGF, and phorbol 12-myristate 13-acetate all elicit sustained activation of ERK in PC12 cells, yet neuritogenesis stimulated by NGF, but not PACAP, proceeds through activation of Ras (Young et al., 1994; Lazarovici et al., 1998), whereas phorbol 12-myristate 13-acetate does not stimulate neuritogenesis at all. Furthermore, stimulation of ERK by NGF or cAMP leading to transin gene activation proceeds through activation of PKA (Yao et al., 1998), but that leading to neuritogenesis stimulated by PACAP does not (current study). The best working hypothesis for these disparate effects of ERK activation by distinct signaling path-ways may be that both the duration of ERK signaling and the cellular compartment in which ERK activation occurs provide discrete ERK signaling “signatures” with distinct functional outcomes for the cell (MacCormick et al., 2004; Gerdin and Eiden, 2007). This hypothesis is supported by a recent report that Epac stimulates ERK through Rap1 in PC12 cells only if Epac is localized to the plasma membrane by addition of a CAAX motif and not when Rap1 is activated through endogenous Epac stimulation by 8-chlorophenylthio-2-methyl cAMP (Wang et al., 2006). It will be important to determine whether our finding of a cAMP-dependent, PKA-independent activation of ERK in the PC12 pheochromocytoma neuroendocrine cell line by PACAP corresponds to the existence of such a pathway in postmitotic primary neuroendocrine and neuronal cells. We are currently investigating this possibility, and have observed cAMP-dependent, H89-resistant ERK activation in bovine chromaffin cells (M. J. Gerdin, unpublished observations).
Egr1 is the transcript that exhibited the highest induction after NGF, PACAP, forskolin, and dbcAMP treatment, and activation of Egr1 by PACAP is dependent on the activation of Rap1. Reducing Egr1 expression with siRNA blocked the ability of PACAP to promote neuritogenesis without affecting its growth arrest effect (Fig. 13). After treatment with NGF, Egr1 acts as a transactivator to promote p35 expression, which, by binding to the cyclin-dependent kinase cdk5, induces neurite outgrowth (Harada et al., 2001). PACAP- and NGF-induced differentiation exhibit both similarities and differences in terms of mechanisms and phenotypes (Vaudry et al., 2002b). In fact, although signaling elements may be conserved in PACAP and NGF induction of neuritogenesis, our microarray analysis also shows marked differences in NGF and PACAP target gene induction. This is wholly consistent with Egr1 response element-specific transactivation by PACAP, in contrast with the intriguing results of Levkovitz and Baraban (2002) indicating that NGF stimulation of neurite outgrowth depends not on Egr1-dependent transactivation directly at genes containing an Egr1-response element but rather on Egr1 activation of c-Jun via Egr1/c-Jun heterodimerization.
Our results support the view that neurotrophin-driven differentiation is a process that occurs through simultaneous activation of multiple parallel signaling events, rather than a single common master pathway relying on a few common signaling intermediates. Neuritogenesis and cessation of proliferation initiated by NGF, for example, have been dissected into separate p53-dependent and -independent processes (Hughes et al., 2001). Likewise, it is now clear that PACAP signaling for neuritogenesis, cell size, growth arrest, and probably also for neuron-specific gene expression depend on separate, parallel pathways that diverge as early as multiple downstream targets for cAMP in PC12 cells.
Acknowledgments
This work was funded by the National Institute of Mental Health (NIMH) Intramural Research Program Project 1Z01-MH002386-20, Institut National de la Santéet de la Recherche Médicale (U413), the European Institute for Peptide Research (l’Institut Fédératif de Recherches Multidisciplinaires sur les Peptides 23), the Association pour la Recherche sur le Cancer and the Conseil Régional de Haute-Normandie. A.R. was the recipient of a doctoral fellowship from the Ministry of Education.
We thank Dr. Elisabeth Bock (Institute of Molecular Pathology, University of Copenhagen, Denmark) for the generous gift of the dominant-negative Rap1b (S17N) and Dr. Michel Philippe (University of Poitiers, France), for providing the GST-Ral-RBD fusion proteins. We thank Tomris Mustafa, Nikolas Stroth, and members of the Eiden lab for critical reading of the manuscript. We also thank Dr. Abdel Elkahloun (National Human Genome Research Institute, National Institutes of Health) for assistance with the microarray.
ABBREVIATIONS
- NGF
nerve growth factor
- dbcAMP
N6,2′-O-dibutyryladenosine 3′,5′-cyclic monophosphate
- ddAd
2′,5′-dideoxyadenosine
- Egr1
early growth response 1
- ERK
extracellular signal-regulated protein kinase
- Gapdh
glyceraldehyde-3-phosphate dehydrogenase
- GST
glutathione transferase
- H7
1-(5-Isoquinolinesulfonyl)-2-methylpiperazine
- H89
N-[2-(p-bromocinnamylamino)ethyl]-5-isoquinolinesulfonamide dihydrochloride
- Ier3
immediate early response 3
- IRES
internal ribosome entry site
- MAP
mitogen-activated protein
- MEK
mitogen-activated protein kinase kinase
- PAC1
PACAP specific receptor
- PACAP
pituitary adenylate cyclase-activating polypeptide
- PCR
polymerase chain reaction
- PD98059
2′-amino-3′-methoxyflavone
- PKA
protein kinase A
- PKC
protein kinase C
- PLC
phospholipase C
- Q-RT-PCR
quantitative reverse transcription-polymerase chain reaction
- Rap1
member of RAS oncogene family
- RBD
Rap binding domain
- RT-PCR
reverse transcription-polymerase chain reaction
- siRNA
small interfering RNA
- SSC
saline-sodium citrate
- U0126
1,4-diamino-2,3-dicyano-1,4-bis(methylthio-)butadiene
- Vil2
villin 2
- VIP
vasoactive intestinal polypeptide
- VPAC
PACAP and VIP receptor
References
- Barrie AP, Clohessy AM, Buensuceso CS, Rogers MV, Allen JM. Pituitary adenylyl cyclase-activating peptide stimulates extracellular signal-regulated kinase 1 or 2 (ERK1/2) activity in a ras-independent, mitogen-activated protein kinase/ERK kinase 1 or 2-dependent manner in PC12 cells. J Biol Chem. 1997;272:19666–19671. doi: 10.1074/jbc.272.32.19666. [DOI] [PubMed] [Google Scholar]
- Bouschet T, Perez V, Fernandez C, Bockaert J, Eychene A, Journot L. Stimulation of the ERK pathway by GTP-loaded Rap1 requires the concomitant activation of Ras, protein kinase C, and protein kinase A in neuronal cells. J Biol Chem. 2003;278:4778–4785. doi: 10.1074/jbc.M204652200. [DOI] [PubMed] [Google Scholar]
- Chen Y, Samal B, Hamelink CR, Xiang CC, Chen Y, Chen M, Vaudry D, Brownstein MJ, Hallenbeck JM, Eiden LE. Neuroprotection by endogenous and exogenous PACAP following stroke. Regul Pept. 2006;137:4–19. doi: 10.1016/j.regpep.2006.06.016. [DOI] [PMC free article] [PubMed] [Google Scholar]
- Corbitt J, Vivekananda J, Wang SS, Strong R. Transcriptional and posttranscriptional control of tyrosine hydroxylase gene expression during persistent stimulation of pituitary adenylate cyclase-activating polypeptide receptors on PC12 cells: Regulation by protein kinase A-dependent and protein kinase A-independent pathways. J Neurochem. 1998;71:478–486. doi: 10.1046/j.1471-4159.1998.71020478.x. [DOI] [PubMed] [Google Scholar]
- Craig SW, Powell LD. Regulation of actin polymerization by villin, a 95,000 dalton cytoskeletal component of intestinal brush borders. Cell. 1980;22:739–746. doi: 10.1016/0092-8674(80)90550-4. [DOI] [PubMed] [Google Scholar]
- Das KP, Freudenrich TM, Mundy WR. Assessment of PC12 cell differentiation and neurite growth: a comparison of morphological and neurochemical measures. Neurotoxicol Teratol. 2004;26:397–406. doi: 10.1016/j.ntt.2004.02.006. [DOI] [PubMed] [Google Scholar]
- Deutsch PJ, Sun Y. The 38-amino acid form of pituitary adenylate cyclase-activating polypeptide stimulates dual signaling cascades in PC12 cells and promotes neurite outgrowth. J Biol Chem. 1992;267:5108–5113. [PubMed] [Google Scholar]
- Gerdin MJ, Eiden LE. Regulation of PC12 cell differentiation by cAMP signaling to ERK independent of PKA: do all the connections add up? Sci STKE. 2007:pe15. doi: 10.1126/stke.3822007pe15. [DOI] [PMC free article] [PubMed] [Google Scholar]
- Ginty DD, Fanger GR, Wagner JA, Maue RA. The activity of cAMP-dependent protein kinase is required at a posttranslational level for induction of voltage-dependent sodium channels by peptide growth factors in PC12 cells. J Cell Biol. 1992;116:1465–1473. doi: 10.1083/jcb.116.6.1465. [DOI] [PMC free article] [PubMed] [Google Scholar]
- Ginty DD, Glowacka D, DeFranco C, Wagner JA. Nerve growth factor-induced neuronal differentiation after dominant repression of both type I and type II cAMP-dependent protein kinase activities. J Biol Chem. 1991;266:15325–15333. [PubMed] [Google Scholar]
- Greene LA, Tischler AS. Establishment of a noradrenergic clonal line of rat adrenal pheochromocytoma cells which respond to nerve growth factor. Proc Natl Acad Sci U S A. 1976;73:2424–2428. doi: 10.1073/pnas.73.7.2424. [DOI] [PMC free article] [PubMed] [Google Scholar]
- Grumolato L, Louiset E, Alexandre D, Ait-Ali D, Turquier V, Fournier A, Fasolo A, Vaudry H, Anouar Y. PACAP and NGF regulate common and distinct traits of the sympathoadrenal lineage: effects on electrical properties, gene markers and transcription factors in differentiating PC12 cells. Eur J Neurosci. 2003;17:71–82. doi: 10.1046/j.1460-9568.2003.02426.x. [DOI] [PubMed] [Google Scholar]
- Hamelink C, Lee HW, Chen Y, Grimaldi M, Eiden LE. Coincident elevation of cAMP and calcium influx by PACAP-27 synergistically regulates vasoactive intestinal polypeptide gene transcription through a novel PKA-independent signaling pathway. J Neurosci. 2002;22:5310–5320. doi: 10.1523/JNEUROSCI.22-13-05310.2002. [DOI] [PMC free article] [PubMed] [Google Scholar]
- Harada T, Morooka T, Ogawa S, Nishida E. ERK induces p35, a neuron-specific activator of Cdk5, through induction of Egr1. Nat Cell Biol. 2001;3:453–459. doi: 10.1038/35074516. [DOI] [PubMed] [Google Scholar]
- Harmar AJ, Arimura A, Gozes I, Journot L, Laburthe M, Pisegna JP, Rawlings SR, Robberecht P, Said SI, Sreedharan SP, et al. International Union of Pharmacology. XVIII. Nomenclature of receptors for vasoactive intestinal peptide and pituitary adenylate cyclase-activating polypeptide. Pharmacol Rev. 1998;50:265–270. [PMC free article] [PubMed] [Google Scholar]
- Hughes AL, Messineo-Jones D, Lad SP, Neet KE. Distinction between differentiation, cell cycle, and apoptosis signals in PC12 cells by the nerve growth factor mutant delta9/13, which is selective for the p75 neurotrophin receptor. J Neurosci Res. 2001;63:10–19. doi: 10.1002/1097-4547(20010101)63:1<10::AID-JNR2>3.0.CO;2-R. [DOI] [PubMed] [Google Scholar]
- Kienlen Campard P, Crochemore C, René F, Koch B, Loeffler JP. PACAP type I receptor activation promotes cerebellar neuron survival through the cAMP/ PKA signaling pathway. DNA Cell Biol. 1997;16:323–333. doi: 10.1089/dna.1997.16.323. [DOI] [PubMed] [Google Scholar]
- Lazarovici P, Jiang H, Fink D., Jr The 38-amino-acid form of pituitary adenylate cyclase-activating polypeptide induces neurite outgrowth in PC12 cells that is dependent on protein kinase C and extracellular signal-regulated kinase but not on protein kinase A, nerve growth factor receptor tyrosine kinase, p21ras G protein, and pp60c-src cytoplasmic tyrosine kinase. Mol Pharmacol. 1998;54:547–558. doi: 10.1124/mol.54.3.547. [DOI] [PubMed] [Google Scholar]
- Levkovitz Y, Baraban JM. A dominant negative Egr inhibitor blocks nerve growth factor-induced neurite outgrowth by suppressing c-Jun activation: role of an Egr/c-Jun complex. J Neurosci. 2002;22:3845–3854. doi: 10.1523/JNEUROSCI.22-10-03845.2002. [DOI] [PMC free article] [PubMed] [Google Scholar]
- MacCormick M, Moderscheim T, van der Salm LW, Moore A, Pryor SC, McCaffrey G, Grimes ML. Distinct signalling particles containing Erk/Mek and B-Raf in PC12 cells. Biochem J. 2005;387:155–164. doi: 10.1042/BJ20040272. [DOI] [PMC free article] [PubMed] [Google Scholar]
- Obara Y, Labudda K, Dillon TJ, Stork PJ. PKA phosphorylation of Src mediates Rap1 activation in NGF and cAMP signaling in PC12 cells. J Cell Sci. 2004;117:6085–6094. doi: 10.1242/jcs.01527. [DOI] [PubMed] [Google Scholar]
- Ohtaki H, Nakamachi T, Dohi K, Aizawa Y, Takaki A, Hodoyama K, Yofu S, Hashimoto H, Shintani N, Baba A, et al. Pituitary adenylate cyclase-activating polypeptide (PACAP) decreases ischemic neuronal cell death in association with IL-6. Proc Natl Acad Sci U S A. 2006;103:7488–7493. doi: 10.1073/pnas.0600375103. [DOI] [PMC free article] [PubMed] [Google Scholar]
- Osipenko ON, Barrie AP, Allen JM, Gurney AM. Pituitary adenylyl cyclase-activating peptide activates multiple intracellular signaling pathways to regulate ion channels in PC12 cells. J Biol Chem. 2000;275:16626–16631. doi: 10.1074/jbc.M909636199. [DOI] [PubMed] [Google Scholar]
- Qiu J, Cai D, Filbin MT. A role for cAMP in regeneration during development and after injury. Prog Brain Res. 2002;137:381–387. doi: 10.1016/s0079-6123(02)37029-8. [DOI] [PubMed] [Google Scholar]
- Rausch DM, Iacangelo AL, Eiden LE. Glucocorticoid- and nerve growth factor-induced changes in chromogranin A expression define two different neuronal phenotypes in PC12 cells. Mol Endocrinol. 1988;2:921–927. doi: 10.1210/mend-2-10-921. [DOI] [PubMed] [Google Scholar]
- Ravenall SJ, Gavazzi I, Wood JN, Akopian AN. A peripheral nervous system actin-binding protein regulates neurite outgrowth. Eur J Neurosci. 2002;15:281–290. doi: 10.1046/j.0953-816x.2001.01862.x. [DOI] [PubMed] [Google Scholar]
- Ravni A, Eiden LE, Vaudry H, Gonzalez BJ, Vaudry D. Cycloheximide treatment to identify components of the transitional transcriptome in PACAP-induced PC12 cell differentiation. J Neurochem. 2006;98:1229–1241. doi: 10.1111/j.1471-4159.2006.03962.x. [DOI] [PMC free article] [PubMed] [Google Scholar]
- Reglodi D, Somogyvari-Vigh A, Vigh S, Kozicz T, Arimura A. Delayed systemic administration of PACAP38 is neuroprotective in transient middle cerebral artery occlusion in the rat. Stroke. 2000;31:1411–1417. doi: 10.1161/01.str.31.6.1411. [DOI] [PubMed] [Google Scholar]
- Robinson MJ, Stippec SA, Goldsmith E, White MA, Cobb MH. A constitutively active and nuclear form of the MAP kinase ERK2 is sufficient for neurite outgrowth and cell transformation. Curr Biol. 1998;8:1141–1150. doi: 10.1016/s0960-9822(07)00485-x. [DOI] [PubMed] [Google Scholar]
- Shibata M, Ishii J, Koizumi H, Shibata N, Dohmae N, Takio K, Adachi H, Tsujimoto M, Arai H. Type F scavenger receptor SREC-I interacts with advillin, a member of the gelsolin/villin family, and induces neurite-like outgrowth. J Biol Chem. 2004;279:40084–40090. doi: 10.1074/jbc.M403844200. [DOI] [PubMed] [Google Scholar]
- Stessin AM, Zippin JH, Kamenetsky M, Hess KC, Buck J, Levin LR. Soluble adenylyl cyclase mediates nerve growth factor-induced activation of Rap1. J Biol Chem. 2006;281:17253–17258. doi: 10.1074/jbc.M603500200. [DOI] [PMC free article] [PubMed] [Google Scholar]
- Tanaka J, Koshimura K, Murakami Y, Kato Y. Stimulatory effect of PACAP on neuronal cell survival. Ann N Y Acad Sci. 1996;805:473–475. doi: 10.1111/j.1749-6632.1996.tb17506.x. [DOI] [PubMed] [Google Scholar]
- Taupenot L, Mahata M, Mahata SK, O’Connor DT. Time-dependent effects of the neuropeptide PACAP on catecholamine secretion. Stimulation and desensitization. Hypertension. 1999;34:1152–1162. doi: 10.1161/01.hyp.34.5.1152. [DOI] [PubMed] [Google Scholar]
- Vaudry D, Chen Y, Ravni A, Hamelink C, Elkahloun AG, Eiden LE. Analysis of the PC12 cell transcriptome after differentiation with pituitary adenylate cyclase-activating polypeptide (PACAP) J Neurochem. 2002a;83:1272–1284. doi: 10.1046/j.1471-4159.2002.01242.x. [DOI] [PMC free article] [PubMed] [Google Scholar]
- Vaudry D, Stork PJ, Lazarovici P, Eiden LE. Signaling pathways for PC12 cell differentiation: making the right connections. Science. 2002b;296:1648–1649. doi: 10.1126/science.1071552. [DOI] [PubMed] [Google Scholar]
- Vossler MR, Yao H, York RD, Pan M-G, Rim CS, Stork PJS. cAMP activates MAP kinase and elk-1 through a B-raf and rap1-dependent pathway. Cell. 1997;89:73–82. doi: 10.1016/s0092-8674(00)80184-1. [DOI] [PubMed] [Google Scholar]
- Wang Z, Dillon TJ, Pokala V, Mishra S, Labudda K, Hunter B, Stork PJ. Rap1-mediated activation of extracellular signal-regulated kinases by cyclic AMP is dependent on the mode of Rap1 activation. Mol Cell Biol. 2006;26:2130–2145. doi: 10.1128/MCB.26.6.2130-2145.2006. [DOI] [PMC free article] [PubMed] [Google Scholar]
- Yao H, York RD, Misra-Press A, Carr DW, Stork PJS. The cyclic adenosine monophosphate-dependent protein kinase (PKA) is required for the sustained activation of mitogen-activated kinases and gene expression by nerve growth factor. J Biol Chem. 1998;273:8240–8247. doi: 10.1074/jbc.273.14.8240. [DOI] [PubMed] [Google Scholar]
- York RD, Yao H, Dillon T, Ellig CL, Eckert SP, McCleskey EW, Stork PJS. Rap1 mediates sustained MAP kinase activation induced by nerve growth factor. Nature. 1998;392:622–626. doi: 10.1038/33451. [DOI] [PubMed] [Google Scholar]
- Young SW, Dickens M, Tavare JM. Differentiation of PC12 cells in response to a cAMP analogue is accompanied by sustained activation of mitogen-activated protein kinase. Comparison with the effects of insulin, growth factors and phorbol esters. FEBS Lett. 1994;338:212–216. doi: 10.1016/0014-5793(94)80367-6. [DOI] [PubMed] [Google Scholar]